Downloaded 942 times


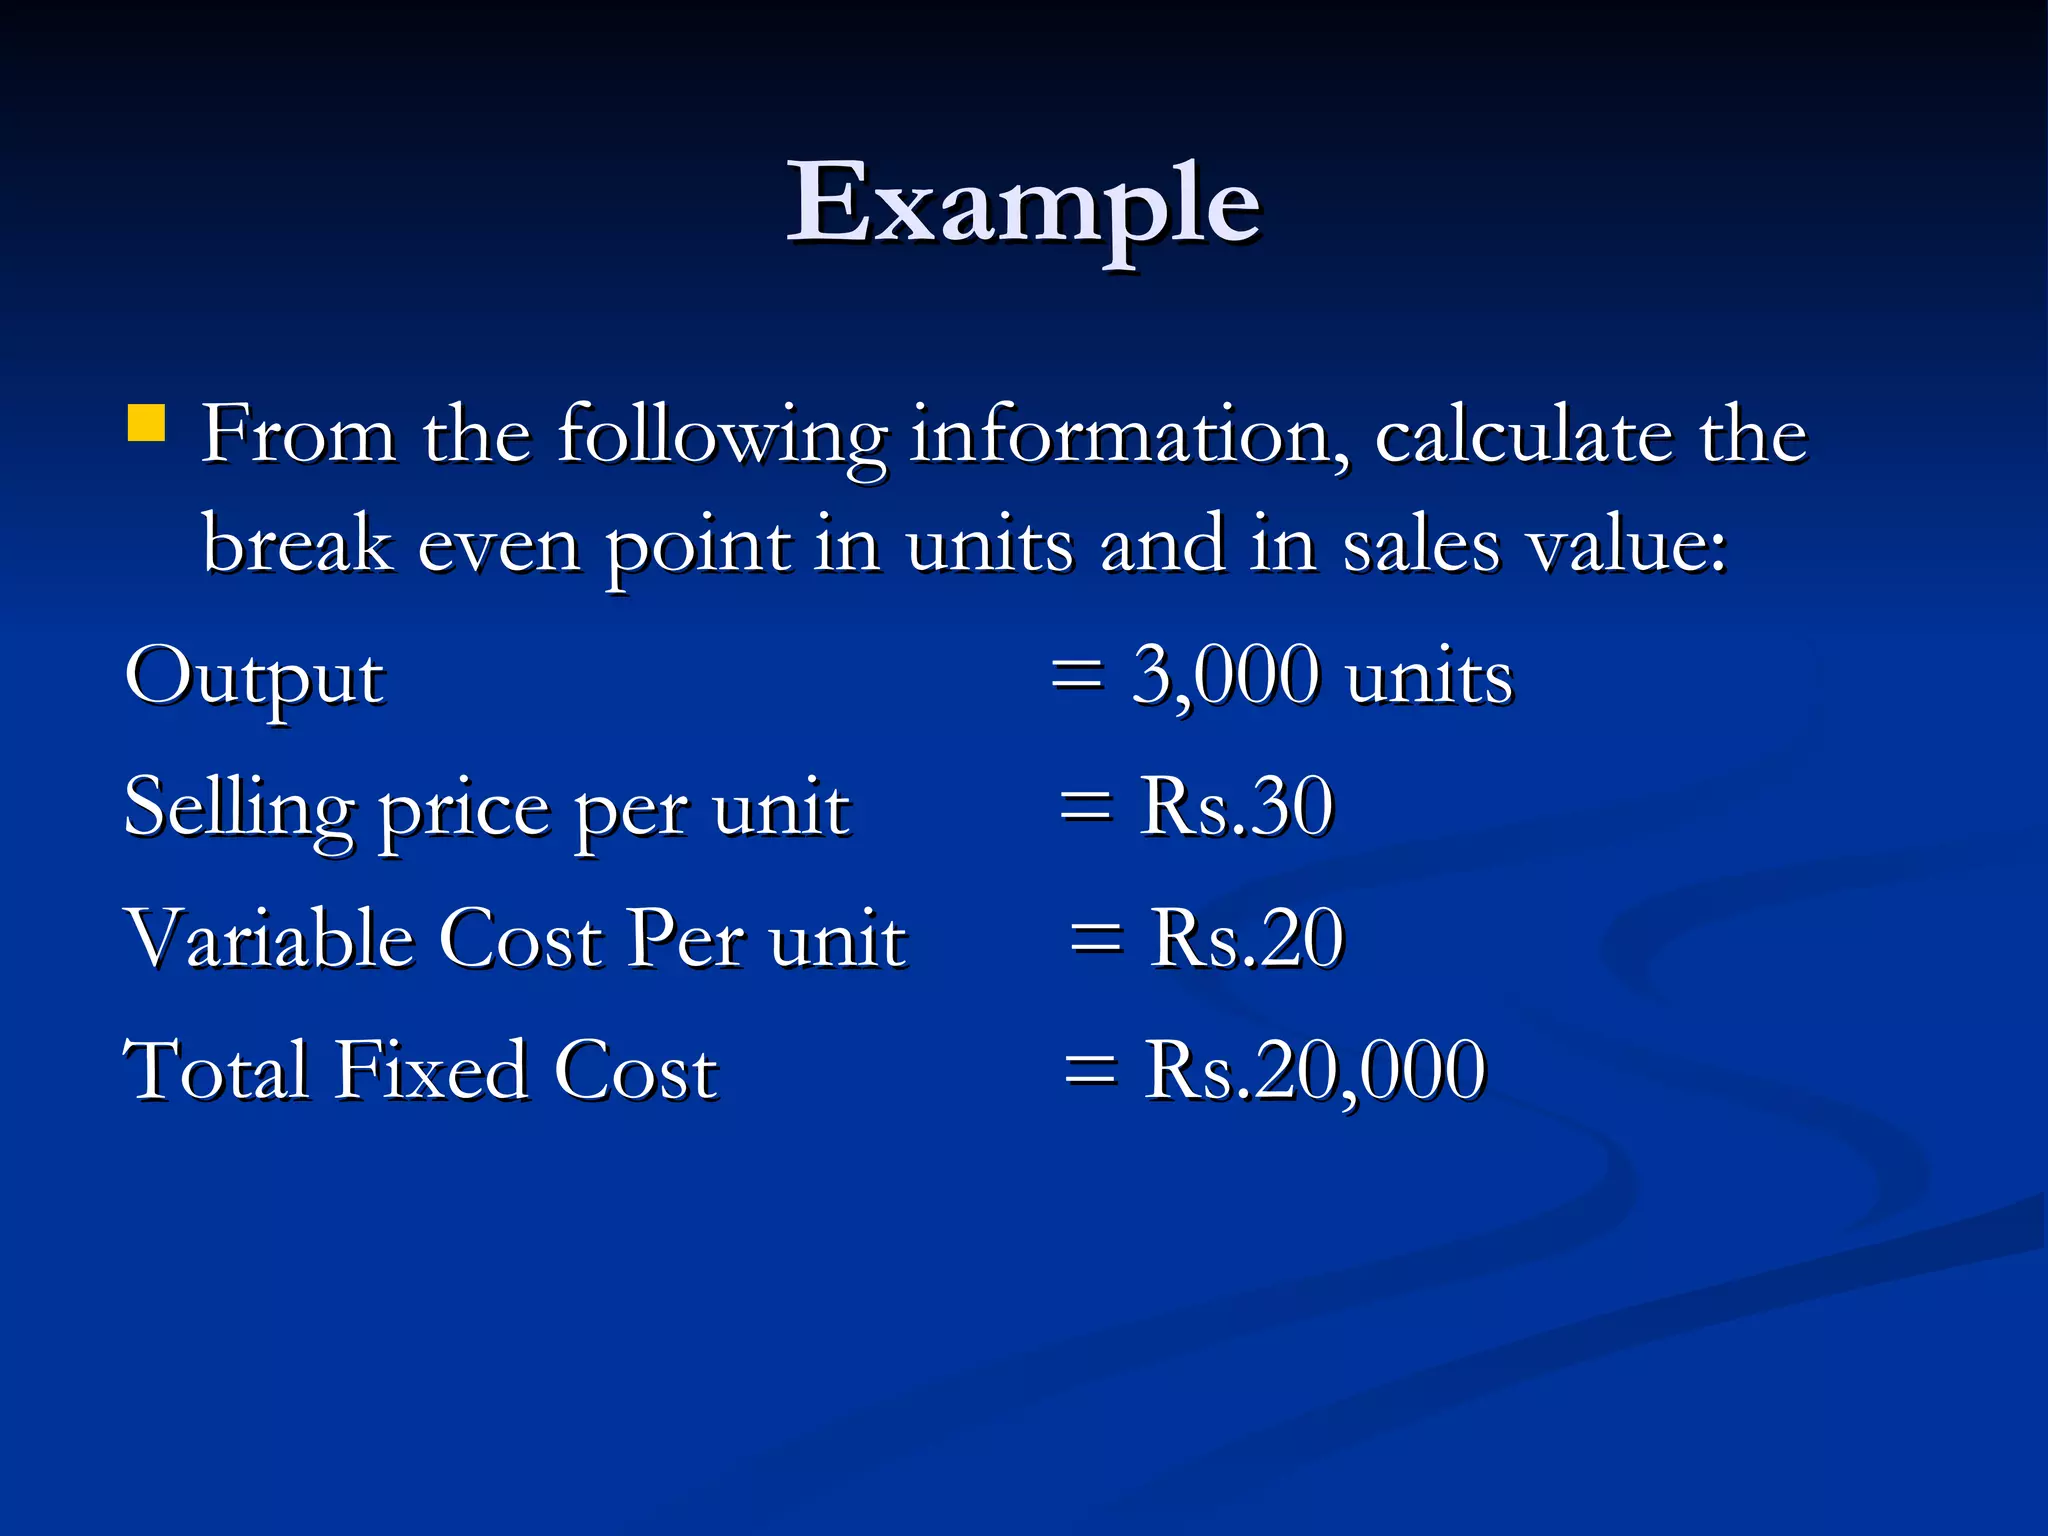


CVP analysis helps managers understand the relationship between cost, volume, and profit by examining how price, volume, variable costs, fixed costs, and product mix interact. It is used to determine what products to make/sell, pricing policies, marketing strategies, and facility investments. The break-even point is where total costs and revenues are equal, and no profit or loss has occurred. Marginal costing is used to set optimal prices, evaluate price reductions, choose product mixes, calculate safety margins, and set different prices for different customers.


