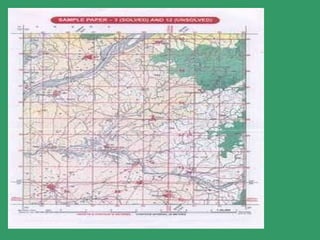
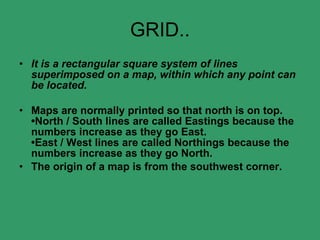
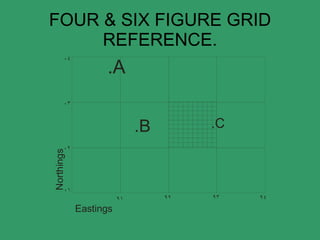
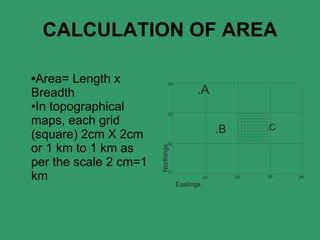
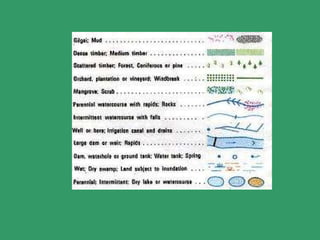
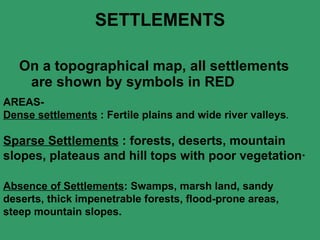
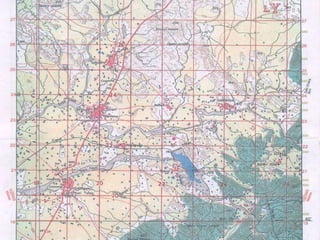
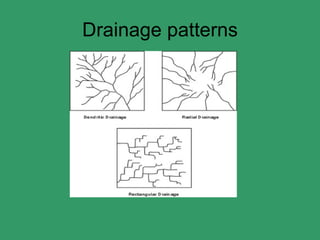
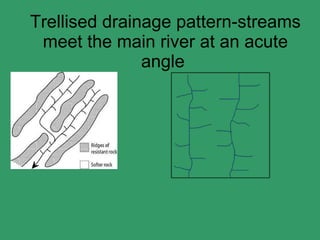
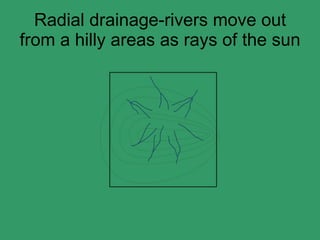
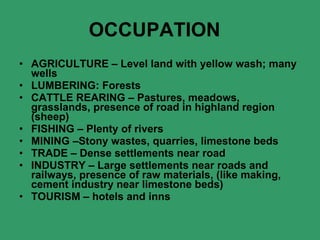
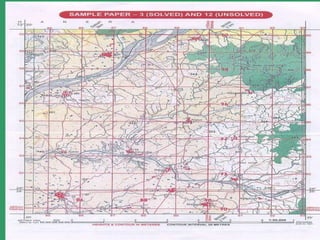
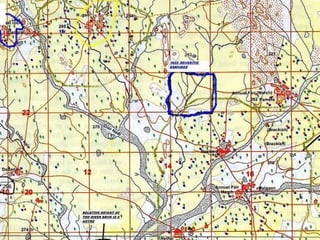
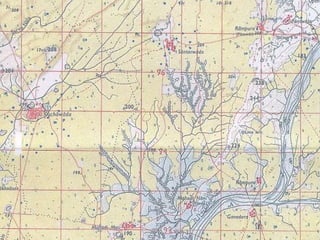
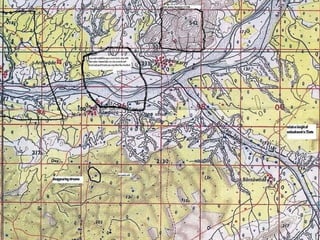
STUDY OF A TOPOGRAPHICAL MAP
A MAP & A DIAGRAM DIAGRAM-is  a sketch of something where the  area shown on paper is not true   to land area MAP-  is the correct ground area represented on paper according to scale.
Topographical maps A topographical map is that which shows both natural and manmade features. If in a  physical map, latitudes and longitudes are the basis for the study of a region, than in a topographical map, Eastings and Northings are important to locate a place in a topographical map .
Use of a topographical map.. Topographic maps have multiple uses in the present day:  any type of geographic planning or large-scale architecture,  earth science and many other geographic disciplines;  mining and recreational uses such as hiking or, in particular orienteering, which uses highly detailed maps in its standard requirements.
SCALE Scale is the ratio between the distance of any two points on the map and the actual distance of the same points on the ground. The scale of the given map extract is 2 cm: 1 km or 1:50,000.
 
REPRESENTATIVE FRACTION SCALE- In the map, 1:50,000 is the R.F. of the map, which means that one unit on the map represents 50,000 units on the ground. For example, 1 cm on the map represents 50,000 cm on the ground. It is a universally accepted scale due to the use of  local unit of measurement of distance in a place.
STATEMENT SCALE The scale may be indicated in the form of a written statement.  For example 1cm on the map represents 1 km on the ground. The scale is written as 1 cm = 1 km.
Linear Scale or Graphical Scale.   This scale is expressed as a horizontal or straight line. The base line is  to express visual equivalents of representative fraction or verbal scale. 
GRID.. It is a rectangular square system of lines superimposed on a map, within which any point can be located. Maps are normally printed so that north is on top. •North / South lines are called Eastings because the numbers increase as they go East. •East / West lines are called Northings because the numbers increase as they go North. The origin of a map is from the southwest corner.
FOUR & SIX FIGURE GRID REFERENCE.
What are Eastings and Northings? 1.Eastings run – move left to right; and 2.Northings run – bottom to top. Eastings are always quoted first and then the Northings.
DIRECTIONS They been defined as an imaginary straight line on the map or the ground showing the angular position of various maps with respect to a common base direction. 
CALCULATION OF AREA • Area= Length x Breadth •In topographical  maps, each grid (square) 2cm X 2cm or 1 km to 1 km as per the scale 2 cm=1 km
COLOURS 1.  BLACK  – All names, river banks, broken ground, dry   streams, surveyed trees, heights and their numbering, railway lines, telephone and    telegraph lines, lines of latitude and longitude.
BLUE –   Water features or water bodies that contain water. GREEN – All wooded and   forested areas, orchards, scattered trees and scrubs. YELLOW – All cultivated areas are shown with a yellow wash. WHITE PATCHES – Uncultivable land
Colours Prominent surveyed trees are shown in black. Surveyed trees have numbers on their trunks. They serve as landmarks and are not allowed to be cut. RED – Grid lines (Eastings and Northings) and their numbering, roads, cart tracks, settlements, huts and buildings
BROWN – Contour lines, their numbering, form lines, and sand features such as sand hills and dunes.
RELIEF Principal topographic features depicted on these maps are relief, drainage, swamps and lakes, forests, villages, towns, means of transport and communication like roads and railways, and canals.
Representation of Relief on the Map and its Interpretation Uneven  – made up of hills, plains, plateaus, lowland which are varying in their elevation or heights from sea level. •It can be represented on the maps through different methods, such as spot heights, contouring, etc.
CONTOURS • A contour is a line on a map joining two points of equal height, and is the standard method of showing relief on a topographical map. Contours are shown at regular vertical intervals. On a 1:50,000 map the interval is 10 or 20metres.
4. CONTOUR INTERVAL: The interval between two consecutive contours is called contour interval (*it is a constant 20 mts in your toposheets.)  5. INDEX CONTOUR: Contour lines are thickened at regular intervals to make it easier to read contours. For example at every 100 mts the contour line is made darker. The darker lines are called Index Contours. 
INTERPRETATION OF CONTOURS When contours are further apart, the slope is gentle and when contours are close together the greater the drop.
A plateau
ESCARPMENT
 
TERMS= CONTOUR INTERVAL: The interval between two consecutive contours is called contour interval (*it is a constant 20 mts in your toposheet.)  INDEX CONTOUR: Contour lines are thickened at regular intervals to make it easier to read contours. For example at every 100 mts the contour line is made darker. The darker lines are called Index Contours. 
Types of Contours When contours are equal distance apart the slope is uniform: When spacing of contours down a slope gets close together at the bottom, the slope is convex. When spacing is further apart, the slope is concave.
AN ESCARPMENT
CONTOUR RELATED HEIGHTS APPROXIMATE OR RELATIVE HEIGHT-is height is not taken from sea level but with respect to the surrounding area. It may be the height of a dam, bridge, sand dune or it can be the depth of a well, tank, hill or river canal, for example , 3r, 5r, 8r, etc. EXAMPLE:3r - the relative depth of perennial lined well in 3 metres ● 5r – the relative height of dry tank is 5 metres  NOTE: CHECK THE SYMBOL – if it is tank, dam, bridge, embankment, etc then write the answer this way - the relative height of .............................. is ................meters.
SPOT HEIGHTS: Spot heights are used to provide more information about land surfaces between the contours. These are represented by a number preceded by a dot. for example ●340
TRIANGULATION POINTS : When the spot heights are accurately surveyed   , the dot is enclosed within a triangle and are called the triangulation points. e.g..∆ 877
BENCH MARKS The marks inscribed stones or shown on buildings to indicate the exact height determined through the surveys, are called the Bench Marks. These marks are shown by letters BM along with height . e.g.. BM 590
RELATIVE HEIGHT  Relative height is the height of a feature with reference to the height of the surrounding land and NOT to sea level. It is represented by the height with a small ‘r’  e.g. –12r. 
CONVENTIONAL SIGNS & SYMBOLS Every map contains a legend or a key. It lists the features and the signs or symbols used in the map for showing these features. 
 
SETTLEMENTS On a topographical map, all settlements are shown by symbols in RED  AREAS- Dense settlements  : Fertile plains and wide river valleys .   Sparse Settlements  : forests, deserts, mountain slopes, plateaus and hill tops with poor vegetation·   Absence of Settlements : Swamps, marsh land, sandy deserts, thick impenetrable forests, flood-prone areas, steep mountain slopes.
 
THE DRAINAGE The term drainage basin describes an area drained collectively by the network of a river along with its tributaries and sub-tributaries of various dimensions. . •A drainage system usually develops a pattern which is related to the general structure of its basin.
Drainage patterns
Trellised drainage pattern-streams meet the main river at an acute angle
Radial drainage-rivers move out from a hilly areas as rays of the sun
OCCUPATION    AGRICULTURE – Level land with yellow wash; many wells LUMBERING: Forests CATTLE REARING – Pastures, meadows, grasslands, presence of road in highland region (sheep) FISHING – Plenty of rivers MINING –Stony wastes, quarries, limestone beds TRADE – Dense settlements near road INDUSTRY – Large settlements near roads and railways, presence of raw materials, (like making, cement industry near limestone beds) TOURISM – hotels and inns
MEANS OF IRRIGATION • Irrigation largely depends on relief and land use pattern of area (blue) Perennial lined wells. – Other means of irrigation are- canals, ponds, artificial lakes with embankments and river in case it is perennial.
Land use - In the highlands,  vegetation is shown with green colours along with contours in brown showing elevation. To show density of wooded area, different terms used: •Dense forest, open-mixed forest, open jungle, fairly-mixed jungle, dense-mixed jungle, mixed jungle, Reserved Forest (RF), Protected Forest (PF), fairly mixed jungle with bamboo, dense mixed jungle with bamboo.
Landuse  THE PLAINS:- • Plains -mainly agriculture- cultivable land is shown in yellow colours •White patch in plain shows bad land or rocky, uncultivable land for • Open scrub – scrub land where mostly sheep and goat rearing is practiced • Stony waste – the land which is mostly covered with rock boulders and stones and cultivation is not possible.
Important terms SHEET ROCKS:- •Sheet rocks – a region mostly covered with a sheet of rock. • Rock outcrop – In such region subsoil is exposed and cultivation is not possible. • Broken ground – uncultivable area formed mainly near the  river which is formed due to alternate dry and wet spells
CAUSEWAY -it is when the river and the road intersect each other and when the river is in flood ,the road is unmotorable.


THE END

Map & a diagram (1)

  • 1.
    STUDY OF ATOPOGRAPHICAL MAP
  • 2.
    A MAP &A DIAGRAM DIAGRAM-is a sketch of something where the area shown on paper is not true to land area MAP- is the correct ground area represented on paper according to scale.
  • 3.
    Topographical maps Atopographical map is that which shows both natural and manmade features. If in a physical map, latitudes and longitudes are the basis for the study of a region, than in a topographical map, Eastings and Northings are important to locate a place in a topographical map .
  • 4.
    Use of atopographical map.. Topographic maps have multiple uses in the present day: any type of geographic planning or large-scale architecture, earth science and many other geographic disciplines; mining and recreational uses such as hiking or, in particular orienteering, which uses highly detailed maps in its standard requirements.
  • 5.
    SCALE Scale isthe ratio between the distance of any two points on the map and the actual distance of the same points on the ground. The scale of the given map extract is 2 cm: 1 km or 1:50,000.
  • 6.
  • 7.
    REPRESENTATIVE FRACTION SCALE-In the map, 1:50,000 is the R.F. of the map, which means that one unit on the map represents 50,000 units on the ground. For example, 1 cm on the map represents 50,000 cm on the ground. It is a universally accepted scale due to the use of local unit of measurement of distance in a place.
  • 8.
    STATEMENT SCALE Thescale may be indicated in the form of a written statement. For example 1cm on the map represents 1 km on the ground. The scale is written as 1 cm = 1 km.
  • 9.
    Linear Scale orGraphical Scale.   This scale is expressed as a horizontal or straight line. The base line is to express visual equivalents of representative fraction or verbal scale. 
  • 10.
    GRID.. It isa rectangular square system of lines superimposed on a map, within which any point can be located. Maps are normally printed so that north is on top. •North / South lines are called Eastings because the numbers increase as they go East. •East / West lines are called Northings because the numbers increase as they go North. The origin of a map is from the southwest corner.
  • 11.
    FOUR & SIXFIGURE GRID REFERENCE.
  • 12.
    What are Eastingsand Northings? 1.Eastings run – move left to right; and 2.Northings run – bottom to top. Eastings are always quoted first and then the Northings.
  • 13.
    DIRECTIONS They beendefined as an imaginary straight line on the map or the ground showing the angular position of various maps with respect to a common base direction. 
  • 14.
    CALCULATION OF AREA• Area= Length x Breadth •In topographical maps, each grid (square) 2cm X 2cm or 1 km to 1 km as per the scale 2 cm=1 km
  • 15.
    COLOURS 1. BLACK – All names, river banks, broken ground, dry streams, surveyed trees, heights and their numbering, railway lines, telephone and telegraph lines, lines of latitude and longitude.
  • 16.
    BLUE –   Waterfeatures or water bodies that contain water. GREEN – All wooded and   forested areas, orchards, scattered trees and scrubs. YELLOW – All cultivated areas are shown with a yellow wash. WHITE PATCHES – Uncultivable land
  • 17.
    Colours Prominent surveyedtrees are shown in black. Surveyed trees have numbers on their trunks. They serve as landmarks and are not allowed to be cut. RED – Grid lines (Eastings and Northings) and their numbering, roads, cart tracks, settlements, huts and buildings
  • 18.
    BROWN – Contourlines, their numbering, form lines, and sand features such as sand hills and dunes.
  • 19.
    RELIEF Principal topographicfeatures depicted on these maps are relief, drainage, swamps and lakes, forests, villages, towns, means of transport and communication like roads and railways, and canals.
  • 20.
    Representation of Reliefon the Map and its Interpretation Uneven – made up of hills, plains, plateaus, lowland which are varying in their elevation or heights from sea level. •It can be represented on the maps through different methods, such as spot heights, contouring, etc.
  • 21.
    CONTOURS • Acontour is a line on a map joining two points of equal height, and is the standard method of showing relief on a topographical map. Contours are shown at regular vertical intervals. On a 1:50,000 map the interval is 10 or 20metres.
  • 22.
    4. CONTOUR INTERVAL:The interval between two consecutive contours is called contour interval (*it is a constant 20 mts in your toposheets.)  5. INDEX CONTOUR: Contour lines are thickened at regular intervals to make it easier to read contours. For example at every 100 mts the contour line is made darker. The darker lines are called Index Contours. 
  • 23.
    INTERPRETATION OF CONTOURSWhen contours are further apart, the slope is gentle and when contours are close together the greater the drop.
  • 24.
  • 25.
  • 26.
  • 27.
    TERMS= CONTOUR INTERVAL:The interval between two consecutive contours is called contour interval (*it is a constant 20 mts in your toposheet.)  INDEX CONTOUR: Contour lines are thickened at regular intervals to make it easier to read contours. For example at every 100 mts the contour line is made darker. The darker lines are called Index Contours. 
  • 28.
    Types of ContoursWhen contours are equal distance apart the slope is uniform: When spacing of contours down a slope gets close together at the bottom, the slope is convex. When spacing is further apart, the slope is concave.
  • 29.
  • 30.
    CONTOUR RELATED HEIGHTSAPPROXIMATE OR RELATIVE HEIGHT-is height is not taken from sea level but with respect to the surrounding area. It may be the height of a dam, bridge, sand dune or it can be the depth of a well, tank, hill or river canal, for example , 3r, 5r, 8r, etc. EXAMPLE:3r - the relative depth of perennial lined well in 3 metres ● 5r – the relative height of dry tank is 5 metres  NOTE: CHECK THE SYMBOL – if it is tank, dam, bridge, embankment, etc then write the answer this way - the relative height of .............................. is ................meters.
  • 31.
    SPOT HEIGHTS: Spotheights are used to provide more information about land surfaces between the contours. These are represented by a number preceded by a dot. for example ●340
  • 32.
    TRIANGULATION POINTS :When the spot heights are accurately surveyed , the dot is enclosed within a triangle and are called the triangulation points. e.g..∆ 877
  • 33.
    BENCH MARKS Themarks inscribed stones or shown on buildings to indicate the exact height determined through the surveys, are called the Bench Marks. These marks are shown by letters BM along with height . e.g.. BM 590
  • 34.
    RELATIVE HEIGHT Relative height is the height of a feature with reference to the height of the surrounding land and NOT to sea level. It is represented by the height with a small ‘r’ e.g. –12r. 
  • 35.
    CONVENTIONAL SIGNS &SYMBOLS Every map contains a legend or a key. It lists the features and the signs or symbols used in the map for showing these features. 
  • 36.
  • 37.
    SETTLEMENTS On atopographical map, all settlements are shown by symbols in RED  AREAS- Dense settlements : Fertile plains and wide river valleys . Sparse Settlements : forests, deserts, mountain slopes, plateaus and hill tops with poor vegetation· Absence of Settlements : Swamps, marsh land, sandy deserts, thick impenetrable forests, flood-prone areas, steep mountain slopes.
  • 38.
  • 39.
    THE DRAINAGE Theterm drainage basin describes an area drained collectively by the network of a river along with its tributaries and sub-tributaries of various dimensions. . •A drainage system usually develops a pattern which is related to the general structure of its basin.
  • 40.
  • 41.
    Trellised drainage pattern-streamsmeet the main river at an acute angle
  • 42.
    Radial drainage-rivers moveout from a hilly areas as rays of the sun
  • 43.
    OCCUPATION  AGRICULTURE – Level land with yellow wash; many wells LUMBERING: Forests CATTLE REARING – Pastures, meadows, grasslands, presence of road in highland region (sheep) FISHING – Plenty of rivers MINING –Stony wastes, quarries, limestone beds TRADE – Dense settlements near road INDUSTRY – Large settlements near roads and railways, presence of raw materials, (like making, cement industry near limestone beds) TOURISM – hotels and inns
  • 44.
    MEANS OF IRRIGATION• Irrigation largely depends on relief and land use pattern of area (blue) Perennial lined wells. – Other means of irrigation are- canals, ponds, artificial lakes with embankments and river in case it is perennial.
  • 45.
    Land use -In the highlands,  vegetation is shown with green colours along with contours in brown showing elevation. To show density of wooded area, different terms used: •Dense forest, open-mixed forest, open jungle, fairly-mixed jungle, dense-mixed jungle, mixed jungle, Reserved Forest (RF), Protected Forest (PF), fairly mixed jungle with bamboo, dense mixed jungle with bamboo.
  • 46.
    Landuse THEPLAINS:- • Plains -mainly agriculture- cultivable land is shown in yellow colours •White patch in plain shows bad land or rocky, uncultivable land for • Open scrub – scrub land where mostly sheep and goat rearing is practiced • Stony waste – the land which is mostly covered with rock boulders and stones and cultivation is not possible.
  • 47.
    Important terms SHEETROCKS:- •Sheet rocks – a region mostly covered with a sheet of rock. • Rock outcrop – In such region subsoil is exposed and cultivation is not possible. • Broken ground – uncultivable area formed mainly near the river which is formed due to alternate dry and wet spells
  • 48.
    CAUSEWAY -it iswhen the river and the road intersect each other and when the river is in flood ,the road is unmotorable.
  • 49.
  • 50.
  • 51.
  • 52.
  • 53.
  • 54.