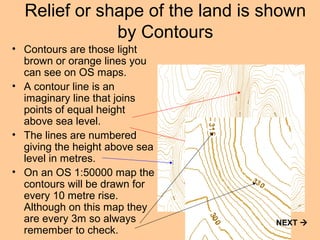
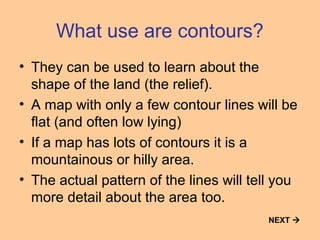
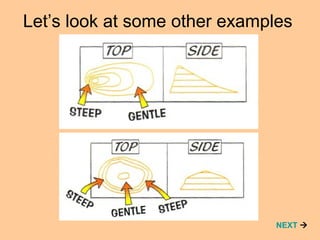
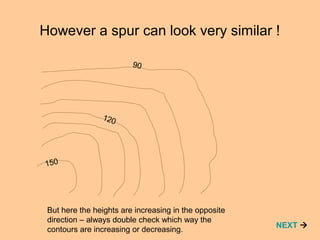
Contours

  These slides will slowly tell you about contours wait until
  you see the NEXT  button to move on.

                                                                      NEXT 

Click the NEXT only when you are ready to move onto the next slide
Relief or shape of the land is shown
              by Contours           XXXX
                                xxxxxx
• Contours are those light
  brown or orange lines you     XXXXX
  can see on OS maps.
• A contour line is an
  imaginary line that joins
  points of equal height
  above sea level.
• The lines are numbered
  giving the height above sea
  level in metres.
• On an OS 1:50000 map the
  contours will be drawn for
  every 10 metre rise.
  Although on this map they
  are every 3m so always                NEXT 
  remember to check.
What use are contours?
• They can be used to learn about the
  shape of the land (the relief).
• A map with only a few contour lines will be
  flat (and often low lying)
• If a map has lots of contours it is a
  mountainous or hilly area.
• The actual pattern of the lines will tell you
  more detail about the area too.
XXX                                       NEXT 
                          XXX
 XXX
• It is important to remember that the closer
   together the contour lines the steeper the
   slope.
XXXX

 Steep slopes


XXXX


  Area that is
  flatter with
  only a gentle
  slope
XXXX


•Let’s have a look at why that is.               NEXT 
• This is the side view of a hill.
    Let’s see where this hill reaches these heights

     Now let’s plot those points                                XXXX

     Now if we plotted those points on paper.

  300m
  250m
  200m
  150m
  100m
Sea level


      See how these lines are closer together on the steeper slope     NEXT 
Let’s look at some other examples


                               NEXT 
Think where is the steepest slope on this island?

 Click here to see if you’re right


xxx


                                                200


                                          150


                              100


                         50


                                                      XXXX
                                                       XXXX
Steepest slope –
                                                                 contour lines are closest
                                                                 together


xxx                                            Sparrow point
                                               227


                                                           200


                 .   76
                                                 150


                               100


                          50


 Sometimes spot heights can be shown as a dot with a note of
                                                                                 XXXX
 the height of that particular place.                                             XXXX
 A trigonometrical point (or trig point) shows the highest point in an
 area (in meters) and is shown as a blue triangle                                 NEXT 
You can spot other features by the
shape and pattern of the contours


                               NEXT 
A valley may look like this…
                        150


               120


90


Often with a river running down through the valley
                                                     NEXT 
However a spur can look very similar !

                         90


                120


150


 But here the heights are increasing in the opposite
 direction – always double check which way the
                                                       NEXT 
 contours are increasing or decreasing.
Valley             Spur

           150
                              90


     120
                        120


90               15
                    0


                                   NEXT 
Now Try your hand at a short test or
  click on the return button to re-run this
                presentation.


For test
click here                           RETURN

Contours

  • 1.
    Contours Theseslides will slowly tell you about contours wait until you see the NEXT  button to move on. NEXT  Click the NEXT only when you are ready to move onto the next slide
  • 2.
    Relief or shapeof the land is shown by Contours XXXX xxxxxx • Contours are those light brown or orange lines you XXXXX can see on OS maps. • A contour line is an imaginary line that joins points of equal height above sea level. • The lines are numbered giving the height above sea level in metres. • On an OS 1:50000 map the contours will be drawn for every 10 metre rise. Although on this map they are every 3m so always NEXT  remember to check.
  • 3.
    What use arecontours? • They can be used to learn about the shape of the land (the relief). • A map with only a few contour lines will be flat (and often low lying) • If a map has lots of contours it is a mountainous or hilly area. • The actual pattern of the lines will tell you more detail about the area too. XXX NEXT  XXX XXX
  • 4.
    • It isimportant to remember that the closer together the contour lines the steeper the slope. XXXX Steep slopes XXXX Area that is flatter with only a gentle slope XXXX •Let’s have a look at why that is. NEXT 
  • 5.
    • This isthe side view of a hill. Let’s see where this hill reaches these heights Now let’s plot those points XXXX Now if we plotted those points on paper. 300m 250m 200m 150m 100m Sea level See how these lines are closer together on the steeper slope NEXT 
  • 6.
    Let’s look atsome other examples NEXT 
  • 7.
    Think where isthe steepest slope on this island? Click here to see if you’re right xxx 200 150 100 50 XXXX XXXX
  • 8.
    Steepest slope – contour lines are closest together xxx Sparrow point 227 200 . 76 150 100 50 Sometimes spot heights can be shown as a dot with a note of XXXX the height of that particular place. XXXX A trigonometrical point (or trig point) shows the highest point in an area (in meters) and is shown as a blue triangle NEXT 
  • 9.
    You can spotother features by the shape and pattern of the contours NEXT 
  • 10.
    A valley maylook like this… 150 120 90 Often with a river running down through the valley NEXT 
  • 11.
    However a spurcan look very similar ! 90 120 150 But here the heights are increasing in the opposite direction – always double check which way the NEXT  contours are increasing or decreasing.
  • 12.
    Valley Spur 150 90 120 120 90 15 0 NEXT 
  • 13.
    Now Try yourhand at a short test or click on the return button to re-run this presentation. For test click here RETURN