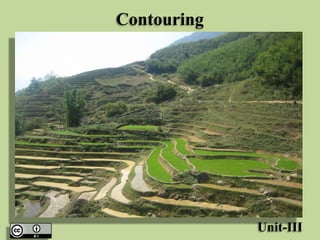
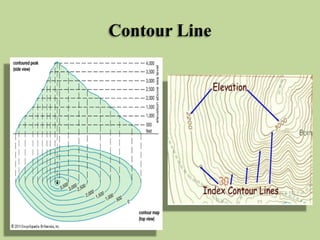
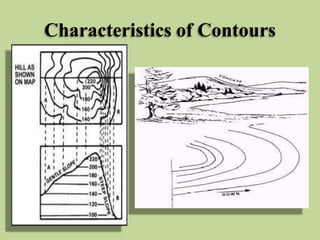
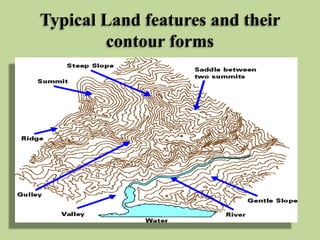
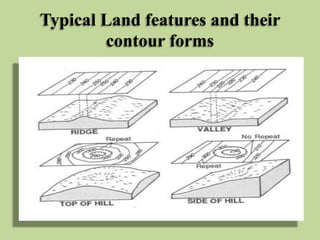
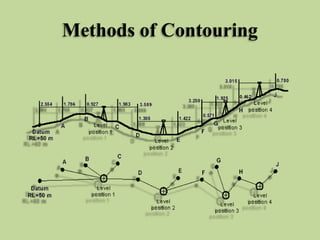
This document discusses contouring and contour maps. It defines a contour line as a line connecting points of equal elevation. The vertical distance between consecutive contours is called the contour interval, which depends on factors like the nature of the ground and the map scale. Contour maps show the topography of an area and can be used for engineering projects, route selection, and estimating earthworks. Methods of plotting contours include direct methods using levels or hand levels, and indirect methods like gridding, cross-sectioning, and radial lines. Characteristics of contours provide information about the landscape.
What is a Total Station?
Capability of a Total Station
Important Operations of Total Station
Uses of Total Station
Advantages of Using Total Stations
Applications
Definition of Surveying
Objects of Surveying
Uses of Surveying
Primary Divisions of Surveying
Principles of Surveying
List of Classification of Surveying
Definitions : Plan and Map, scales :Plain Scale and Diagonal Scale,
Metric Chain : It Consists of galvanized mild steel wire of 4mm diameter known as link.
It is available in 20m, 30m, 50m length which consists of 100 links.
Gunter’s Chain : A 66 feet long chain consists of 100 links, each of 0.66 feet, it is known as Gunter’s chain.
This chain is suitable for taking length in miles.
Engineer’s Chain : A 100 feet long chain consisting of 100 links each of 1 feet is known as engineer’s chain.
This chain is used to measure length in feet and area in sq.yard.
Revenue Chain : it is 33 feet long chain consisting of 16 links.
This chain is used for distance measurements in feet & inches for smaller areas.
Surveying is an important part of Civil engineering. Various part like theodolite, plane table surveying, computation of area and volume are useful for all university examination and other competitive examination
Contour maps: preparation and understanding.VIVEK CHAUHAN
The theme behind preparation of contour maps, various projections of topographical features, the processor making them and methods used in their making.
What Exactly Is Contouring in Survey & Levelling?
It will be helpful for Architectural and Civil engineering students.
A presentation by Harshit Gupta (B.Arch 1st year).
Suicide Prevention through Architecture (Building) and City PlanningGAURAV. H .TANDON
Suicide Prevention through Architecture (Building) and City Planning
Accessing The Potentials Of CPTED Principles In Addressing Safety Concerns Of Suicide Prevention In City Planning
Suicide Prevention through Architecture (Building) and City PlanningGAURAV. H .TANDON
Suicide Prevention through Architecture (Building) and City Planning
Accessing The Potentials Of CPTED Principles In Addressing Safety Concerns Of Suicide Prevention In City Planning
Digital Detoxing in Smart Cities.
Digital Detox for Sustainability: Unplugging/Redesigning technologies of Smart Cities for a Sustainable Future
“How a small Village in Maharashtra, India teaching importance of Digital detoxing to Mega Smart cities of India”
Digital Detoxing in Smart Cities
Digital Detox for Sustainability: Unplugging/Redesigning technologies of Smart Cities for a Sustainable Future
“How a small Village in Maharashtra, India teaching importance of Digital detoxing to Mega Smart cities of India”
Instructions for Submissions thorugh G- Classroom.pptxJheel Barad
This presentation provides a briefing on how to upload submissions and documents in Google Classroom. It was prepared as part of an orientation for new Sainik School in-service teacher trainees. As a training officer, my goal is to ensure that you are comfortable and proficient with this essential tool for managing assignments and fostering student engagement.
Read| The latest issue of The Challenger is here! We are thrilled to announce that our school paper has qualified for the NATIONAL SCHOOLS PRESS CONFERENCE (NSPC) 2024. Thank you for your unwavering support and trust. Dive into the stories that made us stand out!
Palestine last event orientationfvgnh .pptxRaedMohamed3
An EFL lesson about the current events in Palestine. It is intended to be for intermediate students who wish to increase their listening skills through a short lesson in power point.
The Art Pastor's Guide to Sabbath | Steve ThomasonSteve Thomason
What is the purpose of the Sabbath Law in the Torah. It is interesting to compare how the context of the law shifts from Exodus to Deuteronomy. Who gets to rest, and why?
Unit 8 - Information and Communication Technology (Paper I).pdfThiyagu K
This slides describes the basic concepts of ICT, basics of Email, Emerging Technology and Digital Initiatives in Education. This presentations aligns with the UGC Paper I syllabus.
2024.06.01 Introducing a competency framework for languag learning materials ...Sandy Millin
http://sandymillin.wordpress.com/iateflwebinar2024
Published classroom materials form the basis of syllabuses, drive teacher professional development, and have a potentially huge influence on learners, teachers and education systems. All teachers also create their own materials, whether a few sentences on a blackboard, a highly-structured fully-realised online course, or anything in between. Despite this, the knowledge and skills needed to create effective language learning materials are rarely part of teacher training, and are mostly learnt by trial and error.
Knowledge and skills frameworks, generally called competency frameworks, for ELT teachers, trainers and managers have existed for a few years now. However, until I created one for my MA dissertation, there wasn’t one drawing together what we need to know and do to be able to effectively produce language learning materials.
This webinar will introduce you to my framework, highlighting the key competencies I identified from my research. It will also show how anybody involved in language teaching (any language, not just English!), teacher training, managing schools or developing language learning materials can benefit from using the framework.
Welcome to TechSoup New Member Orientation and Q&A (May 2024).pdfTechSoup
In this webinar you will learn how your organization can access TechSoup's wide variety of product discount and donation programs. From hardware to software, we'll give you a tour of the tools available to help your nonprofit with productivity, collaboration, financial management, donor tracking, security, and more.
Operation “Blue Star” is the only event in the history of Independent India where the state went into war with its own people. Even after about 40 years it is not clear if it was culmination of states anger over people of the region, a political game of power or start of dictatorial chapter in the democratic setup.
The people of Punjab felt alienated from main stream due to denial of their just demands during a long democratic struggle since independence. As it happen all over the word, it led to militant struggle with great loss of lives of military, police and civilian personnel. Killing of Indira Gandhi and massacre of innocent Sikhs in Delhi and other India cities was also associated with this movement.
We all have good and bad thoughts from time to time and situation to situation. We are bombarded daily with spiraling thoughts(both negative and positive) creating all-consuming feel , making us difficult to manage with associated suffering. Good thoughts are like our Mob Signal (Positive thought) amidst noise(negative thought) in the atmosphere. Negative thoughts like noise outweigh positive thoughts. These thoughts often create unwanted confusion, trouble, stress and frustration in our mind as well as chaos in our physical world. Negative thoughts are also known as “distorted thinking”.
2. Contouring
Contouring
• Contour – définitions, objectives, contour
interval, horizontal equivalent, uses and
characteristics of contour lines, methods of
plotting contours, direct and indirect methods
of contouring, Contour gradient.
4. Contour Line
• A contour line may be defined as “An imaginary
line passing through points of equal reduced
levels”. A contour line may also be defined “as
the intersection of a level surface with the
surface of the earth”. Thus, contour lines on a
plan illustrates the topography of the area.
• For ex a contour of 90 m indicates that all the
points on this line have RL of 90 m. Similarly, in
a contour of 89 m all the points have RL of 89 m
and so on.
6. Contour Interval
• The vertical distance between two consecutive
contours is known as a contour interval.
• For ex, a map indicates contour lines of 90 m, 89
m, 88 m and so on, the contour interval is 1m.
• This interval depends upon the following
factors:
• The nature of the ground (i.e. . Whether flat or
steep)
• The scale of the map, and The purpose of the
survey.
8. Contour Interval
• Contour intervals for flat ground are generally small,
e.g.. 0.25 m, 0.5 m, 0.75 m
• The contour interval for a steep slope in a hilly area is
generally greater, e.g.. 5 m, 10 m, 15 m, etc.
• Again, for a small scale map, the interval may be of 1
m, 2 m, 3 m, etc.
• Contour interval is kept large up to 2 m for projects
such as highways and railways, whereas it is kept as
small as 0.5 m for measurement of earthwork, building
sites, dams, etc.
• It is desirable to have a constant contour interval for a
particular map.
9. Horizontal Equivalent
• The horizontal distance between any two
consecutive contours is known as horizontal
equivalent. It is not constant. It varies from
point to point depending upon the steepness of
the ground. Steeper the ground, lesser is the
horizontal equivalent.
10. Use of Contour Map
• Contour maps provide valuable information about the topography of
the area, whether it is flat, undulating or mountainoueous. The
nature of the ground surface of an area can be understood by
studying a contour map.
The following are the specific uses of the contour map.
• To select sites for engineering projects such as roads, canals,
railways.
• To find the possible route of communication between different
places.
• The capacity of a reservoir and the area of submergence can be
computed
• To ascertain the indivisibility of stations.
• To ascertain the profile of the ground surface along any direction.
• A suitable route for given gradient can be marked on the map.
11. Use of Contour Map
• To estimate the quantity of
cutting, filling, etc.
• To know the drainage characteristics of the
area. It helps to select sites for
culverts, bridges, drainage system.
13. Characteristics of Contours
• Since every point on a contour line has the
same elevation, a contour map with a constant
interval portrays the conformation of the
ground in a characteristics manner. The
knowledge of contour characteristics helps in
identifying the natural features of the area
from the given map and in avoiding mistakes
in plotting the contours correctly.
15. Characteristics of Contours
• The following characteristics help in plotting or
reading a constant map.
• All the points on a contour line have the same
elevation. The elevations of the contour are indicated
either by inserting the figure in a break in respective
contour or printed close to the contour.
• Two contour lines do not intersect with each other.
• Contour lines always from a closed circuit. But these
lines may be within or outside the limit of the map.
• Contour do not have sharp turning.
17. Characteristics of Contours
• The contour lines are closer near the top of a
hill or high ground and wide apart near the foot.
This indicates a very steep slope towards the
peak and a flatter slope towards the foot.
• The contour lines are closer near the bank of a
pond or depression and wide towards the
centre. This indicates a steep slope near the
bank and a flatter slope at the centre.
• Uniformly spaced contour lines indicate a
uniform slope.
22. Characteristics of Contours
• A series of closed contour always indicates a depression
or summit. The lower values being inside the loop
indicates a depression and the higher values being inside
the loop indicates a summit. (Hillock)
• Contour deflect uphill at valley lines and downhill at the
ridge lines. Contour lines in U-shape cross a ridge and V-
shape cross a valley at ridge angles. The concavity in
contour lines is towards higher ground in the case of ridge
and towards lower ground in the case of valley.
• Contour lines meeting at a point indicate a vertical cliff.
• Contour lines cannot cross one another, except in the
case of an overhanging cliff. But the overhanging portion
must be shown by a dotted line.
26. Methods of Contouring
• Contouring requires the planimetric position of
the points whose elevation have been
determined by leveling. The methods of
locating contours, therefore depending upon
the instruments used to determine the
horizontal as well as vertical position of
several points in the area.
27. Methods of Contouring
• Broadly, the method can be divided into the
following two classes.
• Direct methods
• Indirect methods
28. Methods of Contouring
Direct Method
• In the direct method of contouring, the reduced level of
various selected points on a contour line are obtained and
their positions are located. The contours are then drawn
by joining these points. It is a very accurate method but it
is slow and tedious.
• This method is employed only for small area where
superior accuracy is demanded. The method of locating
contours directly consists of horizontal and vertical
control. The horizontal control for a small area can be
exercised by a chain or tape and a large area by compass,
theodolite or plane table. For vertical control either a level
and staff or a hand level may be used.
30. Methods of Contouring
By Level and Staff
• The method consists of locating a series of points on
the ground having the same elevation by using a level
and leveling staff. Instrument is setup in such a way
that number of readings can be taken from the area to
be surveyed. The instrument is set up and RL of HI is
determined from the nearest benchmark. For a
particular contour value, the staff reading is worked
out. A series of points having the same staff reading is
worked out, and thus the same elevations are plotted
and joined by a smooth curve.
32. Methods of Contouring
By Hand Level
• The principle used is the same as that used in
the method using a level and staff. Instead of
the hand level, an abbey level may also be
used. However this method is very rapid and is
preferred for certain works.
34. Methods of Contouring
Indirect Methods
• Indirect methods are less expensive, less time
consuming and less tedious as compared with
the direct methods. These methods are
commonly employed in small scale survey of
large areas.
35. Methods of Contouring
• There are three different ways of employing
the indirect methods of contouring
• (i) Grid Method
• (ii) Cross-Sectional Method
• (iii) Radial line method or
Tachometric method
36. Methods of Contouring
Grid Method
• If the area is not large, it is divided into a grid or series of
squares. The grid size may vary from 5m x 5 m to 25 m x
25 m depending upon the nature of the ground, the contour
interval and the scale of the map. The grid corner are
marked on the ground and spot levels of these corners are
then determined by normal method of leveling using a level.
• The grid is plotted to the scale of the map and the spot
levels of the grid corners are entered, the contours of
desired values are then locked by interpolation. This method
is very suitable for a small open area where contour are
required at a closed vertical interval
39. Methods of Contouring
Cross-Sectioning Method
• In this method, suitable spaced cross –sections are
projected on either side of the centre line of the
area. Several points are chosen at reasonable
distances on either sides. The observations are
made in the usual manner with a level. The cross-
section lines are plotted to the scale, the points on
these lines are marked and reduced levels are
entered. The contours of desired values are then
located by interpolation. This method is suitable
for road, railway and canal survey.
40. Methods of Contouring
Radial Line Method or Tachometric Method
• In this method, a number of radial lines are set out at
known angular interval (i.e. 15 0 or 30 0) at each station.
The point are selected on a line depend on the nature of
the ground surface. Instead of the level, a tachometer
may be used. The observations are taken on the staff
stations and elevations and distances are then
calculated. A traverse and radial lines are plotted to the
scale RLs of the point entered. The contour of desired
values are then located by interpolation . This method is
convenient in hilly area.
41. Methods of Contouring
• Comparison of direct and Indirect methods of
contouring
Direct Method Indirect Method
Most accurate but slow and tedious Not so accurate but rapid and less tedious
Expensive Cheaper
Not suitable for hilly area Suitable for hilly area
During the work calculations can be done Calculations are not required in the field
Calculation can not be checked after
contouring
Calculation can be checked as and when
required
43. Interpolation of Contours
• The process of locating the contours
proportionately between the plotted point is
termed interpolation may be done by:
• Estimation
• Arithmetical Calculation
• Graphical Method
44. Interpolation of Contours
Estimation
• The points on the required contour are located
by eye judgment or estimation between points
whose elevations are already known. This
method is good for small scale maps. It is
assumed that slope between the ground points
is uniform.
45. Interpolation of Contours
Arithmetic Calculations
• This methods is used when high accuracy is
required and scale of the map is of
intermediate or large. In this method the
distances between two points of known
elevation are accurately measured. Then with
the help of arithmetic calculations, the
positions of the required elevation points are
computed.
46. Interpolation of Contours
Graphical Method
• When high accuracy is required and many
interpolation are to be made, this method of
plotting contours proves to be most rapid and
convenient. For this purpose tracing paper is
used.
47. Plotting of a Contour Map
• Before plotting the contour map, suitable scale is
selected.
• e.g. 1 cm = 1 m, 1 cm = 2 m, 1 cm = 2.5 m, 1 cm
= 4 m or 1 cm = 5 m etc. Here 1 cm = 2m is
selected.
• A horizontal line is drawn as the centre line
• The chainages are marked along the horizontal
line according to the scale.
• Ground levels are written from the level book
according to the chainage.
48. Plotting of a Contour Map
• The cross-section (L/s and R/S) are also plotted
(perpendicular lines) at each of the chainage.
• By interpolation contours are joined by smooth
curves keeping in mind the characteristics of
contour.
• First find out maximum and minimum RL values
and then first plot full values contour lines i.e.. 47
, 48, 49 etc. Contour interval is 1 m. After plotting
these contour lines reduces contour interval and it
is taken 0.5 m and contour lines i.e. 47.5, 48.5,
49.5 etc are plotted.
• Contour lines are then inked.