Downloaded 2,745 times

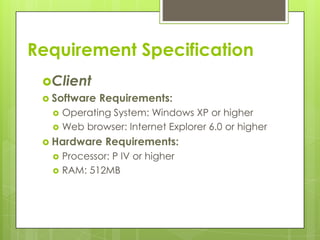
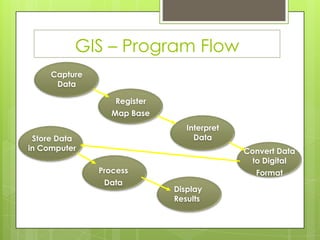
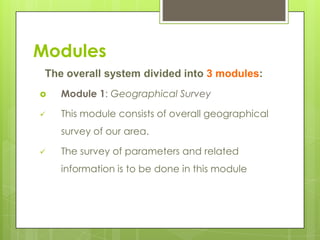
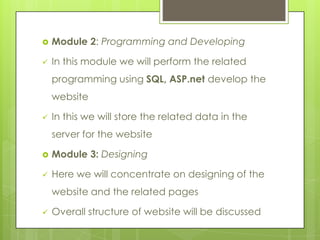
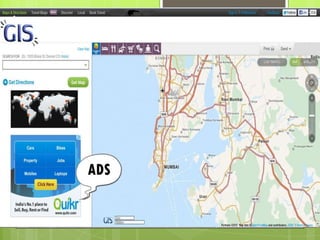

The document outlines a project on Geographic Information Systems (GIS), detailing its functions, existing limitations of current systems like Google Maps, and proposing a new website for improved user navigation and information retrieval. It highlights the advantages of GIS in finding various locations and provides requirement specifications for both server and client-side systems. Three main development modules are identified: geographical survey, programming and development, and design of the website.