
Recommended
More Related Content
Similar to Introduction to Geographic Information Systems
Similar to Introduction to Geographic Information Systems (20)
More from Ange Felix NSANZIYERA
More from Ange Felix NSANZIYERA (7)
Recently uploaded
Recently uploaded (20)
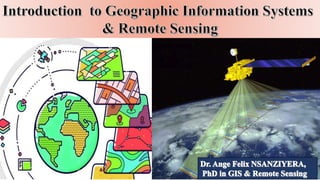
Introduction to Geographic Information Systems
- 3. I. Introduction: Fundamentals of GIS 1. Definition: GIS GIS (Geographic Information System): is computer assisted system used for collecting, storing, retrieving at will, transforming and displaying spatial data from the real world for a particular set of purpose. It is an organized collection of computer hardware, software, geographical data, personal designed to efficiently capture, store, update, manipulate, analyze and display all form of geographically referenced information
- 4. I. Introduction: Fundamentals of GIS GEOGRAPHIC: implies that locations of the data items are known, or can be calculated, in terms of Geographic coordinates (Latitude, Longitude) SYSTEM: implies that a GIS is made up from several inter-related and linked components with different functions. Thus, GIS have functional capabilities for data capture, input, manipulation, transformation, visualization, combinations, query, analysis, modelling and output. INFORMATION : implies that the data in a GIS are organized to yield useful knowledge, often as colored maps and images, but also as statistical graphics, tables, and various on-screen responses to interactive queries. 1. Definition: GIS
- 5. I. Introduction: Fundamentals of GIS GIS = Geographic Information System Links databases and maps Manages information about places Helps answer questions such as: Where is it? What else is nearby? Where is the highest concentration of ‘X’? Where can I find things with characteristic ‘Y’? Where is the closest ‘Z’ to my location? 1. Definition: GIS The objective: to improve overall decision making
- 6. I. Introduction: Fundamentals of GIS It is software designed to assist in the process of designing and drawing maps or the generation, storage and editing of maps using a computer. Cheap Quick Making maps specific to the user Making map possible in the absence of skilled persons Allows experimentation with different graphical representation of the same area Map making and updating easier if the data are in digital form. Facilitate analyses of data that demand interaction between statistical analyses and mapping Storage of data in digital form Creates 3D maps Advantages 1. Definition: Computer assisted mapping
- 7. I. Introduction: Fundamentals of GIS Contributing Disciplines & Technologies GIS is a multi-disciplinary concept built on convergence of technological and traditional disciplines. GIS has been called an ‘enabling technology’ because of the potential it offers for wide variety of disciplines which must deal with integration, modeling and analysis of spatial data. • Geography, • Cartography, • Remote sensing, • Photogrammetry, • Surveying, • Geodesy, Contributing disciplines • Statistics, • Operations research, • Computer science, • Mathematics, • Civil engineering.
- 8. I. Introduction: Fundamentals of GIS 2. Historical background: The first application of the concept was in 1832 when Charles Picquet created a map representing cholera outbreak across 48 districts of Paris. This map was an early version of a heat map, which would later revolutionize several industries. The Beginnings of Spatial Analysis Inspired by Picquet, John Snow adopted the same principle to depict cholera deaths in London in 1854. He evolved the concept by presenting an argument developed from a spatial analysis of data.
- 9. I. Introduction: Fundamentals of GIS 2. Historical background: When was the term GIS first used? In the early 20th century, a printing technique called photozincography was introduced, which allowed users to separate layers from a map. This technology meant different themes could be printed, but it did not represent a full GIS since there was no opportunity to analyze mapped data. The concept of GIS was first introduced in the early 1960s, and it was subsequently researched and developed as a new discipline. The GIS history views Roger Tomlinson as a pioneer of the concept, where the first iteration was designed to store, collate (arrange), and analyze data about land usage in Canada. The second phase of development in GIS history occurred throughout the 1970s, and by the 1980s the concept progressed as national agencies adopted it, and invested parties began determining best practice. By the late 1980s, there was a focus on improving the usability of technology and making facilitates more user-centric.
- 10. I. Introduction: Fundamentals of GIS 2. Historical background: When was the term GIS first used? There is little widespread information available on how the technology has been adopted and deployed. As the system continuously advanced in Canada throughout the 1970s and 1980s, by the 1990s it was driven by mainframe hardware, with data sets from the entire Canadian landmass. Those pursuing development in the field of GIS had different goals, meaning there was no set direction for research to follow. A single path finally surfaced when GIS became the focus of commercial activity with satellite imaging technology. Mass applications were thus initiated for business and private use.
- 11. I. Introduction: Fundamentals of GIS 2. Historical background: Desktop GIS & Widespread Adoption Throughout the 1990s, software company Esri released ArcView, a desktop solution for mapping systems. The influx of the Internet saw widespread adoption of GIS heading into the millennium, and the technology reached governmental authorities. Many companies, such as Nobel Systems, adopted the technology to provide services to cities, municipalities and private organizations to manage assets in the field, gather business intelligence, and easily send data to the company headquarters to analyze.
- 12. I. Introduction: Fundamentals of GIS 3. Components of GIS In general, GIS constitutes four major components including: computer hardware, set of application software , data and people. The hardware for a GIS includes: • Computer, • Input devices like digitizer (for vectorisation of given map) and scanner (to convert maps into *.tiff, *.bmp, and *.jpg for onscreen digitization) and • Output devices such as plotter, DeskJet printer, colour laser printer etc. a) Hardware
- 13. Chap. I. Introduction: Fundamentals of GIS 3. Components of GIS b) Software The GIS software package has a set of modules for performing digitization, editing, overlaying and conversion, analysis and for answering the queries, and generating output. Software may be chosen on the objective and also the cost of the software. GIS software is available as freeware (GRASS), low cost MapInfo for small scale GIS works and expensive ArcInfo for extension GIS analysis. Common GIS software packages, ArcGIS: most popular and widely used GIS software Very expensive Friendly graphical user interface (GUI) MapInfo: Vector based , desktop GIS ,emerging web mapping capabilities IDRISI: good Raster capabilities ,weak vector capabilities and the interface not quite as user friendly as ArcGIS GRASS: Primarily Raster based , open source , free. QGIS
- 14. 4. GIS Process & Capabilities Data Capture Convert Data to Digital Format Store Data in Computer Register Map Base Process Data Interpret Data Display Results GIS Process Chap. I. Introduction: Fundamentals of GIS
- 15. 5. GIS Process & Capabilities A well designed GIS should be able to provide(capability) Quick and easy access to large volume of data The ability to select detail by area or theme The ability to link or merge one data set with another The ability to analyze spatial characteristics of data The ability to search for particular characteristics or feature in an area The ability to update data quickly and cheaply The ability to model data and access alternatives Output capabilities(maps, graphs, address lists and summary statistics) tailored to meet particular needs Chap. I. Introduction: Fundamentals of GIS
- 16. 1. Maps and Spatial data A Map is the graphic representation of earth’s surface or any planet (space body)’s surface, as a whole, or part of it on a plane surface drawn to a scale and projection with suitable sign and symbols, so that each and every point represented on it corresponds to its terrestrial or celestial position. Spatial data, also known as geospatial data, is a term used to describe any data related to or containing information about a specific location on the Earth’s surface. It is an information about a physical object that can be represented by numerical values in a geographic coordinate system. Chap. II. Spatial Data Structure
- 17. Generally speaking, spatial data represents the location, size and shape of an object on planet Earth such as a building, lake, mountain or township. Spatial data may also include attributes that provide more information about the entity that is being represented. Geographic Information Systems (GIS) or other specialized software applications can be used to access, visualize, manipulate and analyze geospatial data. Spatial data can exist in a variety of formats and contains more than just location specific information. To properly understand and learn more about spatial data, there are a few key terms that will help you become more fluent in the language of spatial data. 1. Maps and Spatial data Chap. II. Spatial Data Structure
- 18. Chap. II. Spatial Data Structure
- 19. 1. Spatial data Models i) Vector Vector data is best described as graphical representations of the real world. There are three main types of vector data: • Points, • Lines, • Polygons. Vectors are best used to present generalizations of objects or features on the Earth’s surface. Vector data and the file format known as shapefiles (.shp) are sometimes used interchangeably since vector data is most often stored in .shp files. Connecting points create lines, and connecting lines that create an enclosed area create polygons. Chap. II. Spatial Data Structure
- 20. 1. Data & Metadata Data is an important component of any GIS. GIS is capable accepting any form of data i.e. digital data supplied by satellites, vectorisation of existing maps, data from Global Positioning System (GPS), as well as statistical data published by government departments. The quality of the information furnished by a GIS is directly related to quality of the data used. Geospatial data tells you where it is and attribute data tells you what it is. Metadata describes both and attributes data. Chap. II. Spatial Data Structure
- 21. 2. Spatial data Models ii) Raster Raster data is data that is presented in a grid of pixels. Each pixel within a raster has a value (DN: Digital Number), whether it be a colour or unit of measurement, to communicate information about the element in question. Rasters typically refer to imagery. However, in the spatial world, this may specifically refer to orthoimagery which are photos taken from satellites or other aerial devices. Raster data quality varies depending on resolution and your task at hand. Chap. II. Spatial Data Structure
- 22. 3. Non Spatial data: Attribute Spatial data contains more information than just a location on the surface of the Earth. Any additional information, or non-spatial data, that describes a feature is referred to as an attribute. Spatial data can have any amount of additional attributes accompanying information about the location. For example, you might have a map displaying buildings within a city’s downtown region. Each of the buildings, in addition to their location, may have additional attributes such as the type of use (housing, business, government, etc.), the year it was built, and how many stories it has. Chap. II. GIS Data Structure
- 23. Chap. III. Coordinate Systems Locations on the Earth's surface are measured and represented in terms of coordinates. A coordinate is a set of two or more numbers that specifies the position of a point, line, or other geometric figure in relation to some reference system. Coordinate systems enable geographic datasets to use common locations for integration. A coordinate system is a reference system used to represent the locations of geographic features, imagery, and observations, such as Global Positioning System (GPS) locations, within a common geographic framework. Each coordinate system is defined by the following: Its measurement framework, which is either geographic or geocentric (in which spherical coordinates are measured from the earth's center) or planimetric or projected (in which the earth's coordinates are projected onto a two-dimensional planar surface) 1. Introduction
- 24. Units of measurement (typically feet or meters for projected coordinate systems or decimal degrees for latitude-longitude) The definition of the map projection for projected coordinate systems Other measurement system properties such as a ellipsoid of reference, a datum, one or more standard parallels, a central meridian, and possible shifts in the x- and y-directions Several hundred geographic coordinate systems and a few thousand projected coordinate systems are available for use. In addition, you can define a custom coordinate system. 1. Introduction Chap. III. Coordinate Systems
- 25. 2. Types of Coordinate system The following are two common types of coordinate systems used in a Geographic Information System (GIS): A global or spherical coordinate system such as latitude-longitude. These are often referred to as geographic coordinate systems. A projected coordinate system such as universal transverse Mercator (UTM), ITRF 2005 (International Terrestrial Reference Frame), all of which (along with numerous other map projection models) provide various mechanisms to project maps of the earth's spherical surface onto a two-dimensional Cartesian coordinate plane. Projected coordinate systems are referred to as map projections. Coordinate systems (both geographic and projected) provide a framework for defining real-world locations. What is a spatial reference? A spatial reference is a series of parameters that define the coordinate system and other spatial properties for each dataset in the geodatabase. It is typical that all datasets for the same area (and in the same geodatabase) use a common spatial reference definition. Chap. III. Coordinate Systems
- 26. A spatial reference includes the following: The coordinate system The coordinate precision with which coordinates are stored (often referred to as the coordinate resolution) Processing tolerances (such as the cluster tolerance) The spatial extent covered by the dataset (often referred to as the spatial domain) i) Geographic coordinate systems (GCS) 2. Types of Coordinate system A geographic coordinate system (GCS) uses a three-dimensional spherical surface to define locations on the earth. A GCS includes an angular unit of measure, a prime meridian, and a datum (based on a spheroid). The spheroid defines the size and shape of the earth model, while the datum connects the spheroid to the earth's surface. A point is referenced by its longitude and latitude values. Longitude and latitude are angles measured from the earth's center to a point on the earth's surface. The angles often are measured in degrees (or in grads). The following illustration shows the world as a globe with longitude and latitude values: Chap. III. Coordinate Systems
- 27. In the spherical system, horizontal lines, or east–west lines, are lines of equal latitude, or parallels. Vertical lines, or north–south lines, are lines of equal longitude, or meridians. These lines encompass the globe and form a gridded network called a graticule. The line of latitude midway between the poles is called the equator. It defines the line of zero latitude. The line of zero longitude is called the prime meridian. For most GCSs, the prime meridian is the longitude that passes through Greenwich, England. The origin of the graticule (0,0) is defined by where the equator and prime meridian intersect. Latitude and longitude The "latitude" (Lat., φ, or phi) of a point on Earth's surface is the angle between the equatorial plane and the straight line that passes through that point and through (or close to) the center of the Earth. Lines joining points of the same latitude trace circles on the surface of Earth called parallels, as they are parallel to the Equator and to each other. The North Pole is 90° N; the South Pole is 90° S. The 0° parallel of latitude is designated the Equator, the fundamental plane of all geographic coordinate systems. The Equator divides the globe into Northern and Southern Hemispheres. Chap. III. Coordinate Systems
- 28. The "longitude" (abbreviation: Long., λ, or lambda) of a point on Earth's surface is the angle east or west of a reference meridian to another meridian that passes through that point. All meridians are halves of great ellipses (often called great circles), which converge at the North and South Poles. The meridian of the British Royal Observatory in Greenwich, in south-east London, England, is the international prime meridian, although some organizations—such as the French Institut Géographique National—continue to use other meridians for internal purposes. The prime meridian determines the proper Eastern and Western Hemispheres, although maps often divide these hemispheres further west in order to keep the Old World on a single side. The antipodal meridian of Greenwich is both 180°W and 180°E. This is not to be conflated with the International Date Line, which diverges from it in several places for political and convenience reasons, including between far eastern Russia and the far western Aleutian Islands. The combination of these two components specifies the position of any location on the surface of Earth, without consideration of altitude or depth. The grid formed by lines of latitude and longitude is known as a "graticule".[The origin/zero point of this system is located in the Gulf of Guinea about 625 km (390 mi) south of Tema, Ghana. Chap. III. Coordinate Systems
- 29. Length of a degree On the GRS80 or WGS84 spheroid at sea level at the Equator, one latitudinal second measures 30.715 meters, one latitudinal minute is 1843 meters and one latitudinal degree is 110.6 kilometers. The circles of longitude, meridians, meet at the geographical poles, with the west-east width of a second naturally decreasing as latitude increases. On the Equator at sea level, one longitudinal second measures 30.92 meters, a longitudinal minute is 1855 meters and a longitudinal degree is 111.3 kilometers. At 30° a longitudinal second is 26.76 meters, at Greenwich (51°28′38″N) 19.22 meters, and at 60° it is 15.42 meters. Geographic (datum) transformations If two datasets are not referenced to the same geographic coordinate system, you may need to perform a geographic (datum) transformation. This is a well-defined mathematical method to convert coordinates between two geographic coordinate systems. As with the coordinate systems, there are several hundred predefined geographic transformations that you can access. It is very important to correctly use a geographic transformation if it is required. When neglected, coordinates can be in the wrong location by up to a few hundred meters. Sometimes no transformation exists, or you have to use a third GCS like the World Geodetic System 1984 (WGS84) and combine two transformations. Chap. III. Coordinate Systems
- 30. ii) Projected coordinate systems (PCS) A projected coordinate system (PCS) is defined on a flat, two-dimensional surface. Unlike a GCS, a PCS has constant lengths, angles, and areas across the two dimensions. A PCS is always based on a GCS that is based on an ellipsoid. In addition to the GCS, a PCS includes a map projection, a set of projection parameters that customize the map projection for a particular location, and a linear unit of measure. UTM (Universal Transversal Mercator) and ITRF 2005 are examples of PCS. In Rwanda, we use UTM-35S, UTM-36S and ITRF 2005 (TM-Rwanda) Chap. III. Coordinate Systems
- 31. 3. Map projections & Transformation Whether you treat the earth as a sphere or a ellipoid, you must transform its three-dimensional surface to create a flat map sheet. This mathematical transformation is commonly referred to as a map projection. One easy way to understand how map projections alter spatial properties is to visualize shining a light through the earth onto a surface, called the projection surface. Imagine the earth's surface is clear with the graticule drawn on it. Wrap a piece of paper around the earth. A light at the center of the earth will cast the shadows of the graticule onto the piece of paper. You can now unwrap the paper and lay it flat. The shape of the graticule on the flat paper is different from that on the earth. The map projection has distorted the graticule. An ellipsoid cannot be flattened to a plane any more easily than a piece of orange peel can be flattened—it will tear. Representing the earth's surface in two dimensions causes distortion in the shape, area, distance, or direction of the data. A map projection uses mathematical formulas to relate spherical coordinates on the globe to flat, planar coordinates. Different projections cause different types of distortions. Some projections are designed to minimize the distortion of one or two of the data's characteristics. A projection could maintain the area of a feature but alter its shape. Chap. III. Coordinate Systems
- 32. a) Metric properties of map Many properties can be measured on the Earth's surface independent of its geography: Area Shape Direction Bearing Distance Map projections can be constructed to preserve some of these properties at the expense of others. Because the curved Earth's surface is not isometric to a plane, preservation of shapes inevitably leads to a variable scale and, consequently, non-proportional presentation of areas. Vice versa, an area-preserving projection can not be conformal (keeping angles unchanged), resulting in shapes and bearings distorted in most places of the map. Each projection preserves, compromises, or approximates basic metric properties in different ways. The purpose of the map determines which projection should form the base for the map. Because many purposes exist for maps, a diversity of projections have been created to suit those purposes. Chap. III. Coordinate Systems
- 33. Another consideration in the configuration of a projection is its compatibility with data sets to be used on the map. Data sets are geographic information; their collection depends on the chosen datum (model) of the Earth. Different datums assign slightly different coordinates to the same location, so in large scale maps, such as those from national mapping systems, it is important to match the datum to the projection. The slight differences in coordinate assignation between different datums is not a concern for world maps or other vast territories, where such differences get shrunk to imperceptibility. Chap. III. Coordinate Systems
- 34. b) Design and construction The creation of a map projection involves two steps: Selection of a model for the shape of the Earth or planetary body (usually choosing between a sphere or ellipsoid). Because the Earth's actual shape is irregular, information is lost in this step. Transformation of geographic coordinates (longitude and latitude) to Cartesian (x,y) or polar plane coordinates. In large-scale maps, Cartesian coordinates normally have a simple relation to eastings and northings defined as a grid superimposed on the projection. In small-scale maps, eastings and northings are not meaningful, and grids are not superimposed. C) Choosing a projection surface A surface that can be unfolded or unrolled into a plane or sheet without stretching, tearing or shrinking is called a developable surface. The cylinder, cone and the plane are all developable surfaces. The sphere and ellipsoid do not have developable surfaces, so any projection of them onto a plane will have to distort the image. (To compare, one cannot flatten an orange peel without tearing and warping it.) One way of describing a projection is first to project from the Earth's surface to a developable surface such as a cylinder or cone, and then to unroll the surface into a plane. Chap. III. Coordinate Systems
- 35. While the first step inevitably distorts some properties of the globe, the developable surface can then be unfolded without further distortion. i) Cylinder projection Chap. III. Coordinate Systems
- 36. UTM: Universal Transversal Mercator Chap. III. Coordinate Systems
- 37. ii) Conical Projection Chap. III. Coordinate Systems
- 38. iii) Polar Projection Chap. III. Coordinate Systems