Downloaded 264 times

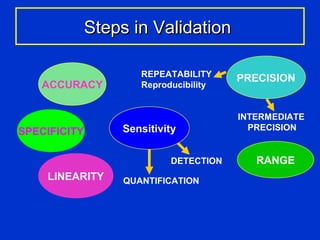
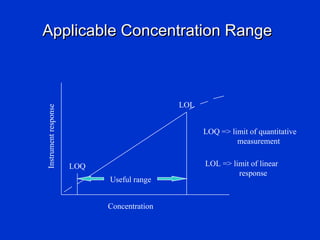

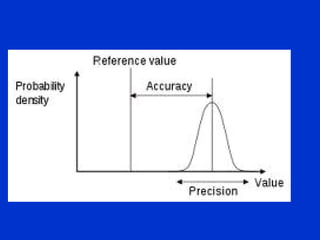


Validation is the process of confirming an analytical method is suitable for its intended purpose. The key steps in validation include assessing accuracy, precision (repeatability and reproducibility), specificity, linearity, range, detection limit, and robustness. Accuracy demonstrates closeness between true and measured values. Precision expresses the degree of variation in measurements. Specificity ensures only the intended analyte is measured. Linearity evaluates the relationship between concentration and response. Range confirms acceptable accuracy and precision within the method's measurable concentrations. [END SUMMARY]