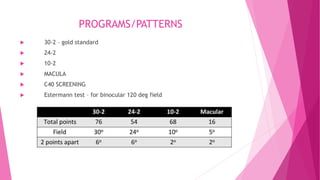
BASIC APPROACH ON
HVF
Ahmad Zulfahmi Shaari
Ophthal Dept
HUMPHREY VISUAL FIELD
 STANDARD AUTOMATED PERIMETRY
 STATIC PERIMETRY
 MEASUREMENT OF THRESHOLD VALUES
 STATPAC (HFA)- comparison to normative data
 Inbuilt program for analysis- diagnosis and progression
 WHITE ON WHITE
 BACKGROUND ILLUMINATION – 31.5 asb
 Stimulus size- Goldmann III
 DURATION OF SPOT EXPOSURE 0.2s
PROGRAMS/PATTERNS
 30-2 – gold standard
 24-2
 10-2
 MACULA
 C40 SCREENING
 Estermann test – for binocular 120 deg field
BEFORE RUNNING THE TEST:
 Selection of adequate test
 VA
 Proper environment
 Comfortable sitting position
 Adequate size of pupil >3mm
 Adequate Near correction
 Proper explanation – running of demonstration
 Reassurance – not all points will be seen
 - test can be paused by keeping the response button pressed
WANDER
 What was done?
 Accuracy (Reliability)
 Normal or abnormal
 Defect pattern
 Evaluate compatible disease
 Review
ZONE 1 : REPRODUCIBILITY
ZONE 2: RELIABILITY
• Fixation monitor
• Fixation target – central, small diamond, large
diamond, bottom LED
• Test duration
• Reliability indices
Fixation losses ( Heijl Krakau) <20 %
Gaze tracking
False positives < 33%
(trigger happy)
False negatives < 33 %
ZONE 3 : GREY SCALE
 Based on actual threshold values at each location
 General identification
 Patient information
ZONE 4: TOTAL DEVIATION PLOT
• Numerical plot – indicates by how much decibels
is each point depressed compared to mean
value in normal population of similar age
• Probability plot- grey scale indicates the
probability of occurrence of the deviation in
normal population
Generalized depression due to media opacities,
refractive error, miosis may hamper appearance
of a pattern
ZONE 5 : PATTERN DEVIATION PLOT
• Numerical - calculated by adjustment for
generalized depression or elevation of visual field
• Thus brings out pattern
• Probability plot
• Significance - ANDERSON’S CRITERIA
ZONE 6 : GLOBAL INDICES
 MEAN DEVIATION : average loss of sensitivity from normal age matched
population along with probability
calculated from total deviation plot
 PATTERN STANDARD DEVIATION : range over which change of sensitivity at all
the points has occurred, along with probability
compensates for effect of generalized depression or elevation of field on
mean deviation value
local defects affect PSD > MD
 SHORT TERM FLUCTUATIONS
 CORRECTED PATTERN STANDARD DEVIATION
GLOBAL INDICES
 -2 (<-6dB) MILD GENERALISED DEPRESSION
 -7 (<-12dB) MODERATE GENERALISED DEPRESSION
 -13 (>-12dB) SEVERE GENERALISED DEPRESSION
ZONE 7 : GLAUCOMA HEMIFIELD TEST
• Comparison of 5 clusters of points in superior hemifield with
mirror images in inferior hemifield
ANDERSON CRITERIA
• 3 or more congrous ‘non edge points’ in typical arcuate
area on 30-2 program
depressed @ p< 5 % with at least one point @ p<1 %
•PSD / CPSD @ p< 5%
•GHT – outside normal limits
 Must be demonstrated on 2 field tests
QUALITY OF VF
 Good eye-hand coordination
-not suitable for pt with nystagmus, parkinson,
 Corrected rx
 Poor result lead to misdiagnosis
 Bad day
VF ARTIFACTS
 OBSTRUCTION
RIM ARTEFACTS
PTOSIS
MEDIA OPACITIES
 MIOSIS
 REFRACTION ARTEFACTS
 High power plus and minus lenses
VISUAL FIELD DEFECT
MONITORING VF PROGRESSION
 New case/glaucoma suspect : 2 VF IN FIRST 6 MONTH.
2 MORE VF IN NEXT 18 MONTH
4 VF in 2 years
 MD ≥-2DB/ year : 6 VF in the first 2 year
 After first 2 years  stable / slow risk : once a year
 Low mod risk – once yearly
 High risk – 6 month
Excellence is not being the best.
It is doing the best.
Thank you.

Basic approach on hvf

  • 1.
    BASIC APPROACH ON HVF AhmadZulfahmi Shaari Ophthal Dept
  • 2.
    HUMPHREY VISUAL FIELD STANDARD AUTOMATED PERIMETRY  STATIC PERIMETRY  MEASUREMENT OF THRESHOLD VALUES  STATPAC (HFA)- comparison to normative data  Inbuilt program for analysis- diagnosis and progression
  • 3.
     WHITE ONWHITE  BACKGROUND ILLUMINATION – 31.5 asb  Stimulus size- Goldmann III  DURATION OF SPOT EXPOSURE 0.2s
  • 4.
    PROGRAMS/PATTERNS  30-2 –gold standard  24-2  10-2  MACULA  C40 SCREENING  Estermann test – for binocular 120 deg field
  • 6.
    BEFORE RUNNING THETEST:  Selection of adequate test  VA  Proper environment  Comfortable sitting position  Adequate size of pupil >3mm  Adequate Near correction  Proper explanation – running of demonstration  Reassurance – not all points will be seen  - test can be paused by keeping the response button pressed
  • 7.
    WANDER  What wasdone?  Accuracy (Reliability)  Normal or abnormal  Defect pattern  Evaluate compatible disease  Review
  • 14.
    ZONE 1 :REPRODUCIBILITY
  • 15.
    ZONE 2: RELIABILITY •Fixation monitor • Fixation target – central, small diamond, large diamond, bottom LED • Test duration • Reliability indices Fixation losses ( Heijl Krakau) <20 % Gaze tracking False positives < 33% (trigger happy) False negatives < 33 %
  • 19.
    ZONE 3 :GREY SCALE  Based on actual threshold values at each location  General identification  Patient information
  • 20.
    ZONE 4: TOTALDEVIATION PLOT • Numerical plot – indicates by how much decibels is each point depressed compared to mean value in normal population of similar age • Probability plot- grey scale indicates the probability of occurrence of the deviation in normal population Generalized depression due to media opacities, refractive error, miosis may hamper appearance of a pattern
  • 21.
    ZONE 5 :PATTERN DEVIATION PLOT • Numerical - calculated by adjustment for generalized depression or elevation of visual field • Thus brings out pattern • Probability plot • Significance - ANDERSON’S CRITERIA
  • 24.
    ZONE 6 :GLOBAL INDICES  MEAN DEVIATION : average loss of sensitivity from normal age matched population along with probability calculated from total deviation plot  PATTERN STANDARD DEVIATION : range over which change of sensitivity at all the points has occurred, along with probability compensates for effect of generalized depression or elevation of field on mean deviation value local defects affect PSD > MD  SHORT TERM FLUCTUATIONS  CORRECTED PATTERN STANDARD DEVIATION
  • 25.
    GLOBAL INDICES  -2(<-6dB) MILD GENERALISED DEPRESSION  -7 (<-12dB) MODERATE GENERALISED DEPRESSION  -13 (>-12dB) SEVERE GENERALISED DEPRESSION
  • 28.
    ZONE 7 :GLAUCOMA HEMIFIELD TEST • Comparison of 5 clusters of points in superior hemifield with mirror images in inferior hemifield
  • 31.
    ANDERSON CRITERIA • 3or more congrous ‘non edge points’ in typical arcuate area on 30-2 program depressed @ p< 5 % with at least one point @ p<1 % •PSD / CPSD @ p< 5% •GHT – outside normal limits  Must be demonstrated on 2 field tests
  • 33.
    QUALITY OF VF Good eye-hand coordination -not suitable for pt with nystagmus, parkinson,  Corrected rx  Poor result lead to misdiagnosis  Bad day
  • 34.
    VF ARTIFACTS  OBSTRUCTION RIMARTEFACTS PTOSIS MEDIA OPACITIES  MIOSIS  REFRACTION ARTEFACTS  High power plus and minus lenses
  • 37.
  • 45.
    MONITORING VF PROGRESSION New case/glaucoma suspect : 2 VF IN FIRST 6 MONTH. 2 MORE VF IN NEXT 18 MONTH 4 VF in 2 years  MD ≥-2DB/ year : 6 VF in the first 2 year  After first 2 years  stable / slow risk : once a year  Low mod risk – once yearly  High risk – 6 month
  • 46.
    Excellence is notbeing the best. It is doing the best. Thank you.