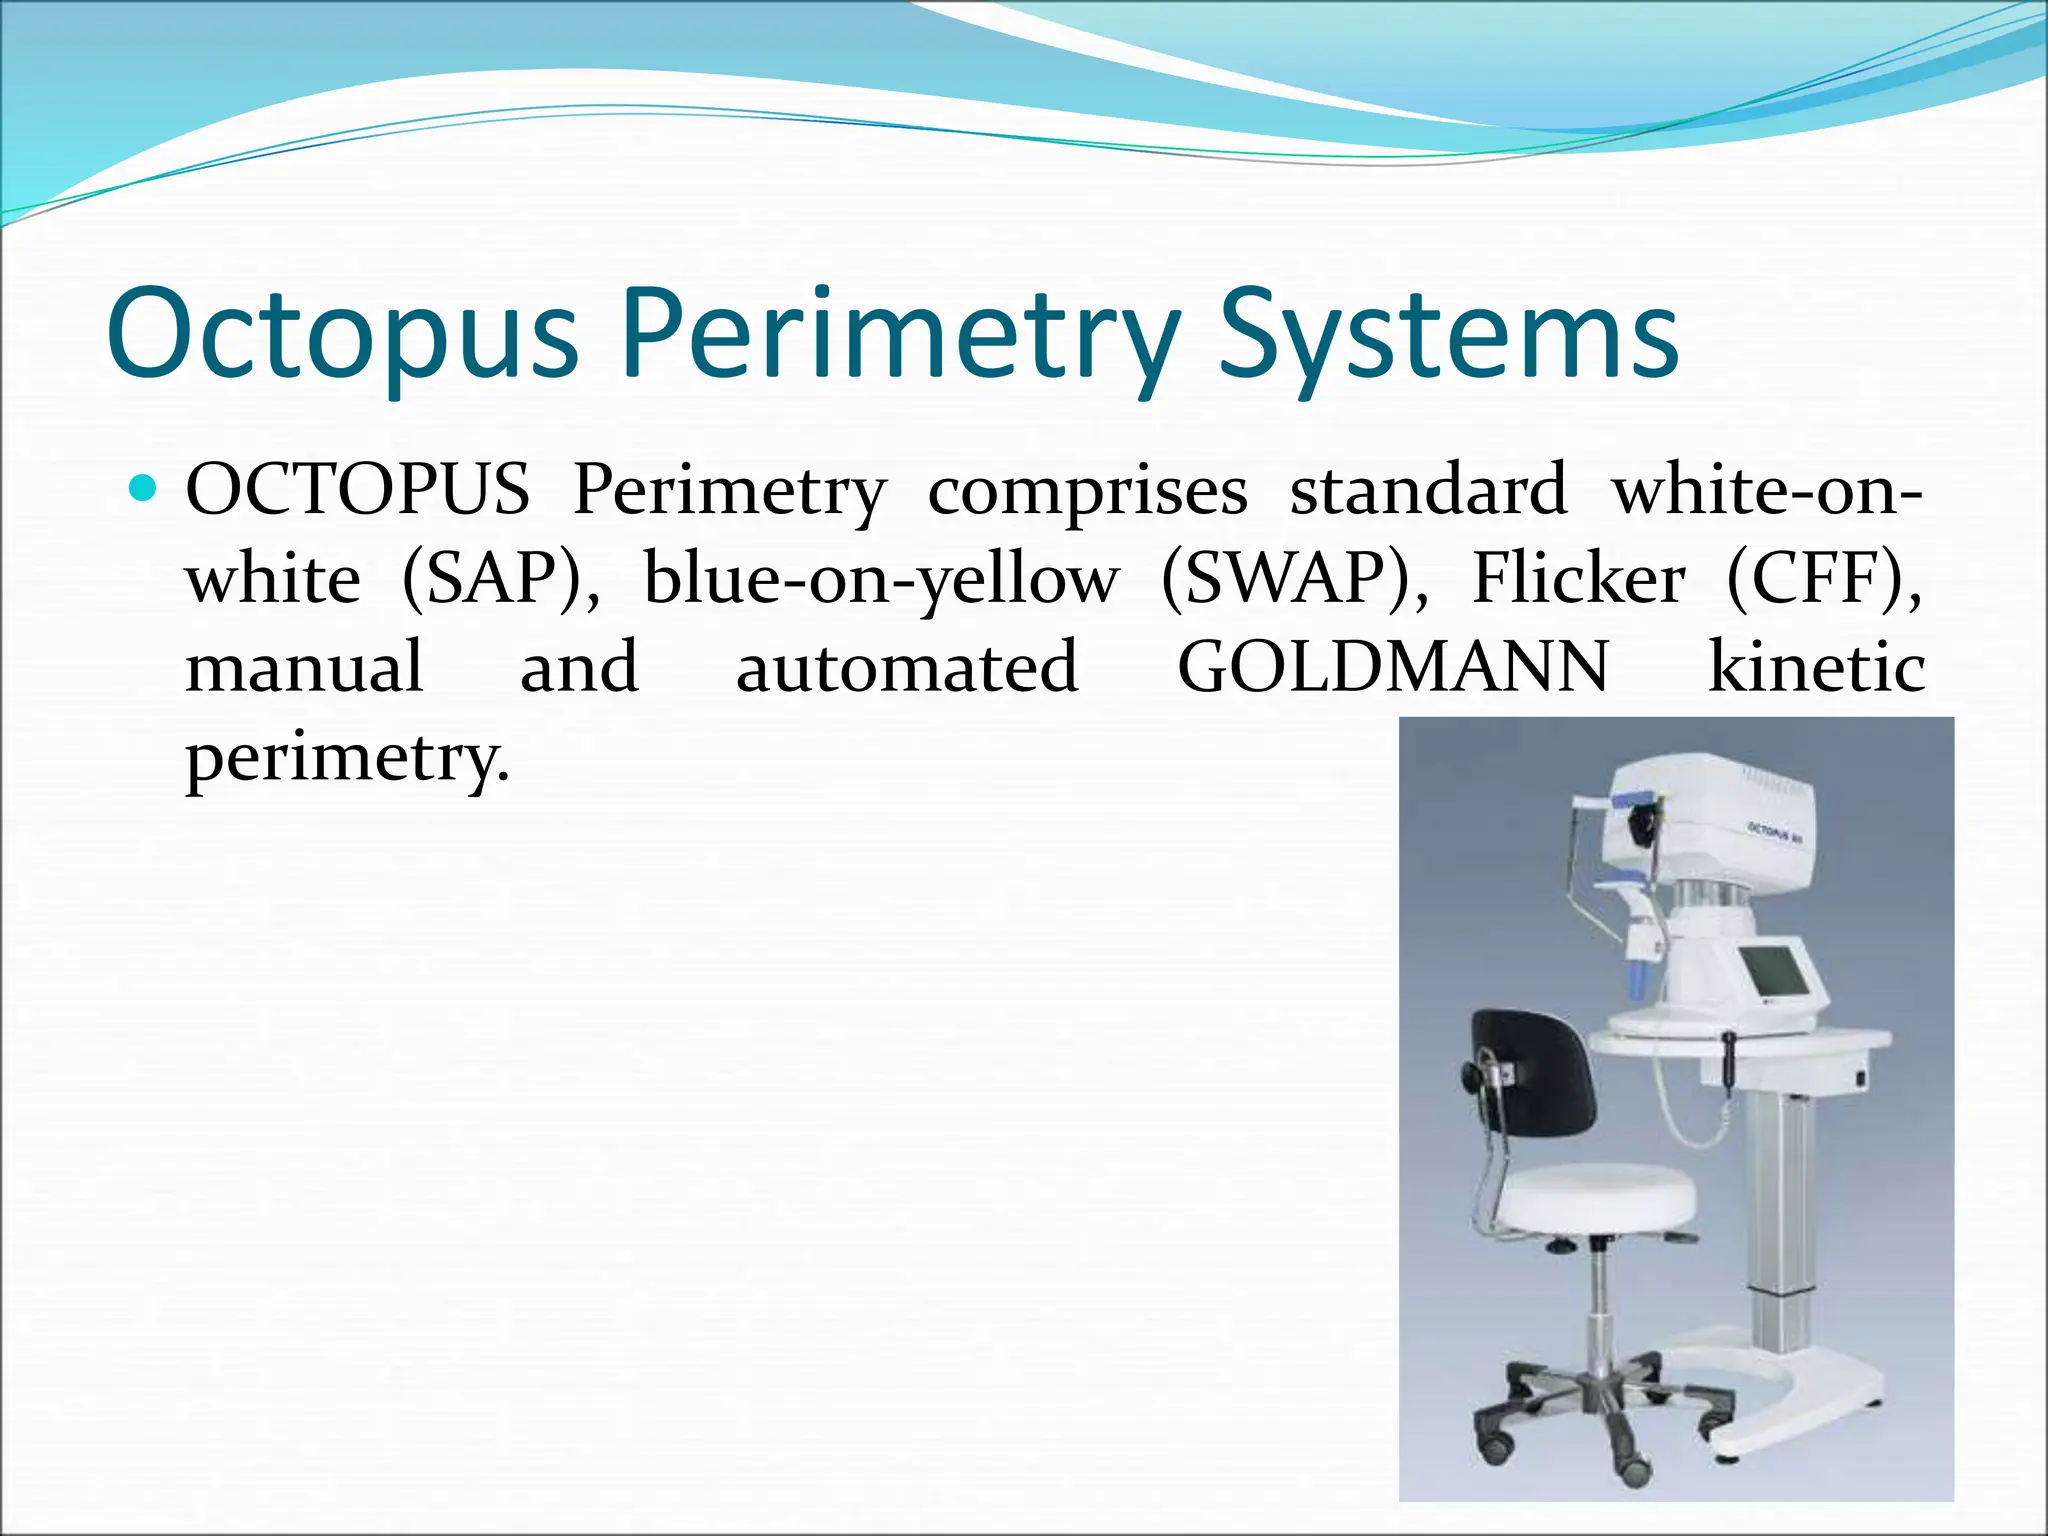
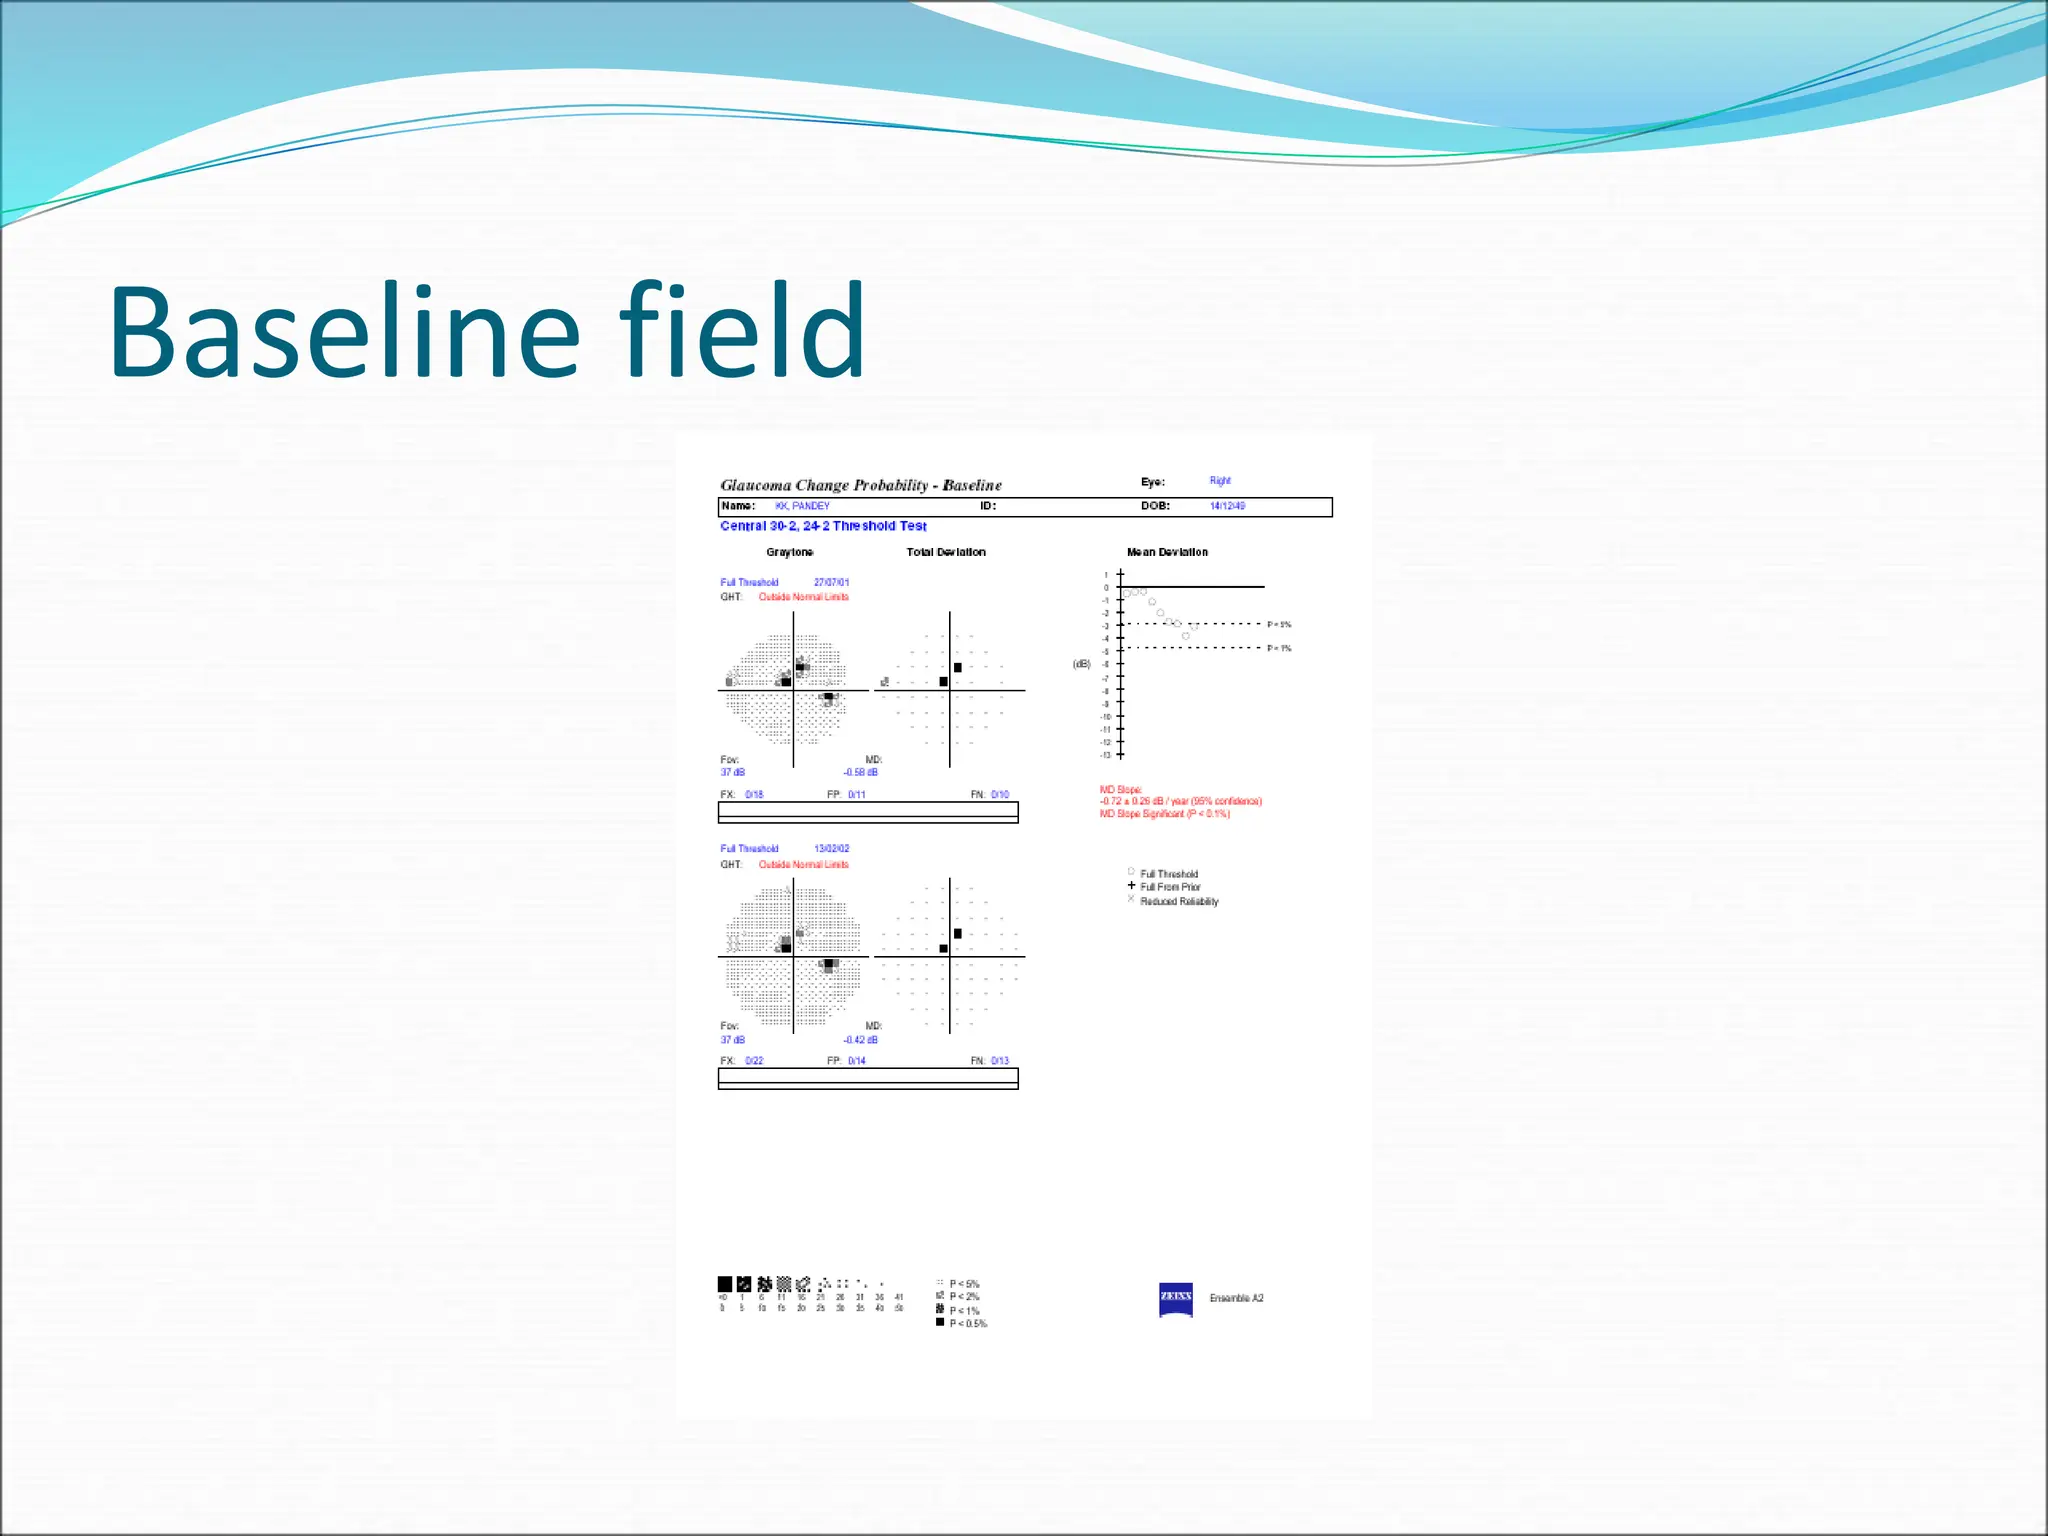
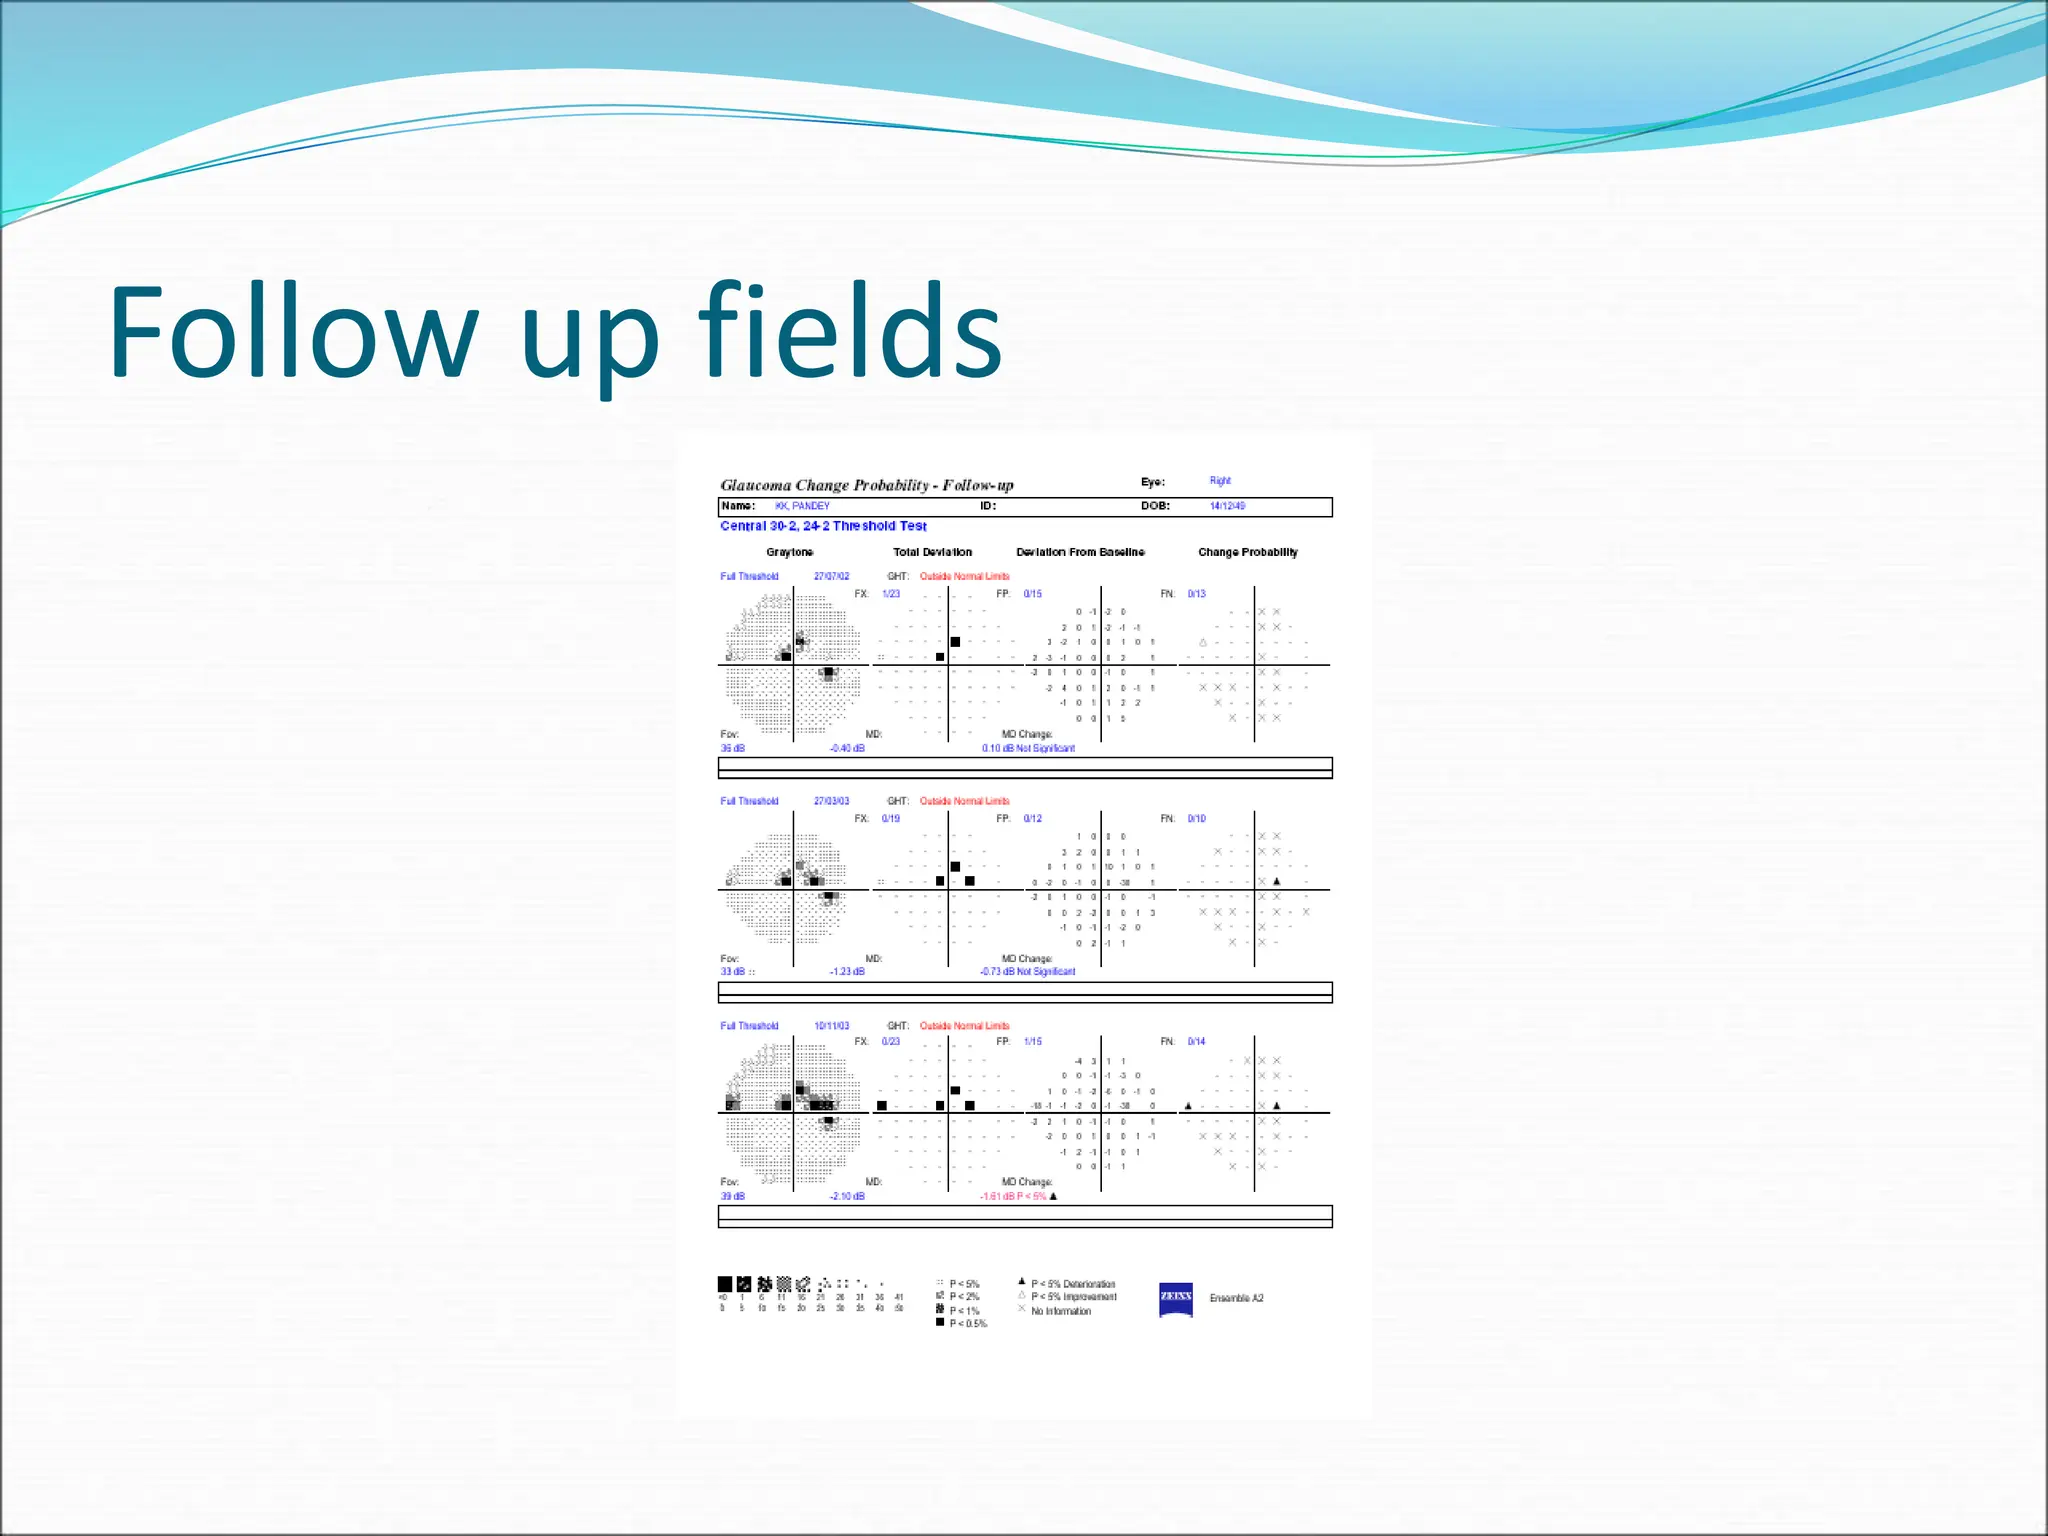
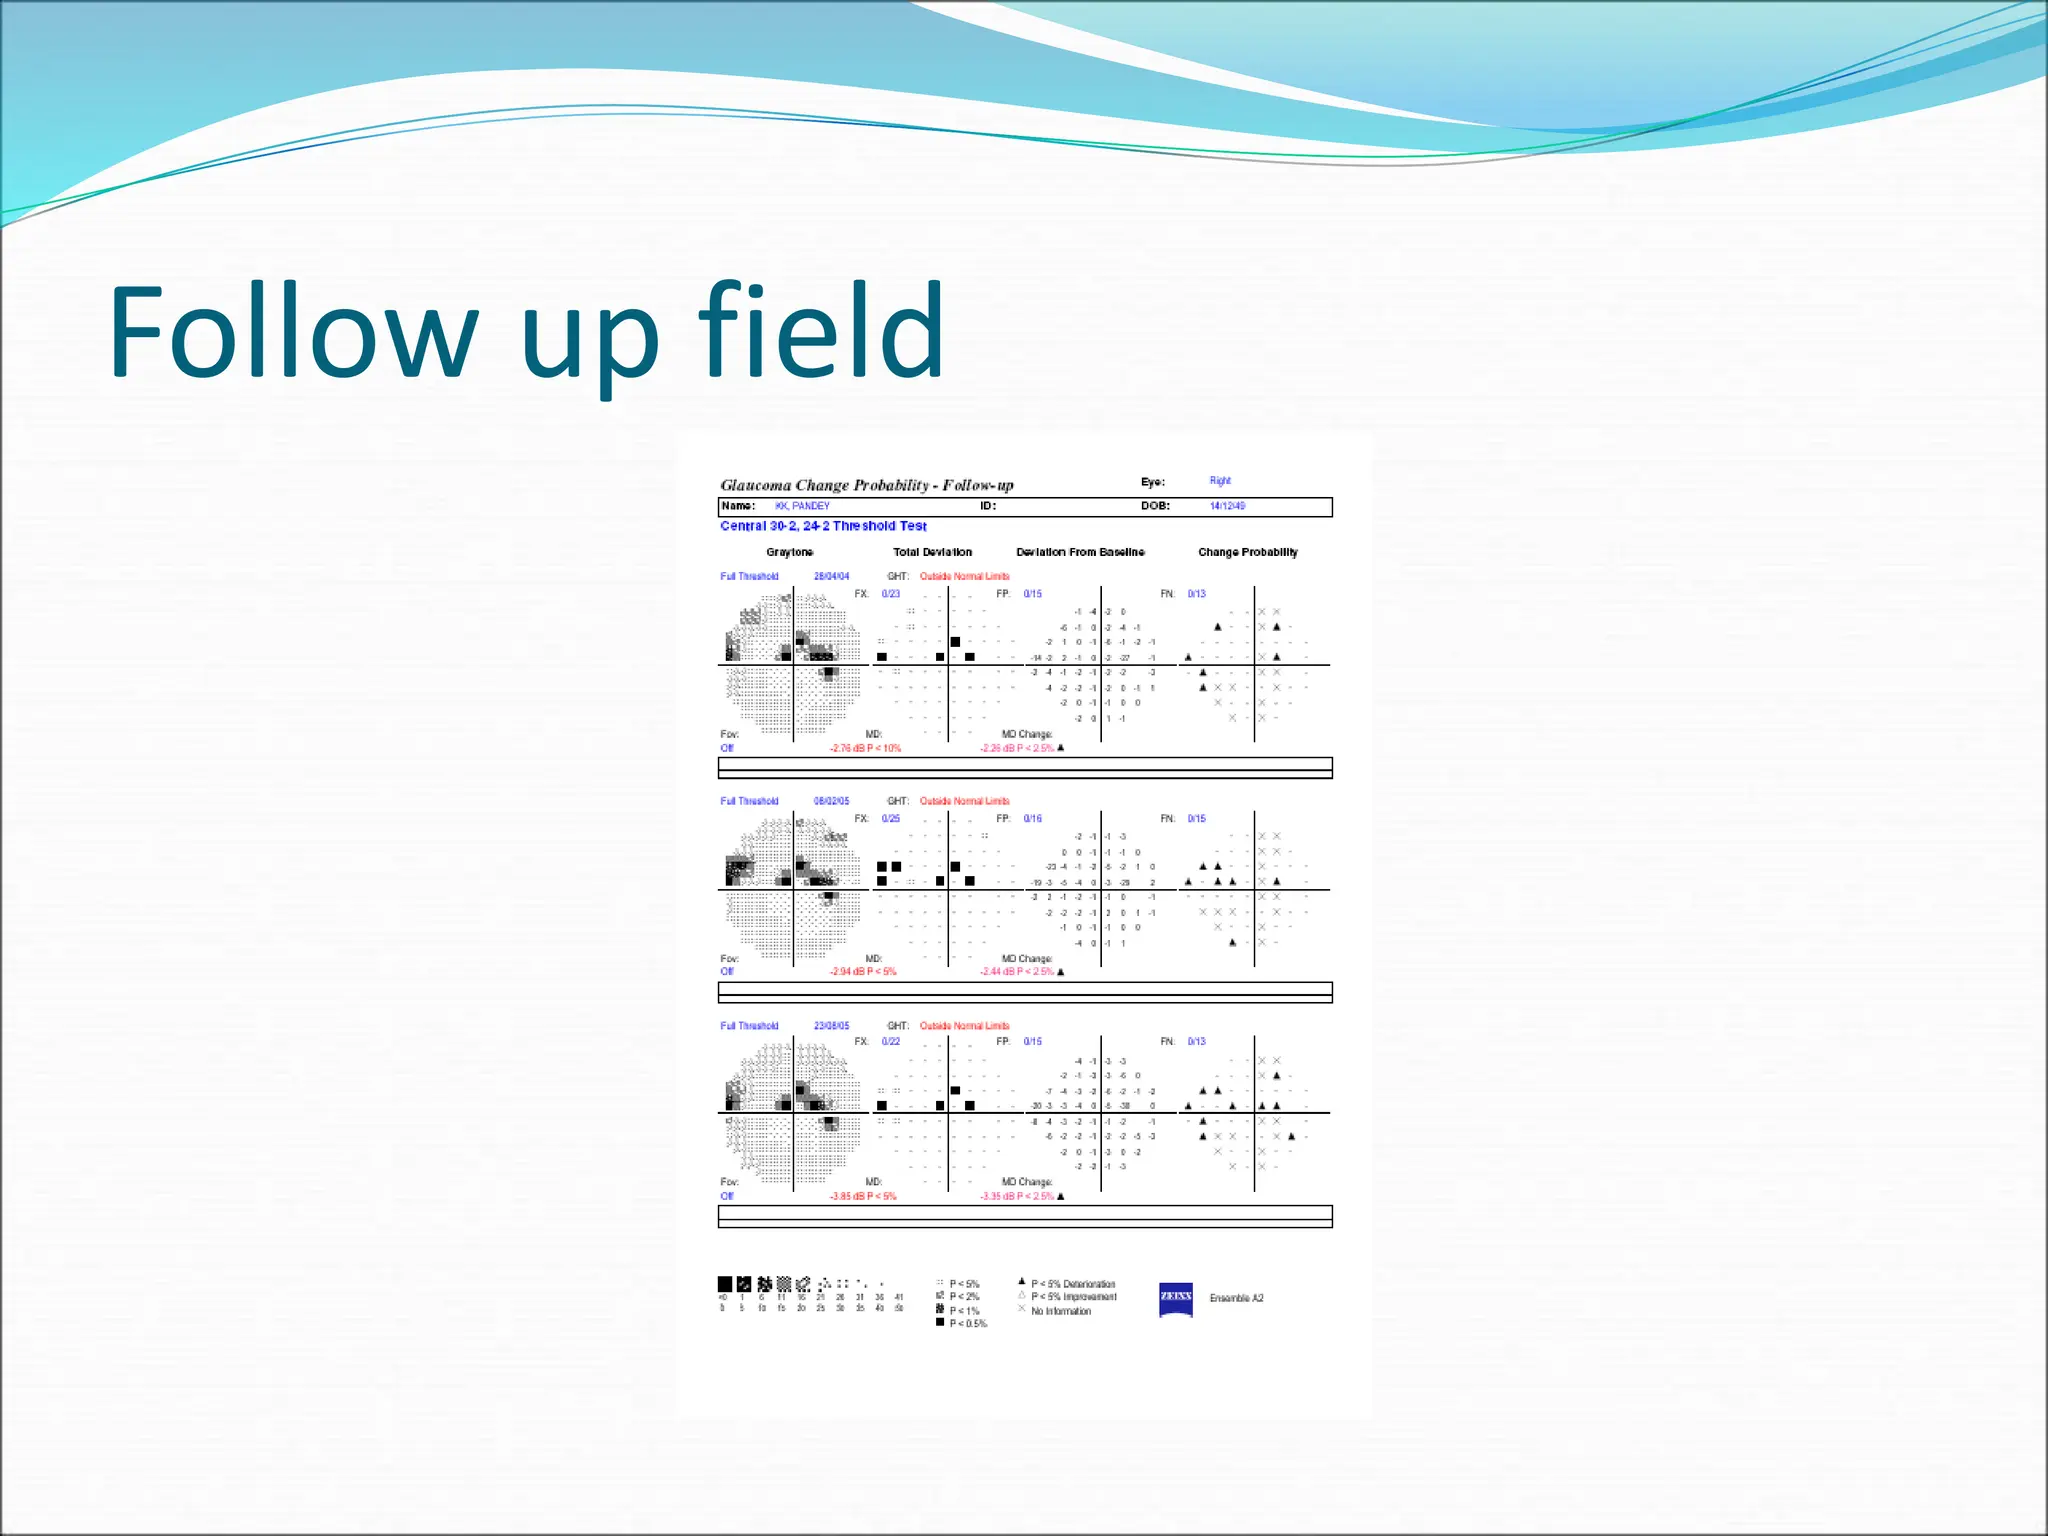
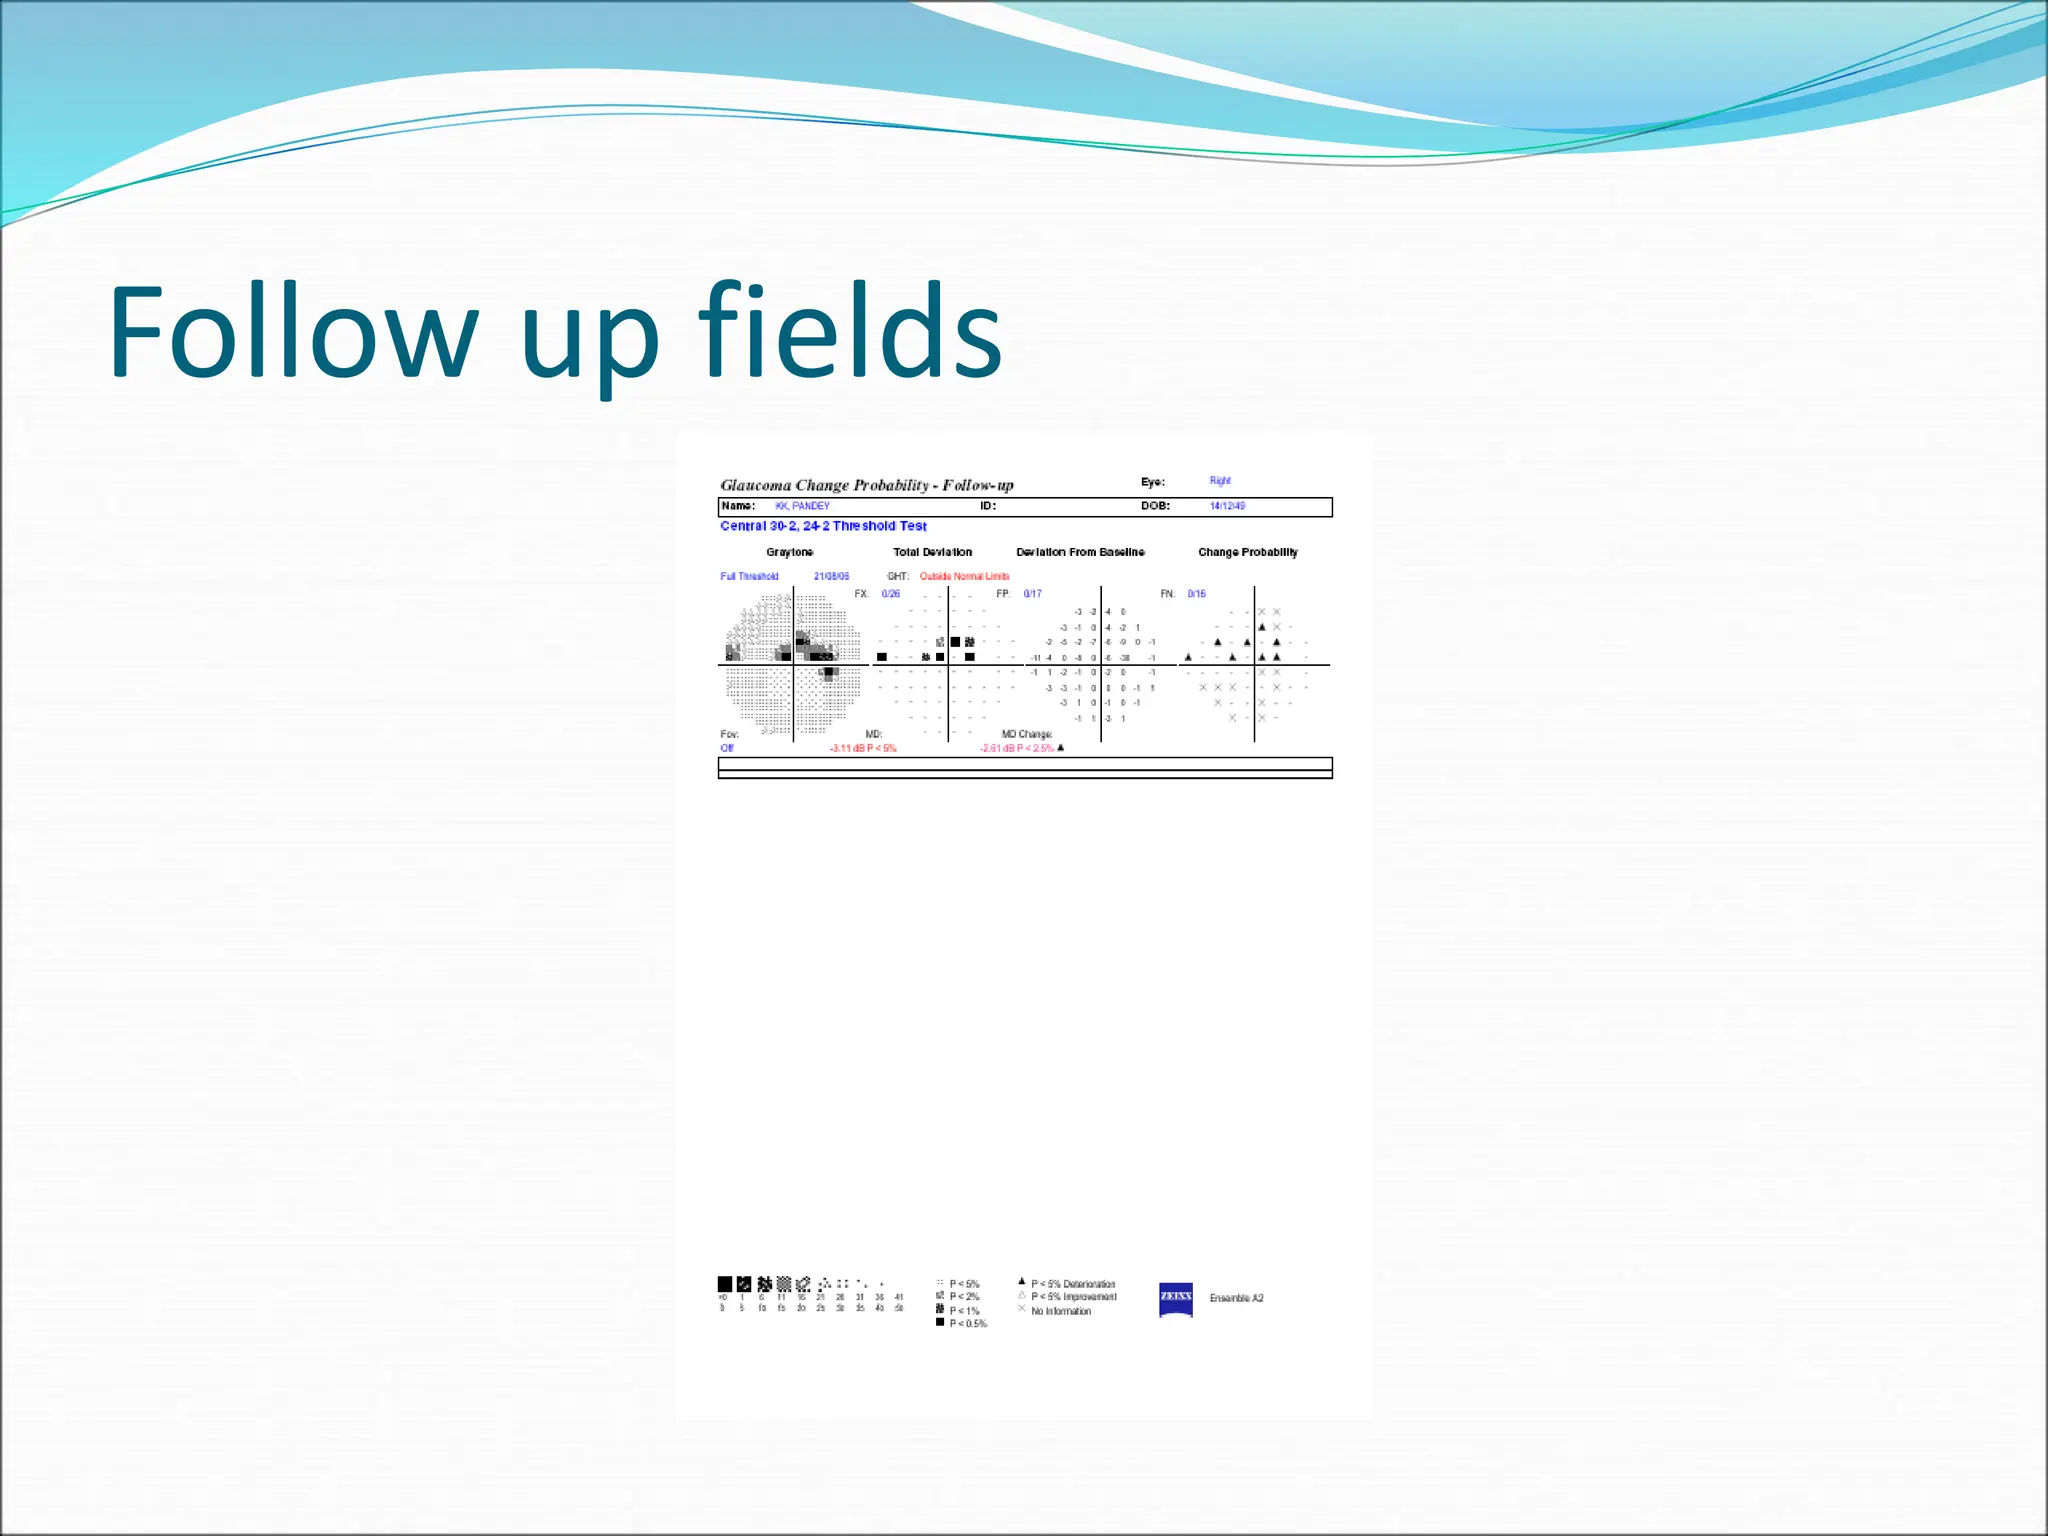
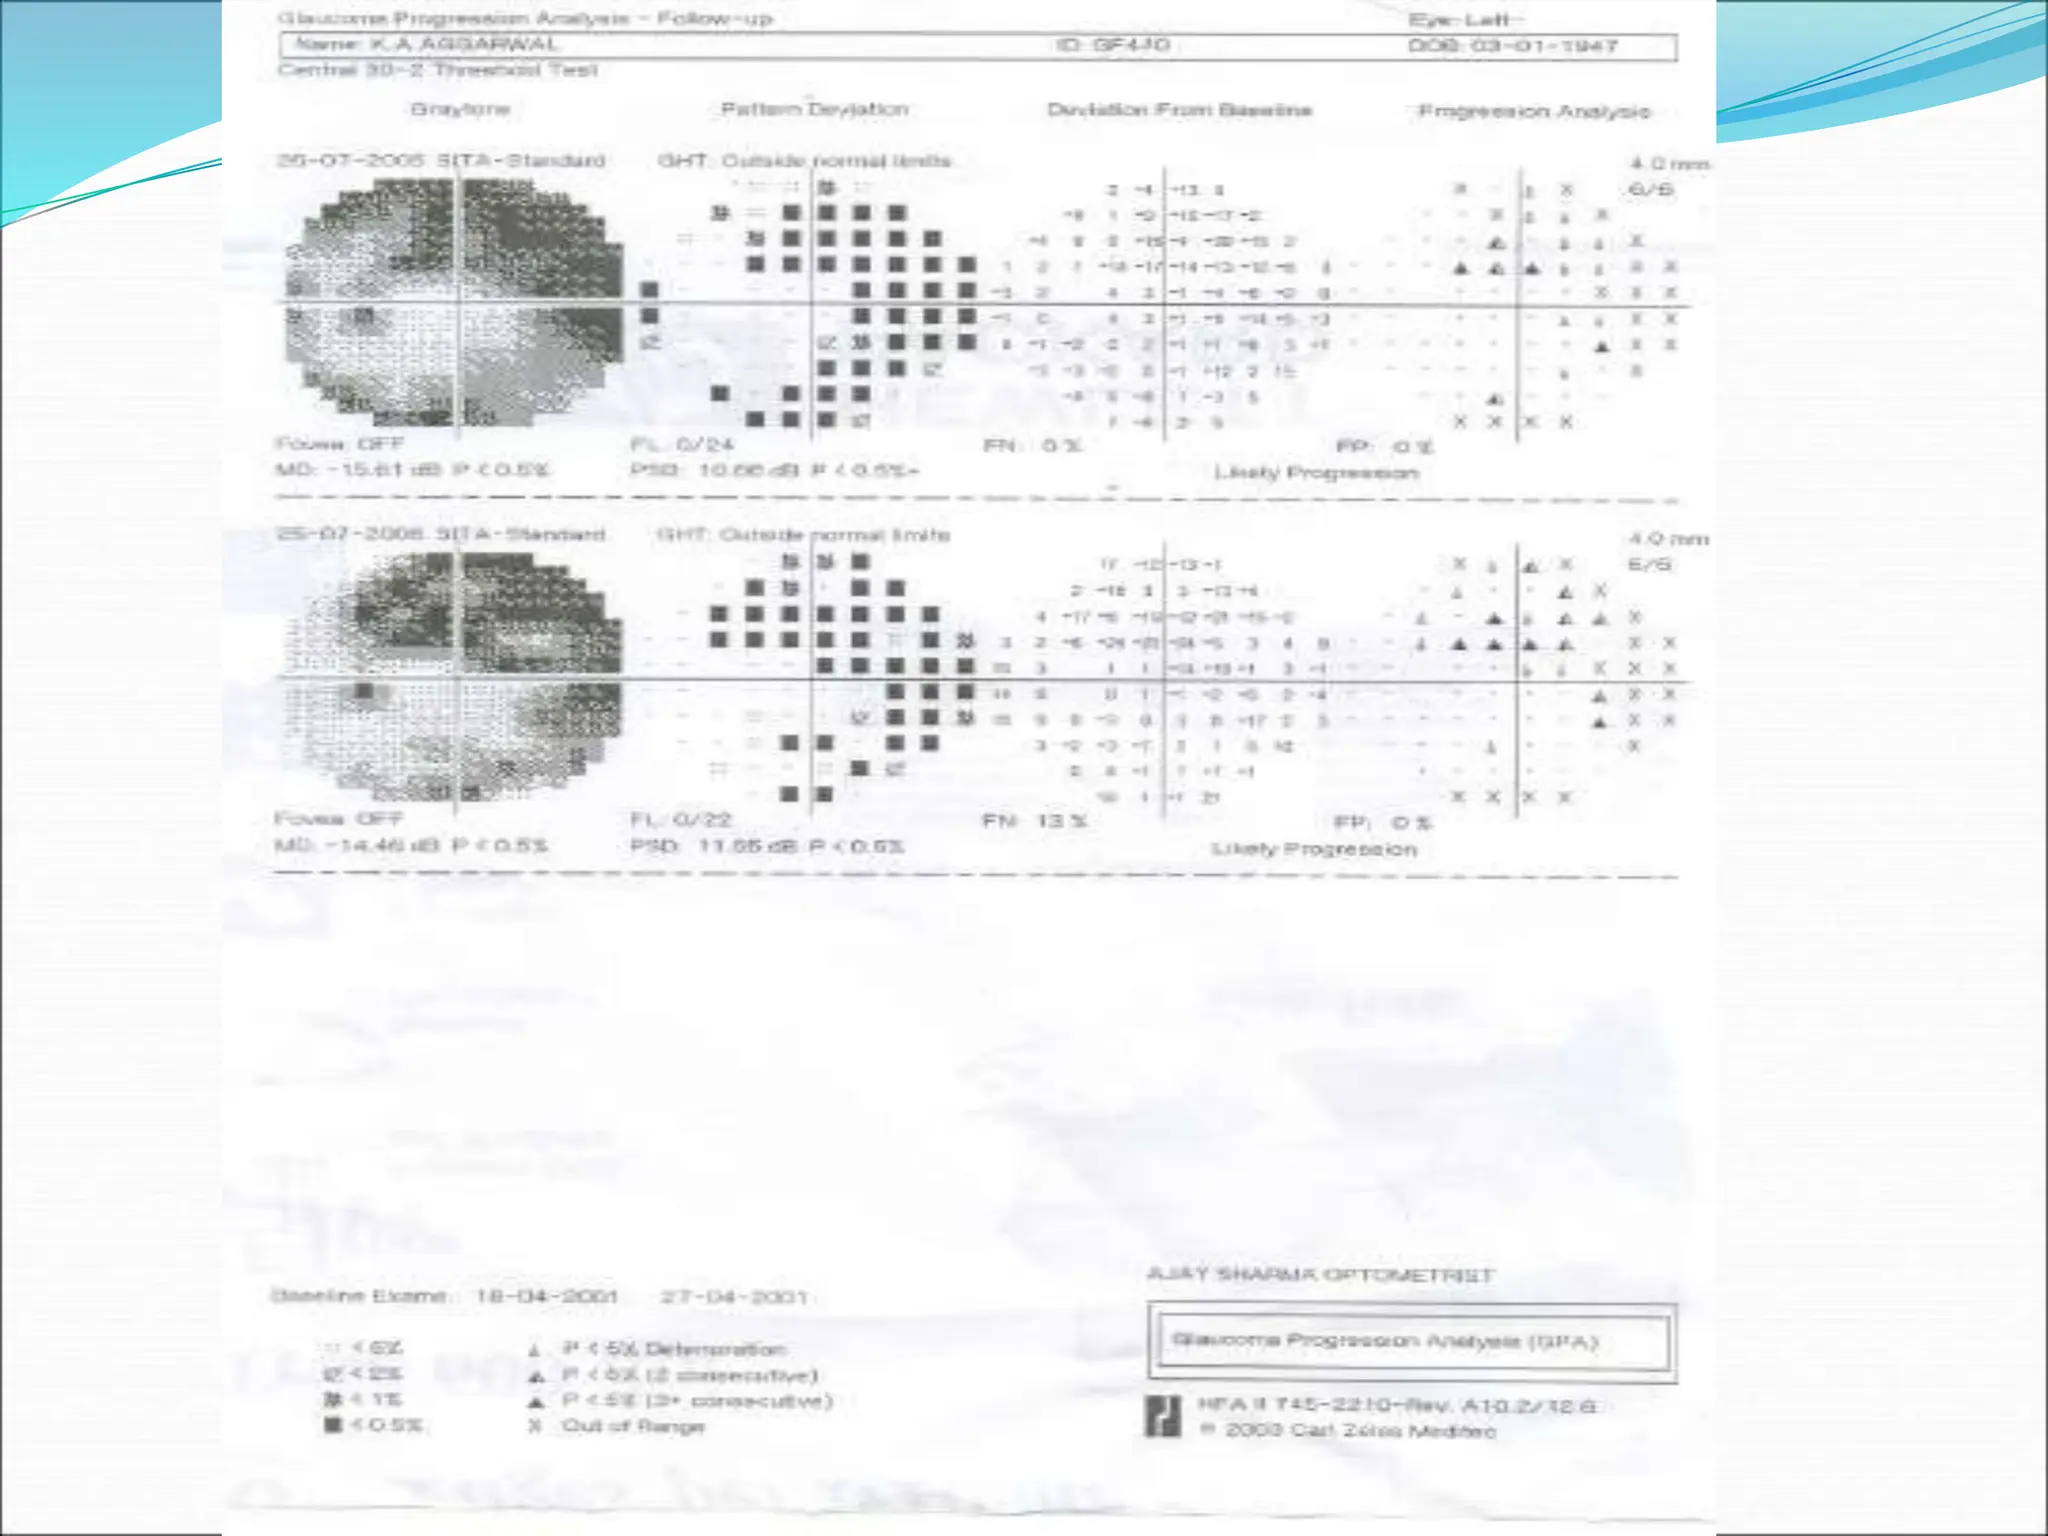
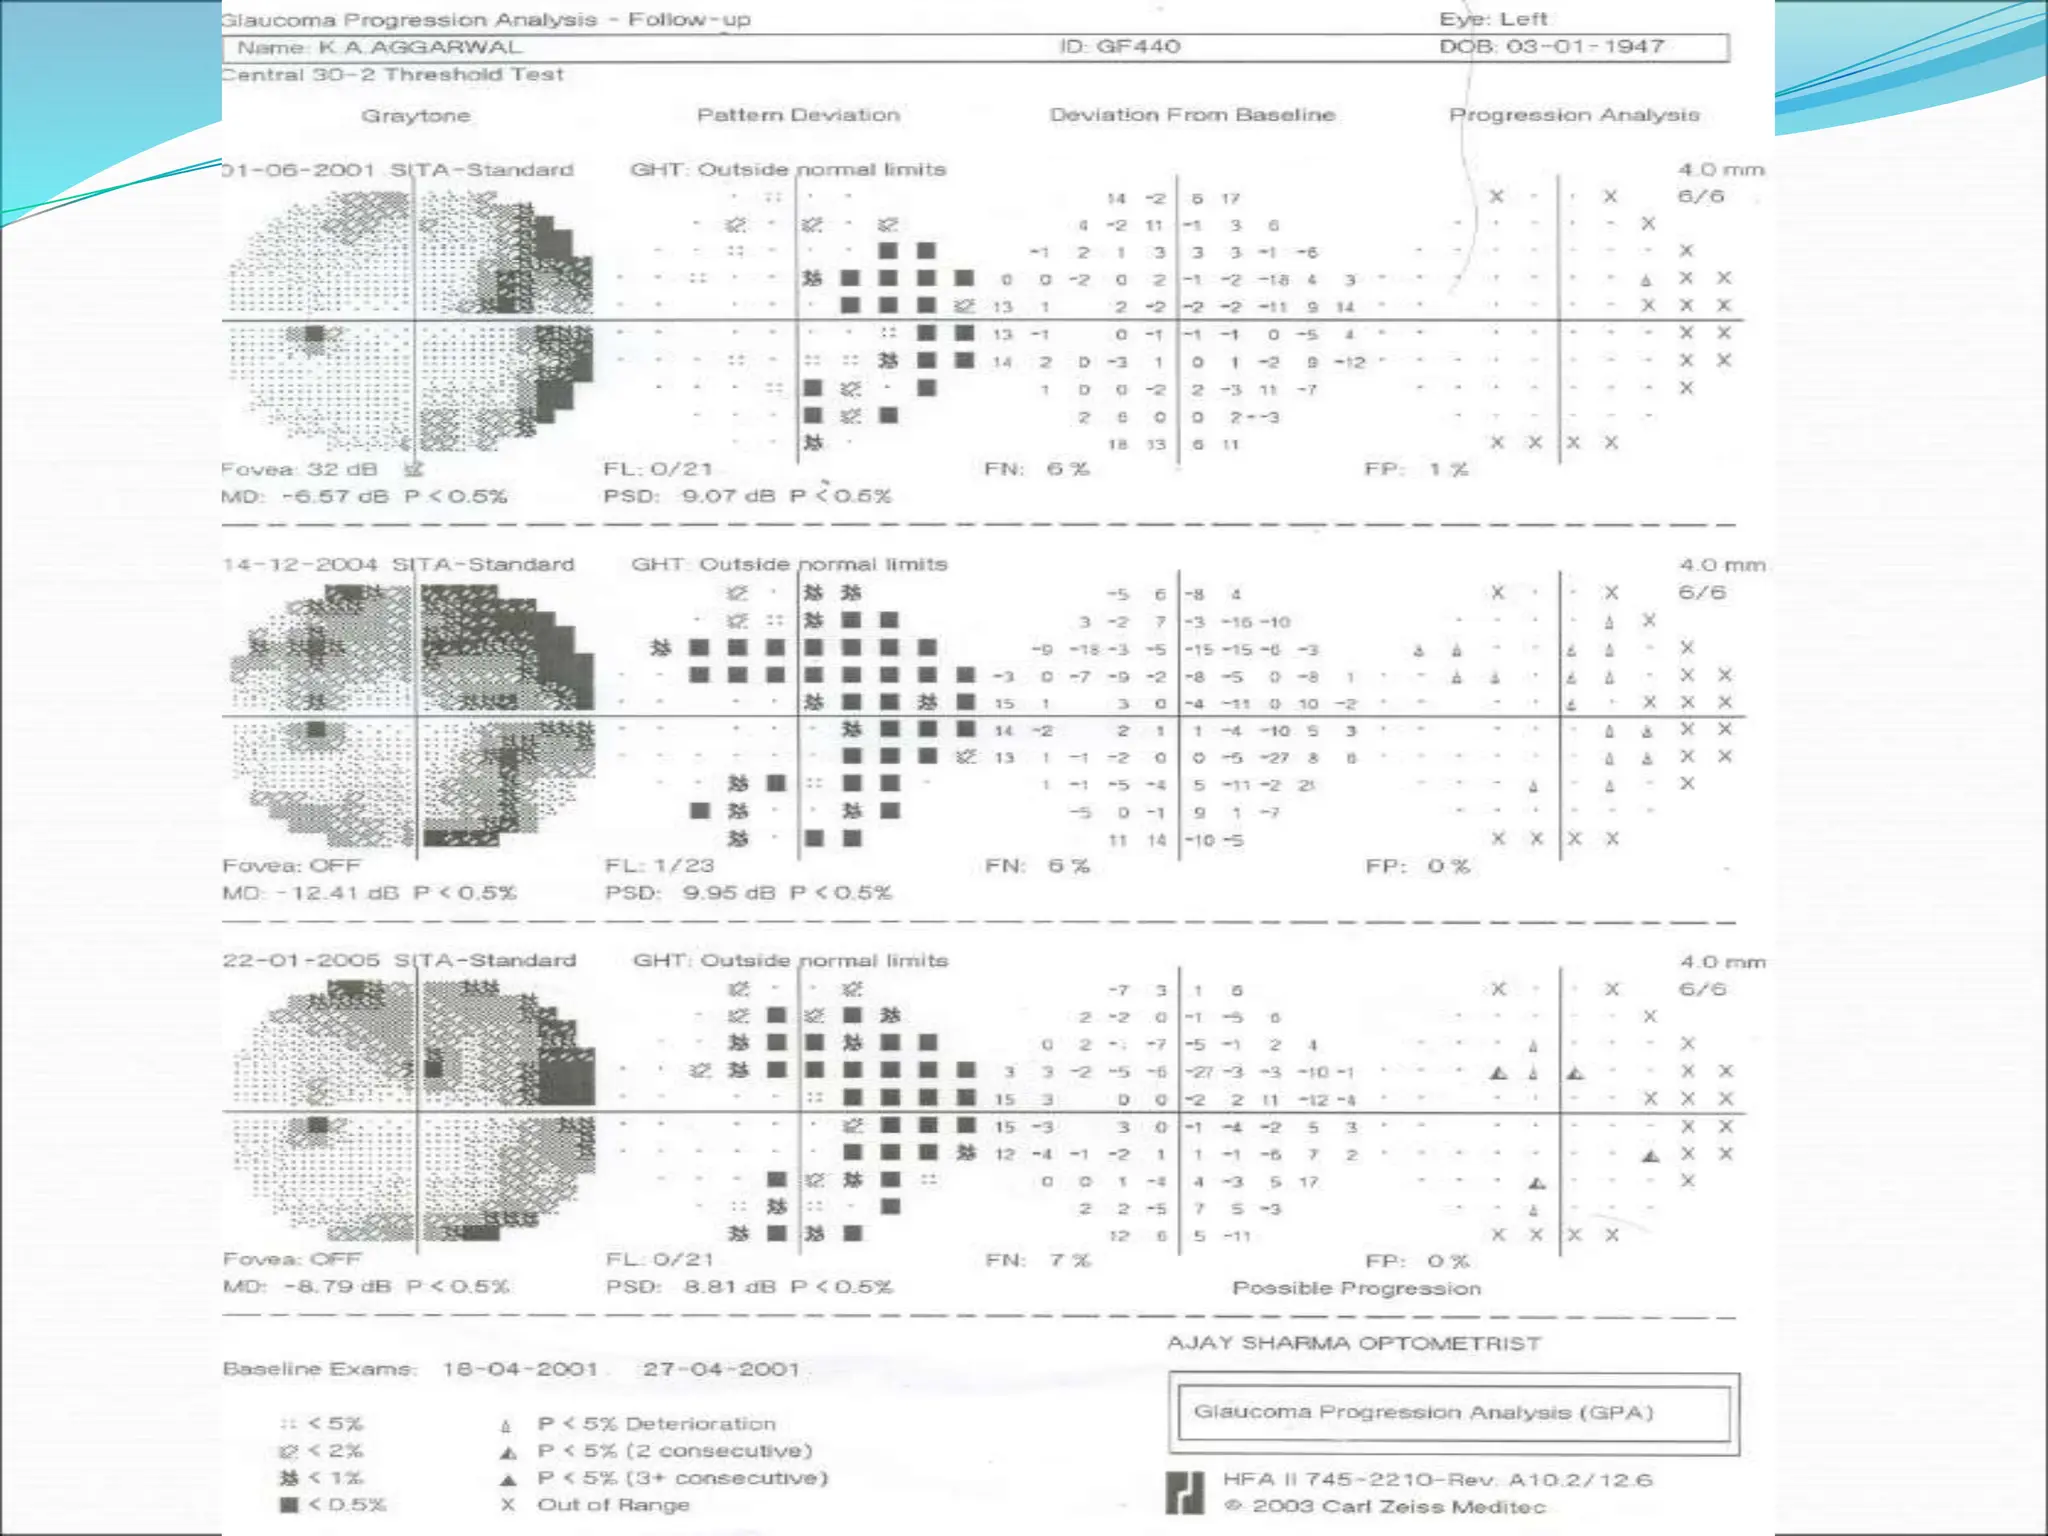
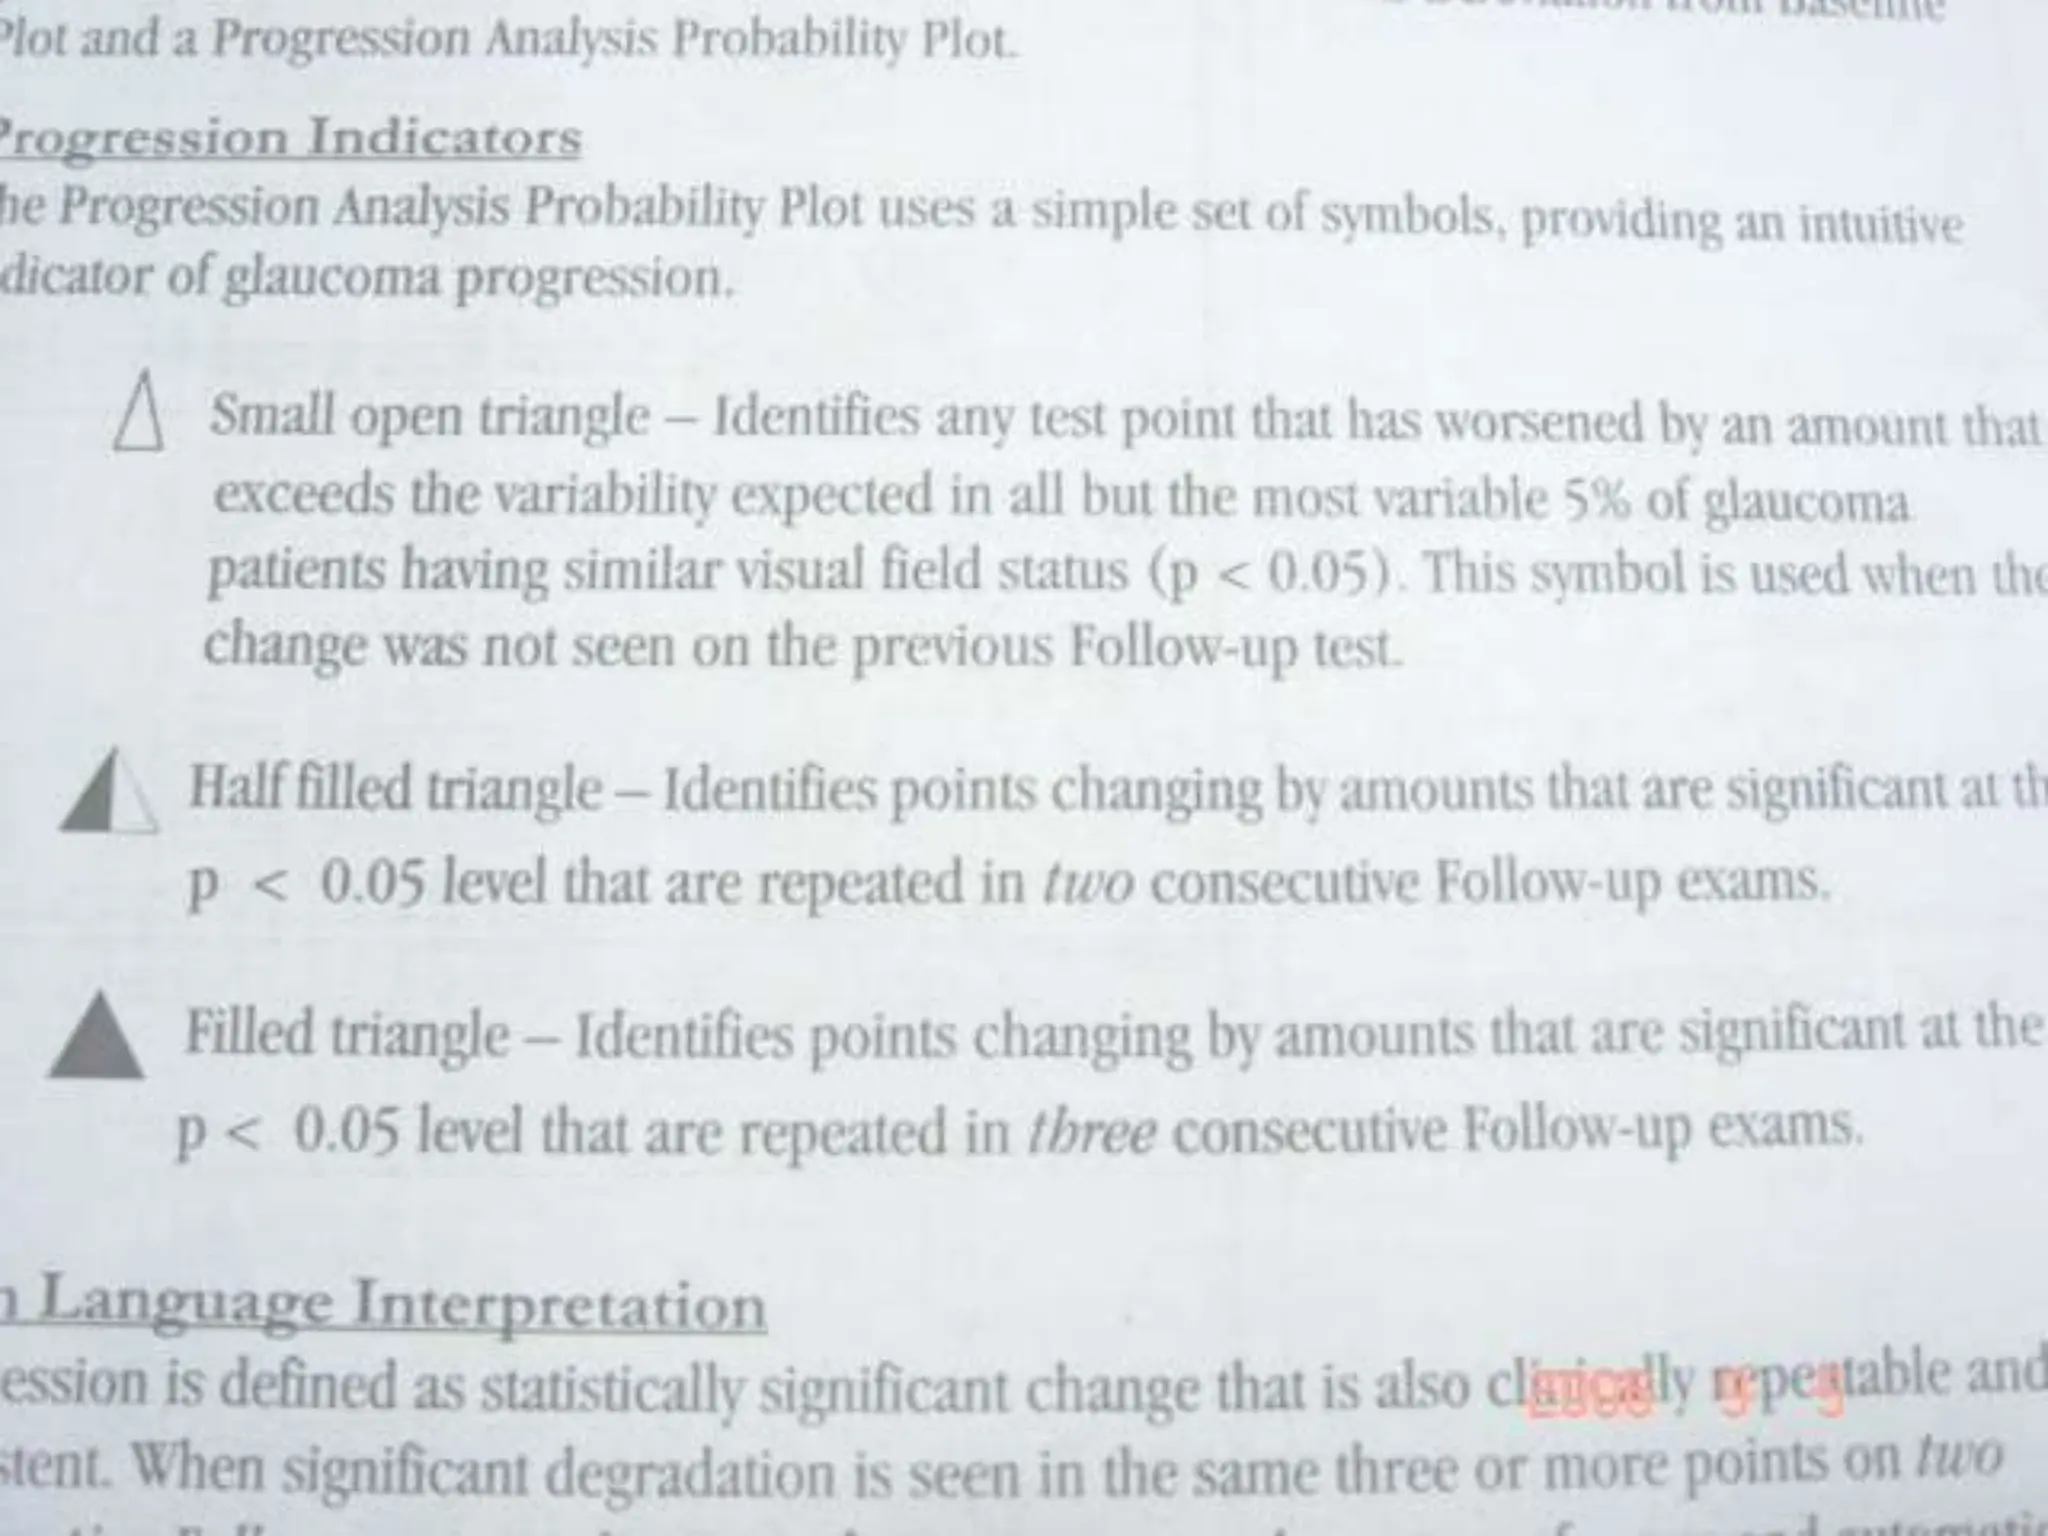
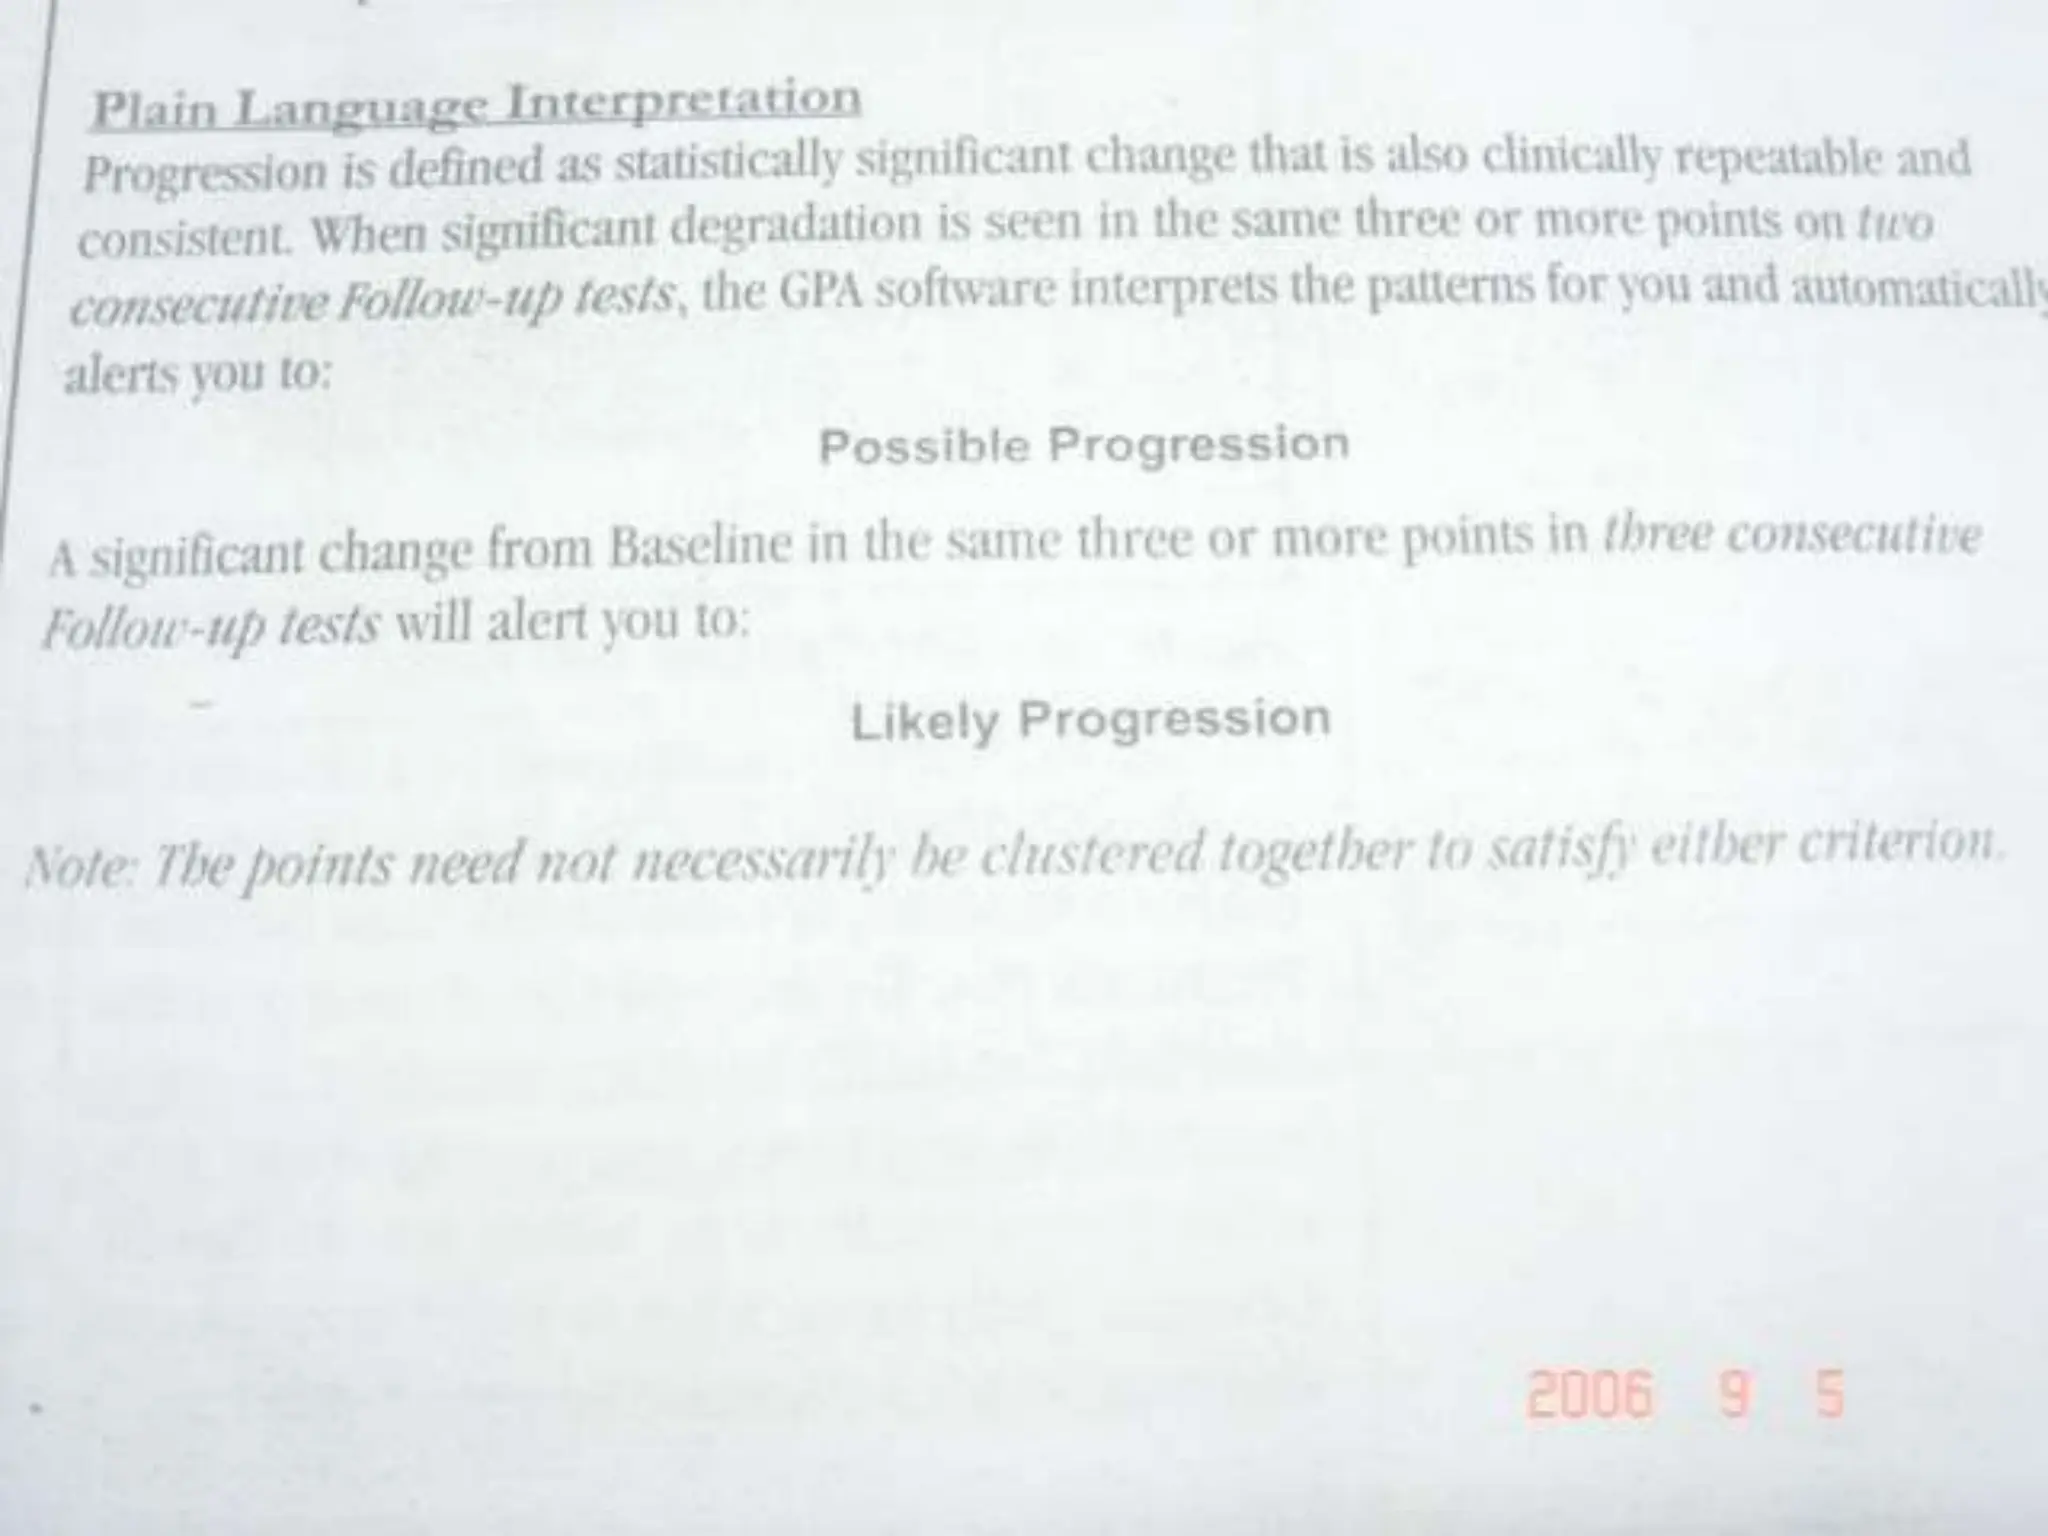
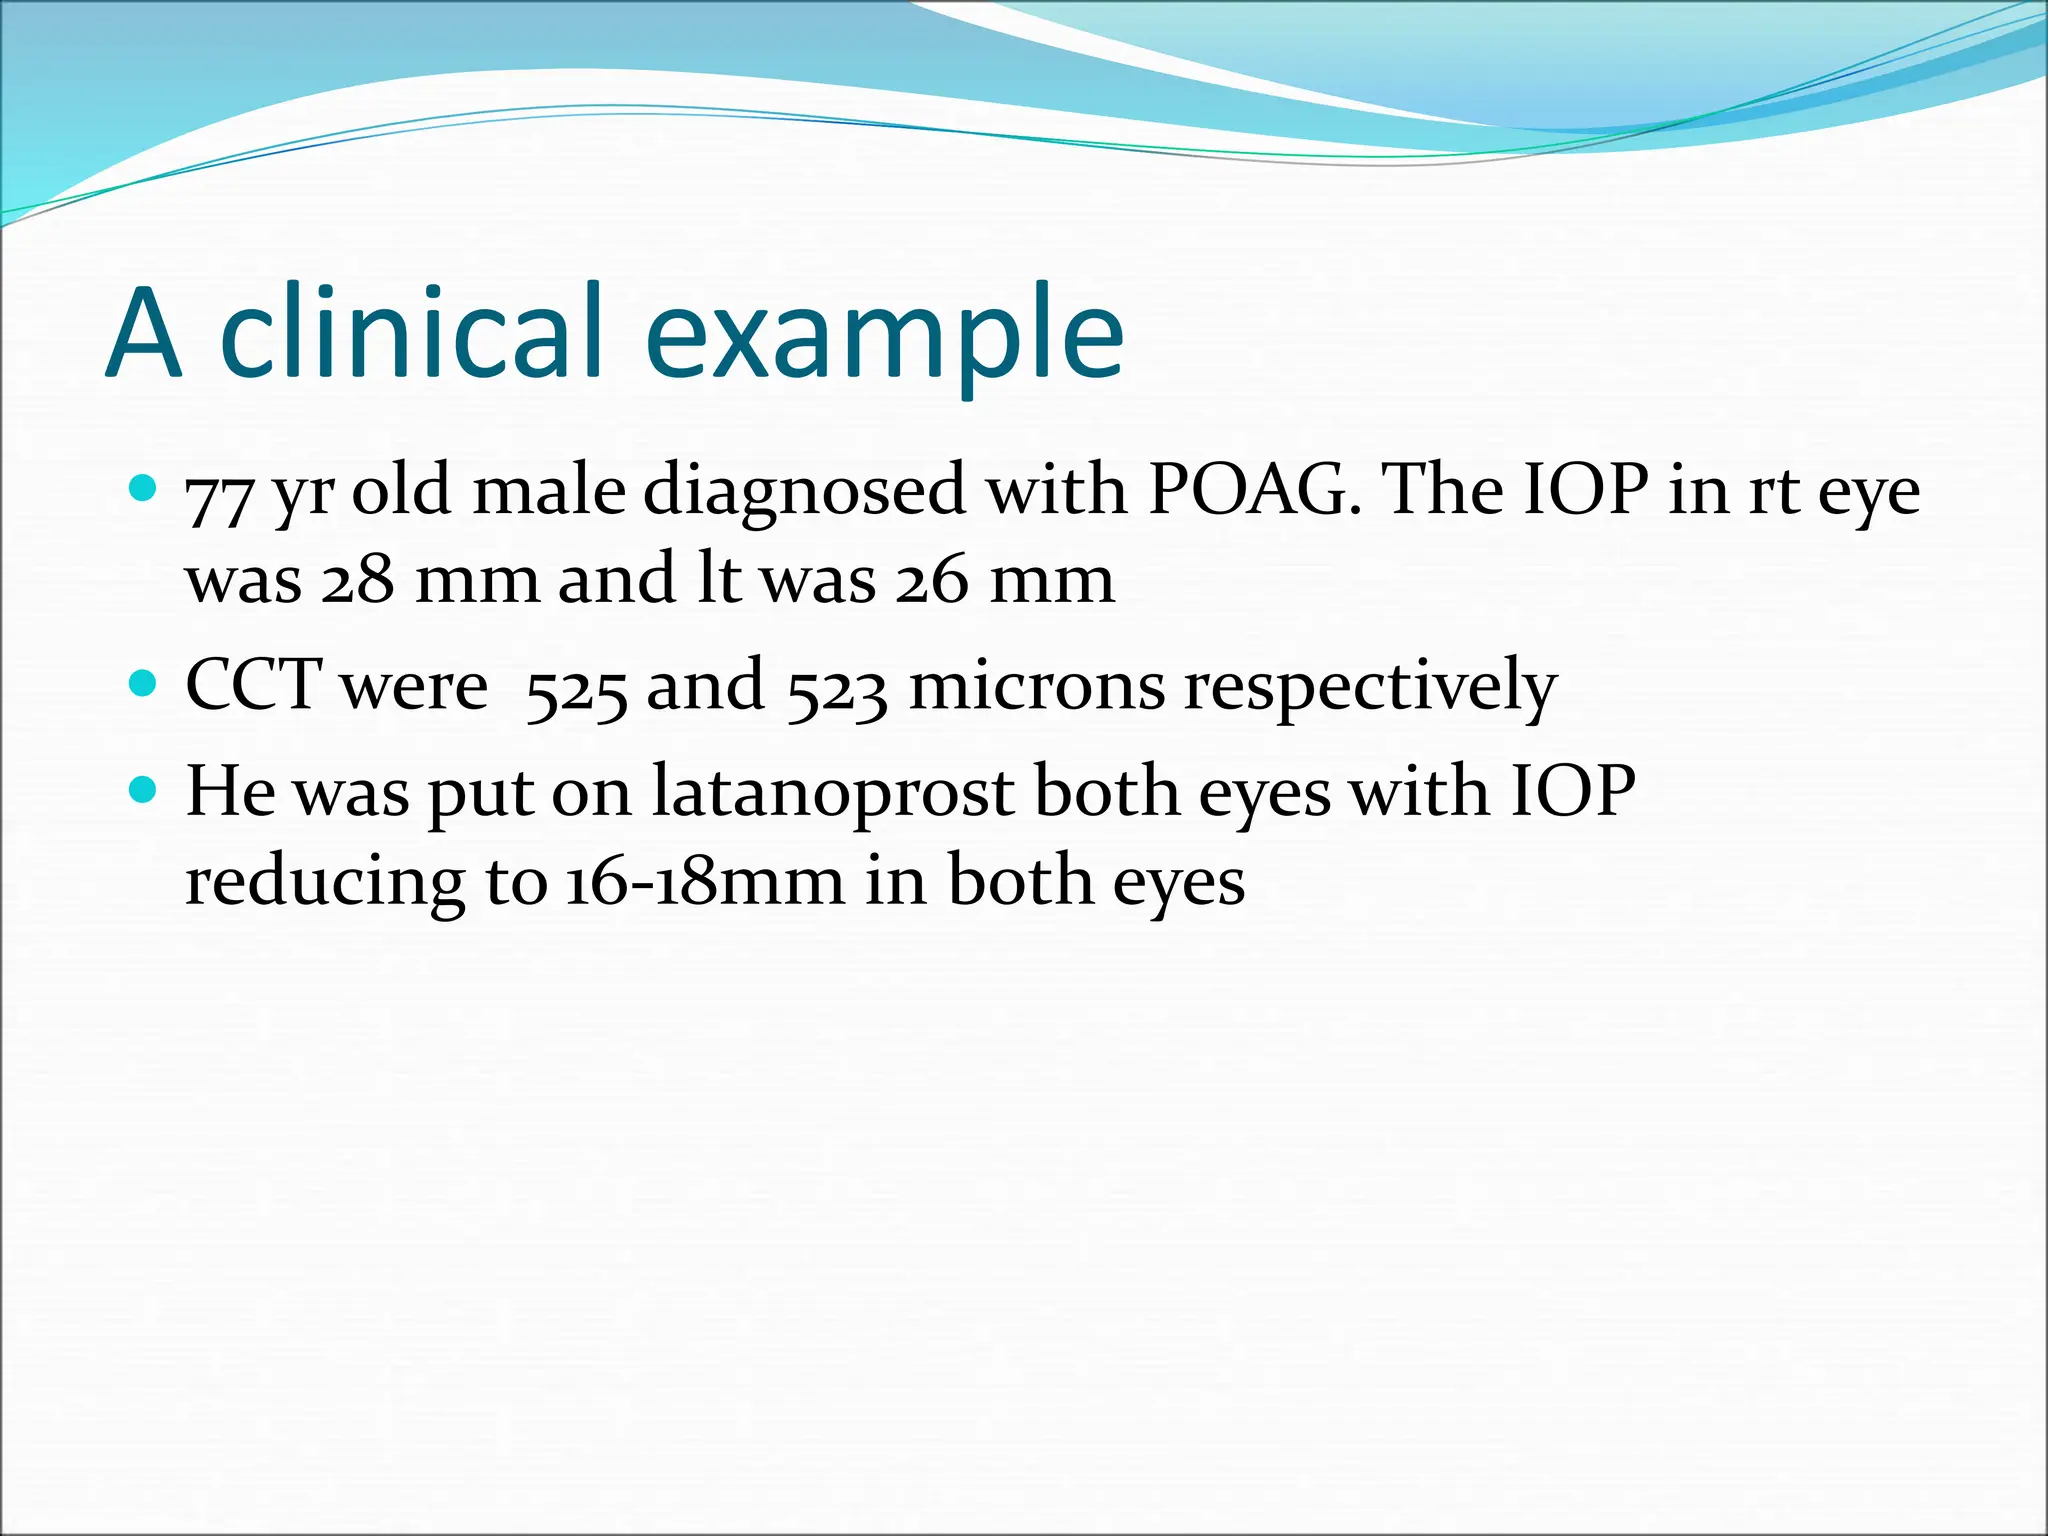
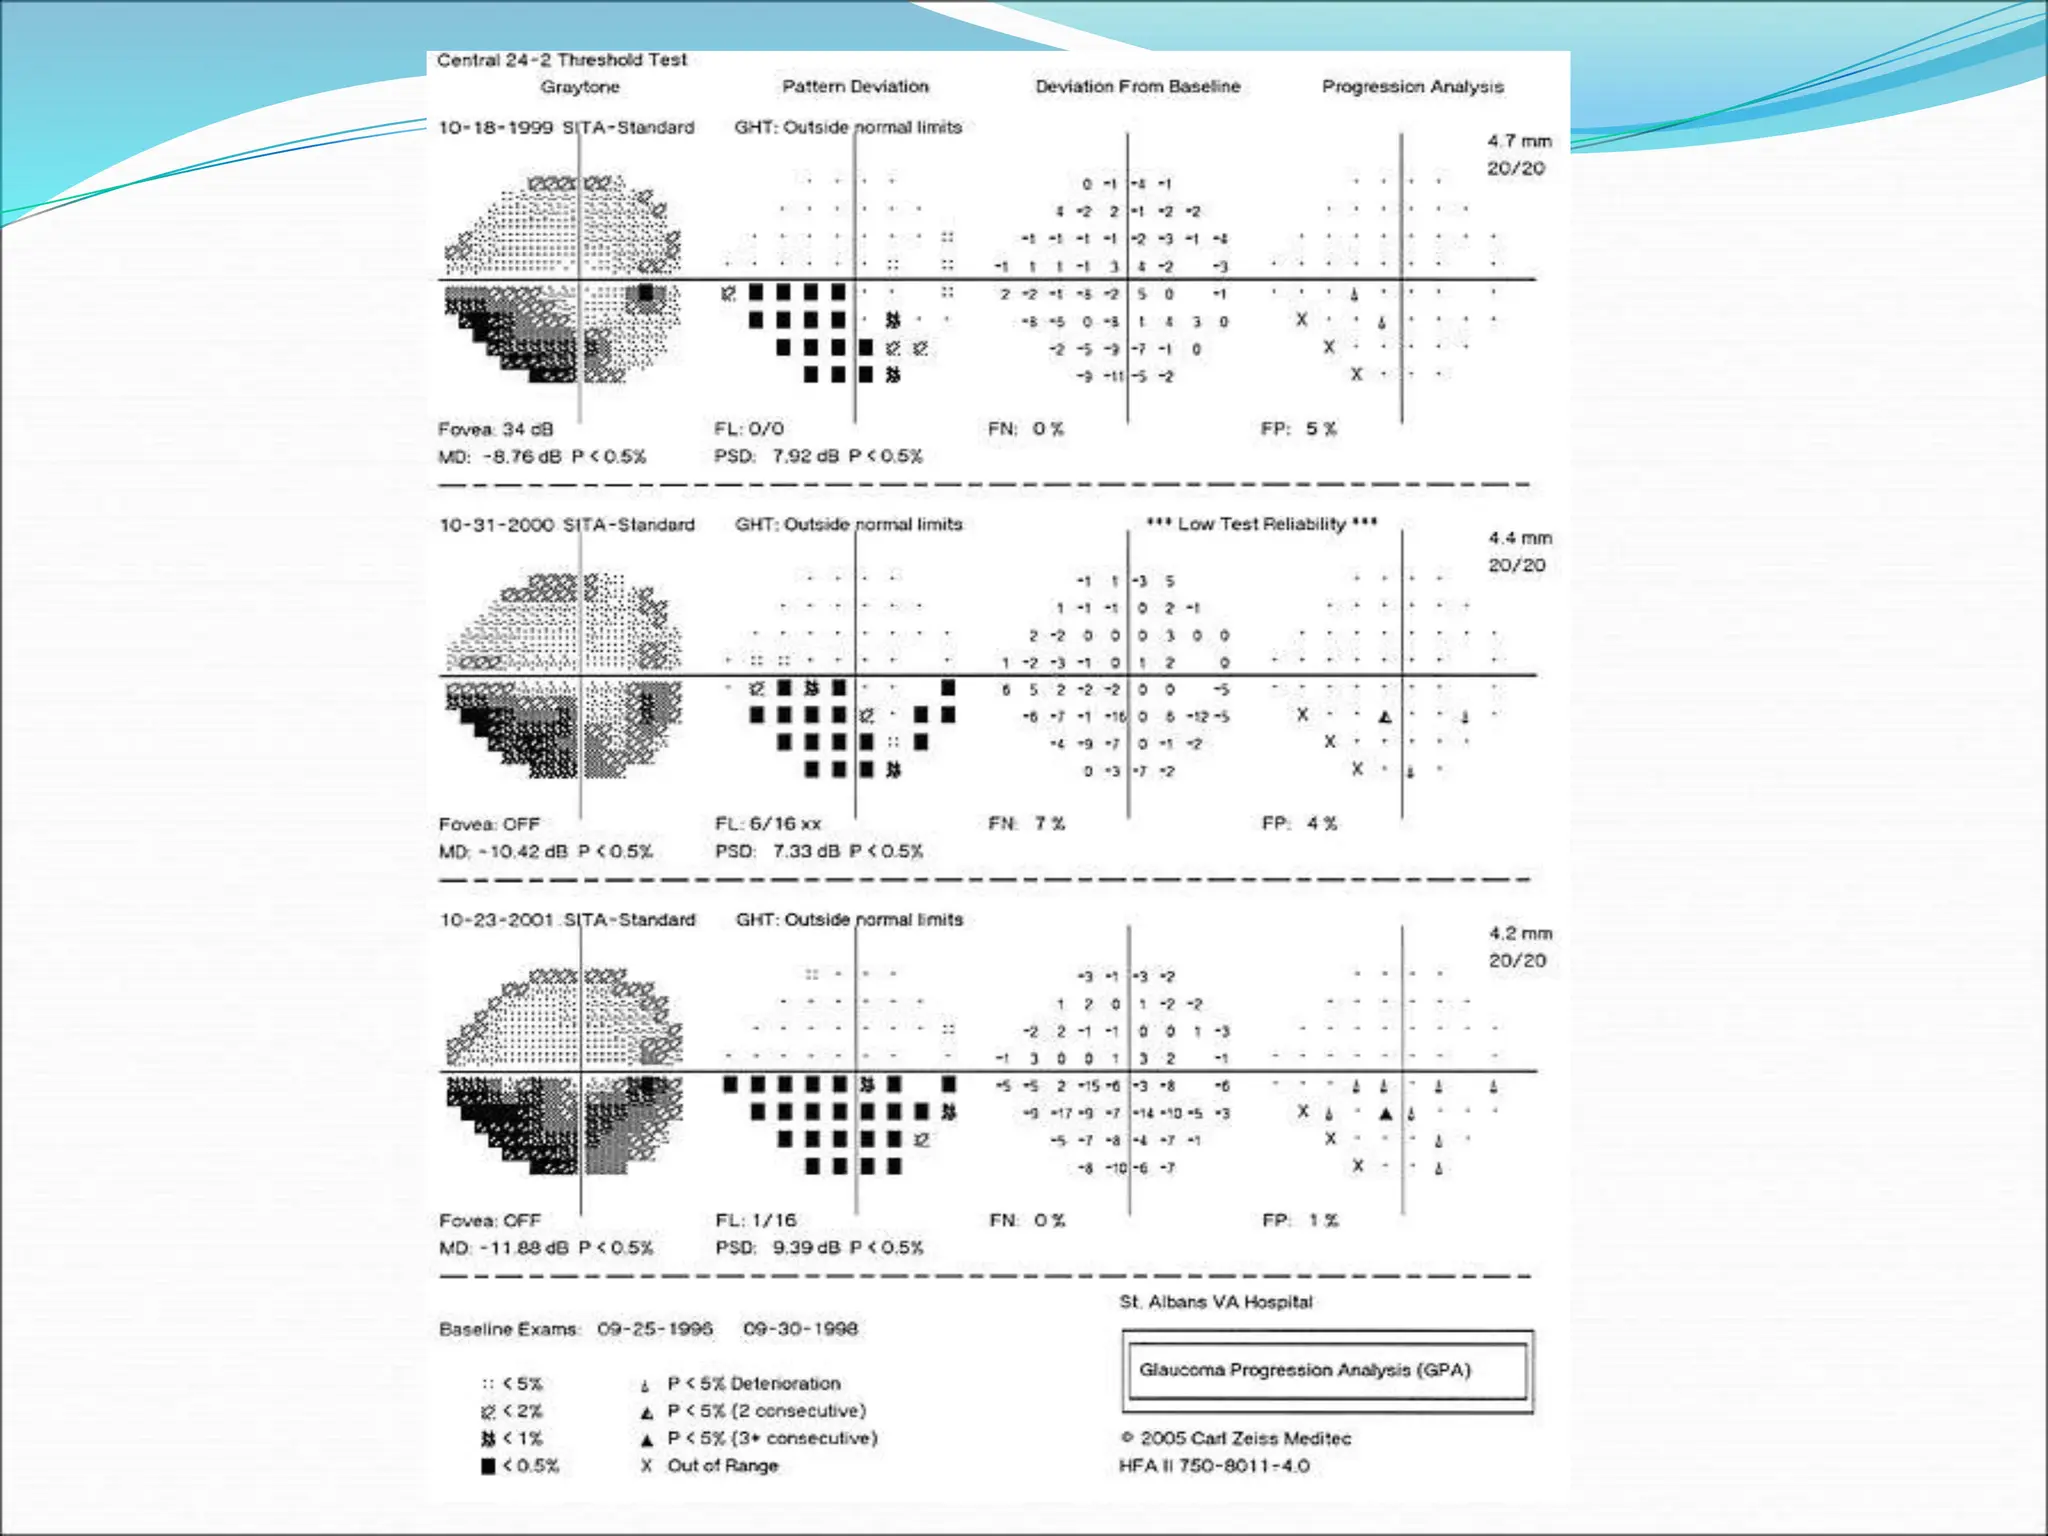
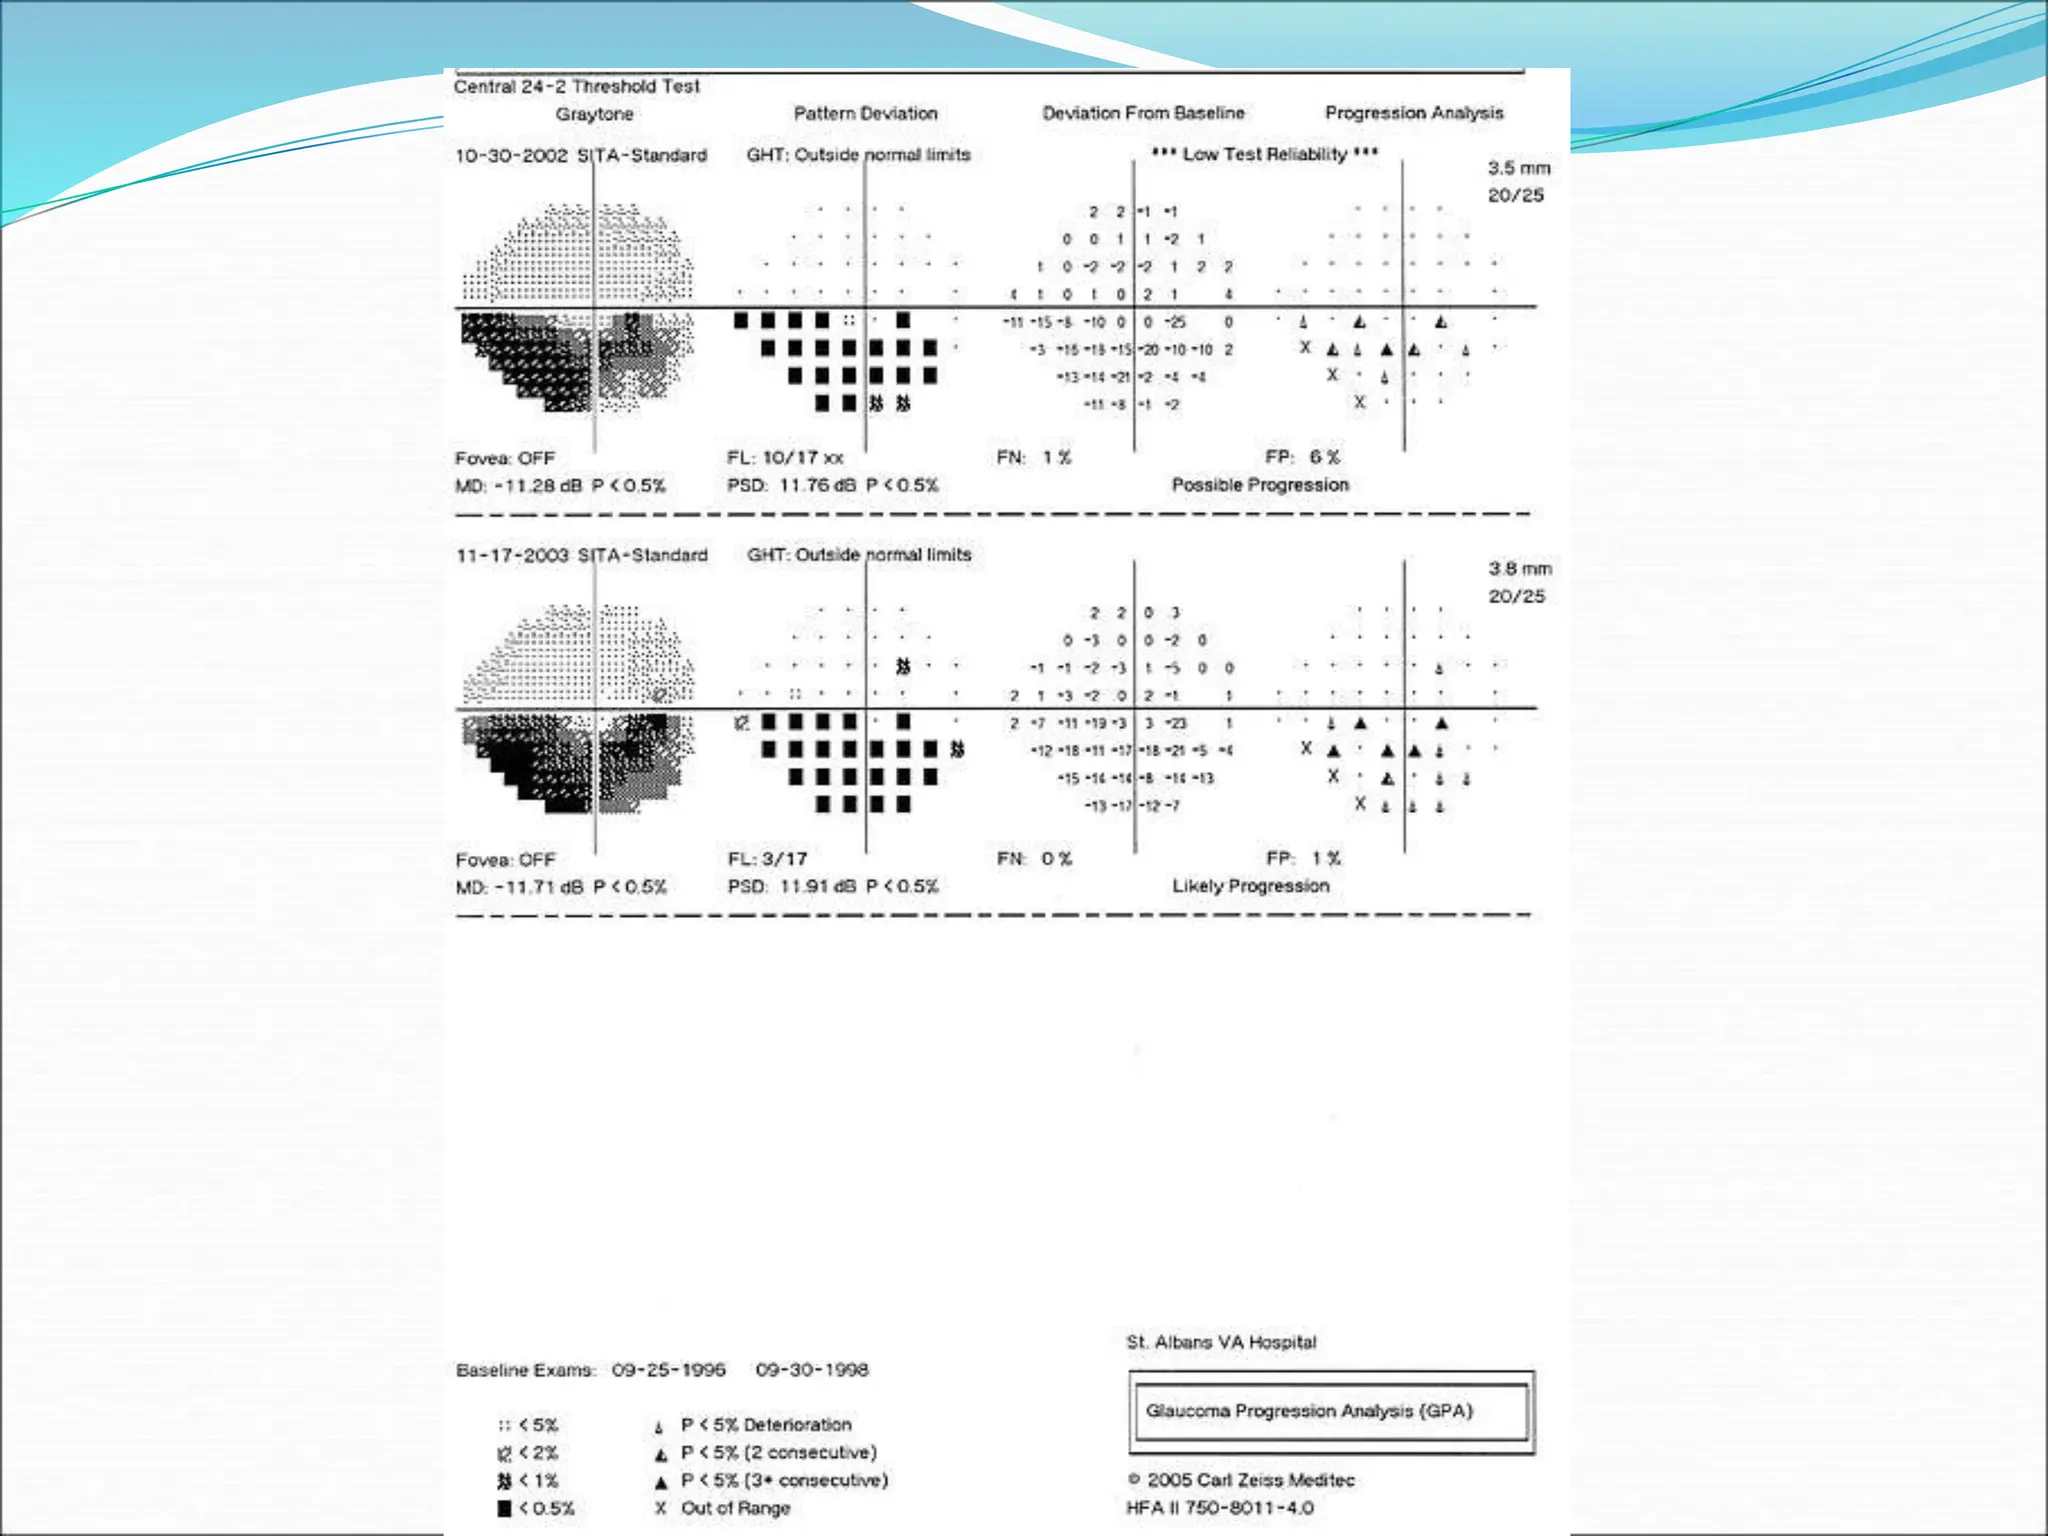
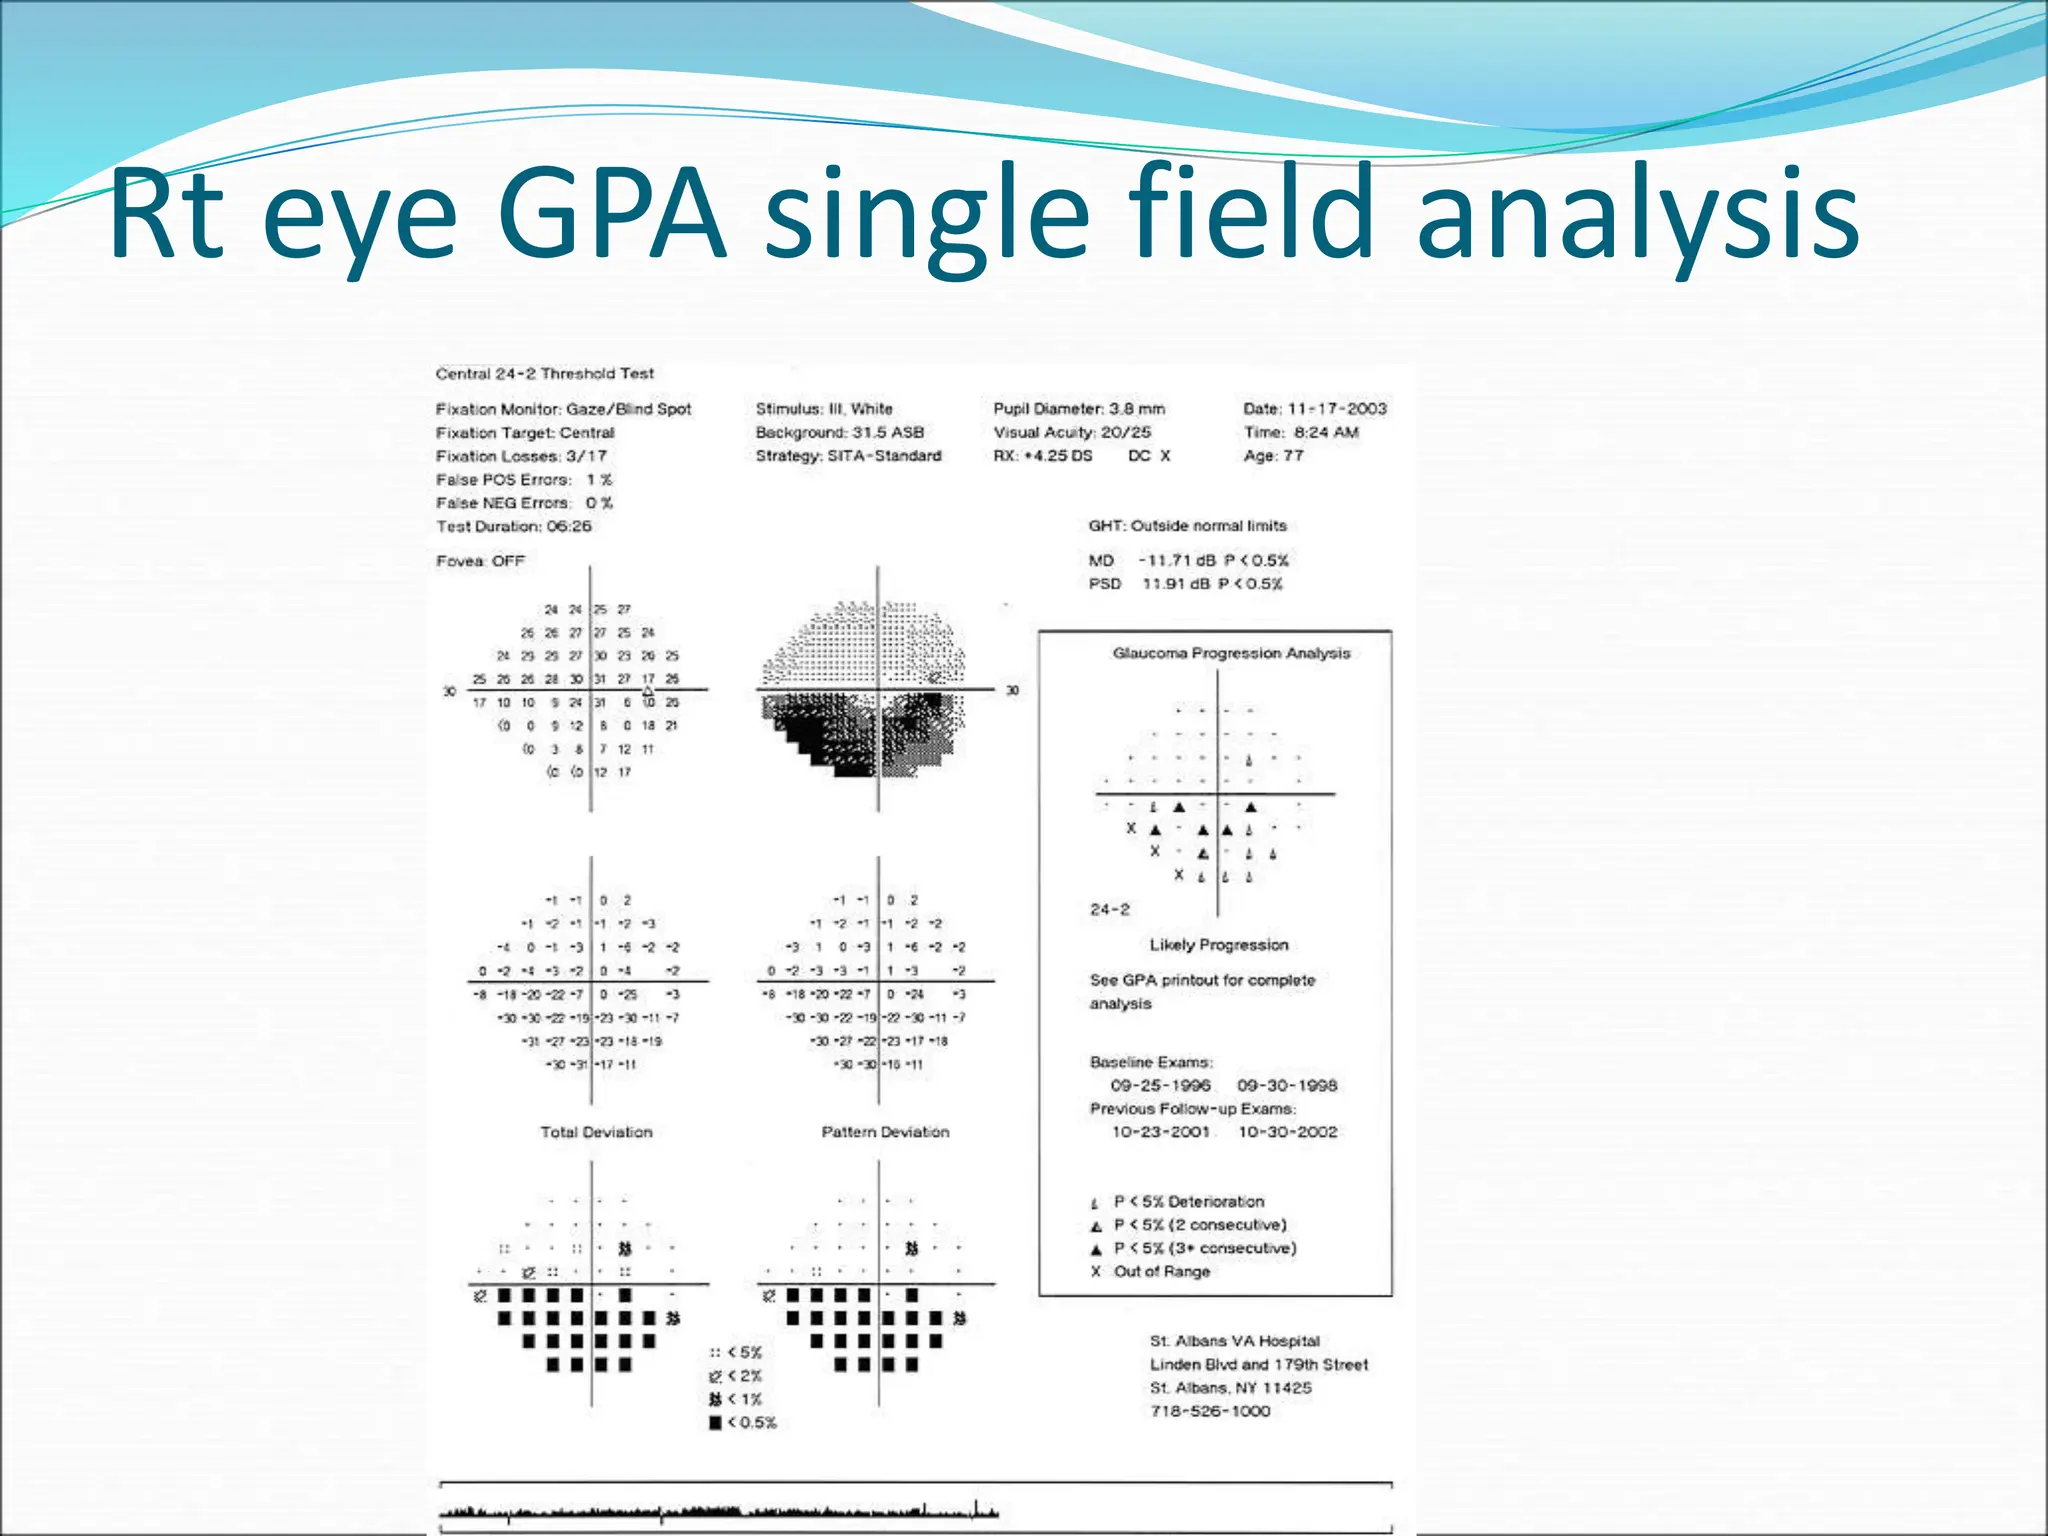
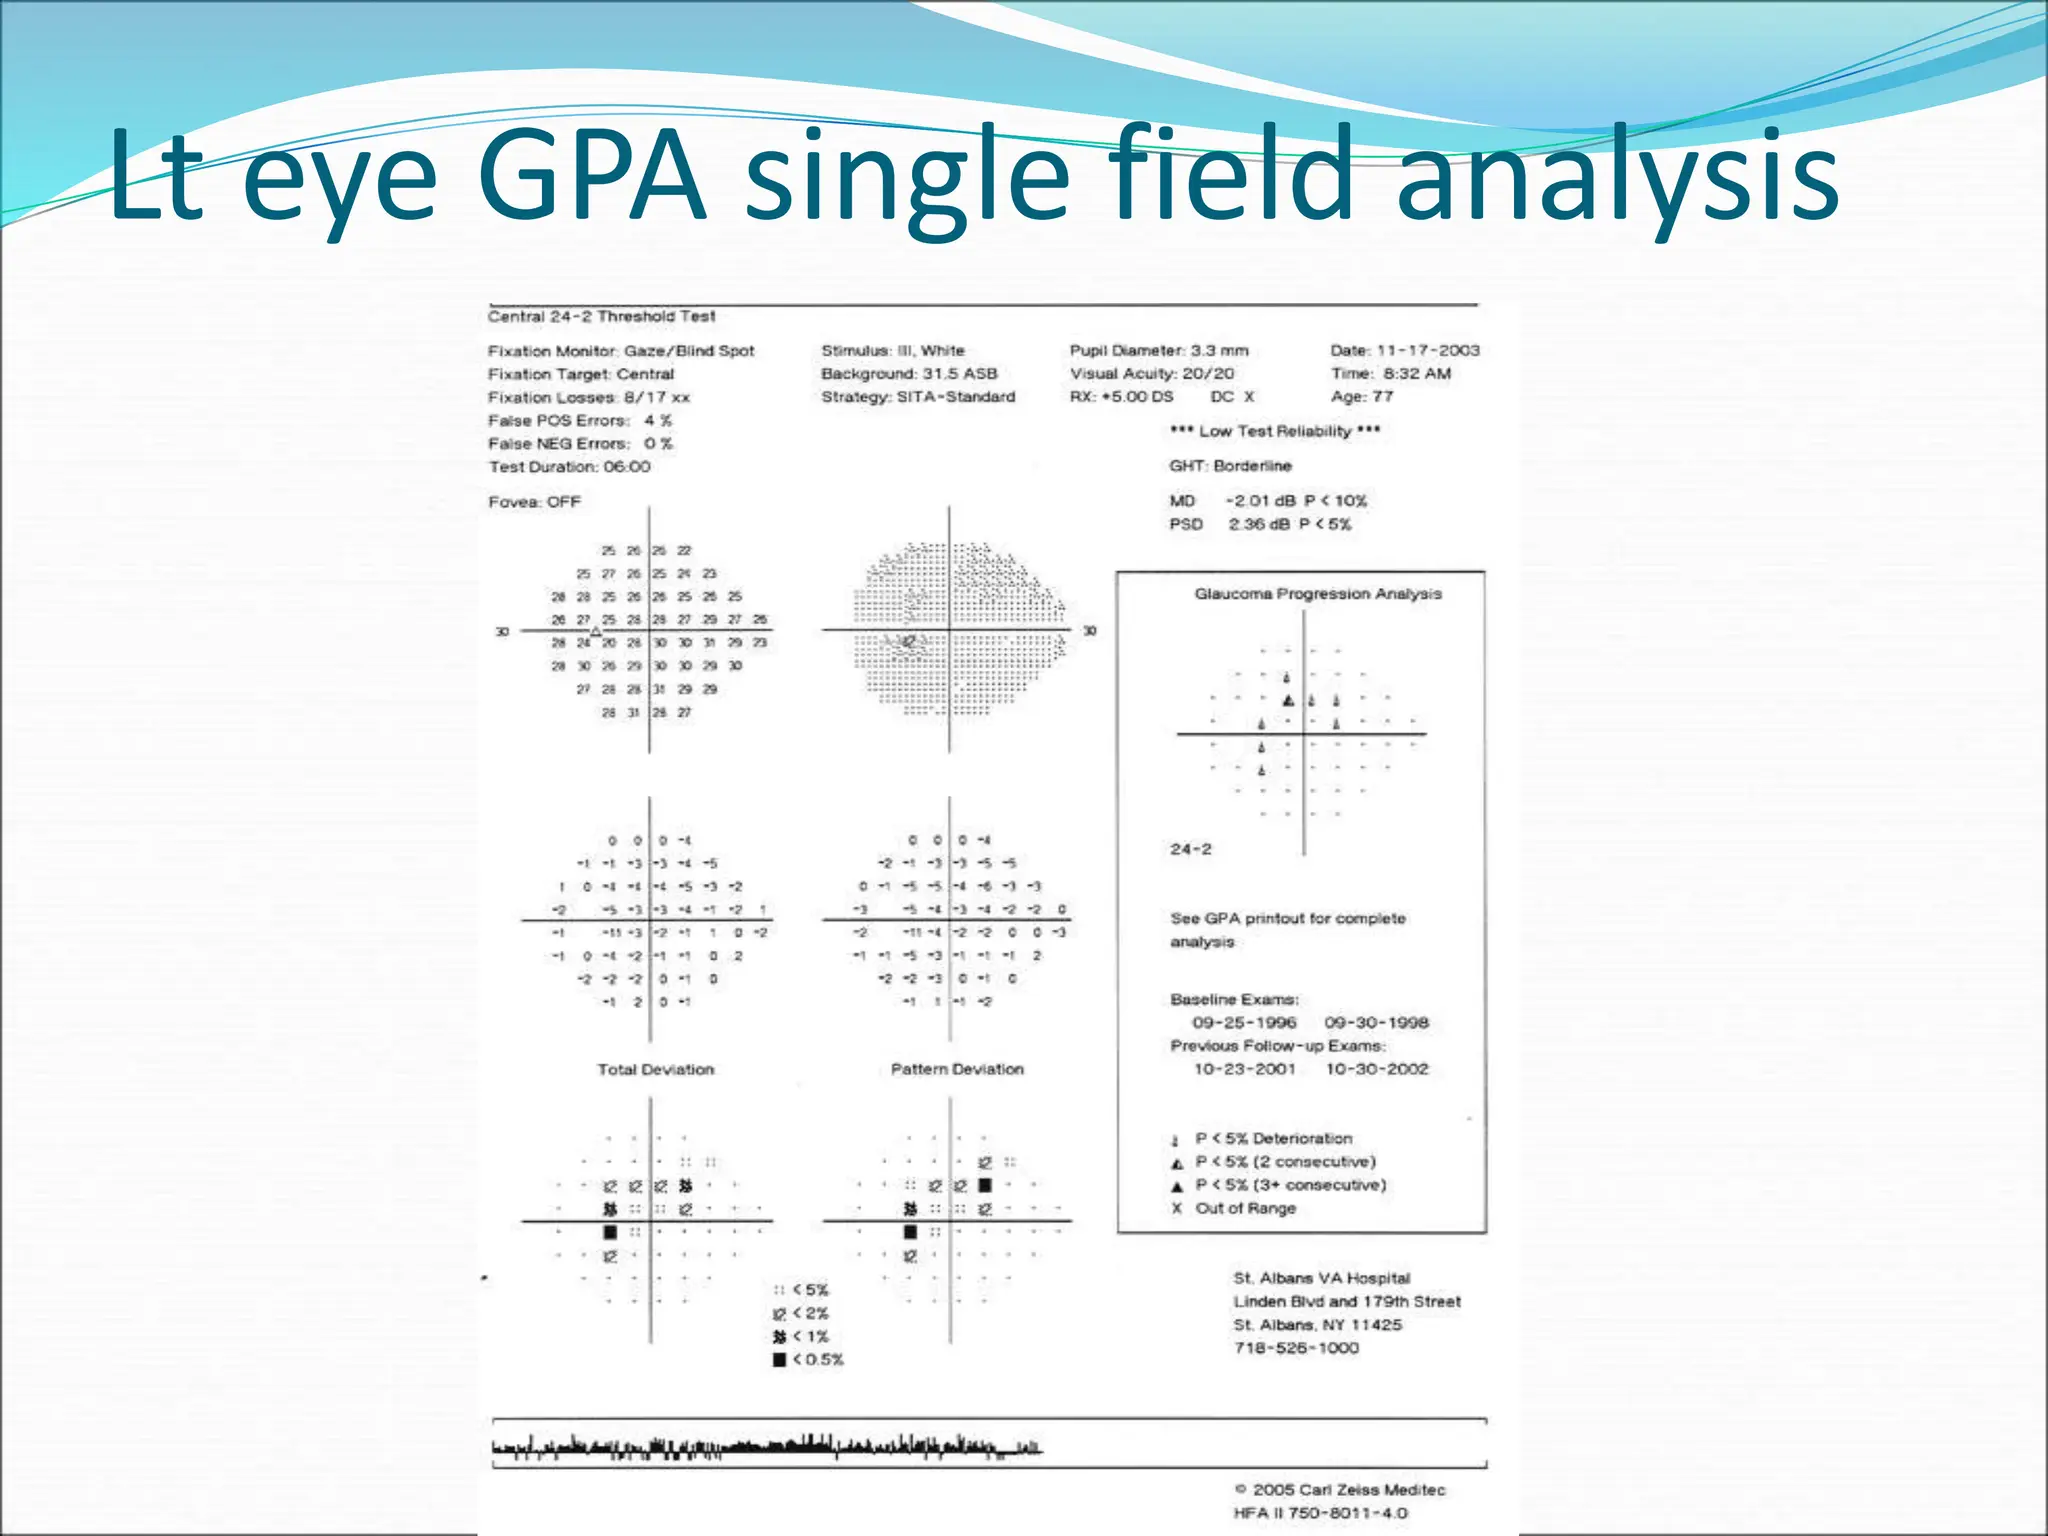
“The ideal glaucoma screening test is portable, easy to operate, highly
sensitive and specific, quick and patient friendly”
Johnson, et al, Glaucoma,2000
Octopus Perimetry Systems
 OCTOPUS Perimetry comprises standard white-on-
white (SAP), blue-on-yellow (SWAP), Flicker (CFF),
manual and automated GOLDMANN kinetic
perimetry.
SEVEN IN ONE GRAPH - OCTOPUS
Octopus Vs HFA
Octopus Global Indices
Octopus Visual Field Defect
HFA Criteria For Field Defect
Patient Data, Strategy and Test
Parameters
Grey Scale
Octopus: Comparision Table
HFA: Total And Pattern Deviation
Progression of a field
 NEW DEFECT:
1. A new cluster of at least 3 non edge abnormal points
arises in a typical location, each with threshold
sensitivities occurring in fewer than 5% of the normal
population(p<5%), and with a sensitivity that occurs in
fewer than 1% of the population (p <1%) at one of the
points
Progression of a field
 DEEPENING OF A PREEXISTING
DEFECT: a defect has deepened or enlarged if 2
or more points within or adjacent to an existing
scotoma have worsened by at least 10dB or 3 times
the average of SF, whichever is larger.
 GENERALIZED DEPRESSION:
1. Decline in MD that is significant at p<1% level OR
2.CPSD showing an obvious trend based on last 5
consecutive fields OR
3.Decline of >3dB at all points on two consecutive
fields.
Procedures used for progression
 Clinical judgment.
 Defect classification systems.
 Trend analyses
 Event analyses
Trend analyses
 Use of linear regression for prediction for prediction of
progress.
 Adv: can determine temporal patterns and have the
potential to detect subtle progressive loss from test
variability.
 Disadv:
1) minimum 7-8 visual fields required for adequate
sensitivity.
2) normal ageing not considered.
Event analyses
 Use of paired t-test to determine whether significant
differences are present between one test result and
another.
 Examples are:
1) DELTA programme on OCTOPUS perimeter.
2) GCP on STATPAC 2 analysis software of HFA.
How to follow up?
 Establish a baseline field/fields
 Two or three successive fields 4 weeks apart that are
reproducible are taken as representative baseline
 In case of severely contracted fields concentrate on the
central 20 or 10 deg with the 10-2 or the macular tests
 Usage of a larger pattern of points. Eg. If the diagnosis
was made with a 24-2 pattern with most points
abnormal,converting to a 30-2 may be helpful
 Usage of a larger size V stimulus in cases with high
visual loss
Change analysis printout
 Provides a visual display of additional descriptive
statistics with large number of examinations on a
single page
 Includes a box plot panel across the top and several
graphs of global indices of a series of examinations
below the panel
 The visual fields are displayed with a regular interval
between them not commensurate with the actual time
scale
The box plot
 The majority of threshold sensitivity estimations are
close to the mid normal value and the deviation is
typically near 0dB (the 50th percentile) point in the
normal field
 For the 30-2 pattern 70% of the points lie between 3dB
and -3dB of the average normal values
 All the rest are expected to fall between 4dB and -6dB
The box plot
Change analysis printout
 For each examination the deviations are determined at
each point, these are the total deviation plot values
 A vertical rectangle represents range of deviation for
70% of all locations
 The mean deviation is marked by a flanked heavy
horizontal bar
 The ends of the vertical bars indicate the total range of
deviations of all the points
Interpreting the box plot for progression
 A short box that remains of the same height but
shifts downwards indicates progressive generalised
depression. Here MD decreases but PSD remains
unaffected
 Lengthening of the box especially in the inferior
arm indicates development and deepening of
localised defects. PSD becomes increasingly
abnormal
 A long box at initial examination that stays the
same length and moves downward indicates
progressive generalized depression superimposed
on a localized defect
The global indices on the C.A.P.
Mean deviation index
 Observe it first
 If almost same in multiple examinations, neither a
generalised depression nor a deep focal defect is
occuring
 Highly variable MD index means examination is not
reproducible
 Steady improvement means learning curve
 Steady downward trend means progressive loss of
fields
Other indices
 The PSD and CPSD increase as scotomas first develop
 Their progressive deterioration is helpful in early field
losses
 As losses become advanced they may stabilise (false
security)
 Here SF tends to increase as variability at abnormal
points increases
Glaucoma change probabilty
 It came into vogue to decide how much of
variability from baseline is normal.
 Patients were repeatedly tested at various stages of
glaucoma over a period of < one month
 It was observed that amount by which the
threshold fluctuates in the absence of progression
is affected by how abnormal the test point initially
is
 On follow up we determine how unlikely it is that
the obtained value at a given location could have
occurred as a random fluctuation
Baseline field
Follow up fields
Follow up field
Follow up fields
Glaucoma progression analysis
 It is an advanced software module that upgrades
STATPAC to assist detection of field defect progression
 Can be used with SITA std, SITA fast and full threshold
algorithms
 The GPA highlights any change from baseline that are
larger than expected clinical variability
 Does not support FASTPAC or central 10-2
GPA print out components
 Looks similar to the routine HVF printout
 Baseline is in the routine overview format
 Follow up print outs include graytone, pattern
deviation plots, deviation from baseline plot and
progression analysis probability plot
Deviation from baseline plot
 The third colomn in the GPA print out
 Compares the PD of the follow up fields with that of
the baseline
 Indicates changes at each tested point in dB notation
Progression analysis probability plot
 Fourth column in the GPA print out
 Gives the statistical significance of the decibel change
shown in the deviation from baseline plot
 Compares changes in the baseline and follow up fields
to the inter test variability typical of stable glaucoma
and shows the plot of points that have changed
significantly
A clinical example
 77 yr old male diagnosed with POAG. The IOP in rt eye
was 28 mm and lt was 26 mm
 CCT were 525 and 523 microns respectively
 He was put on latanoprost both eyes with IOP
reducing to 16-18mm in both eyes
Rt eye field
Left eye field
 He was lost to follow up for 2 yrs during which time he
defaulted on his therapy
 Patient was folloed up on return with pressures of
18mm on latanoprost
Rt eye GPA single field analysis
Lt eye GPA single field analysis
 J Glaucoma. 2006 Jun;15(3):206-12
Keratometry, optic disc dimensions, and
degree and progression of glaucomatous optic
nerve damage.
Jonas JB, Stroux A, Martus P, Budde W.
Large optic disc area is statistically significantly,
but clinically weakly, correlated with low
keratometric readings (diopters).
 Invest Ophthalmol Vis Sci. 2005 Apr;46(4):1269-74
Central corneal thickness correlated with glaucoma
damage and rate of progression.
Jonas JB, Stroux A, Velten I, Juenemann A, Martus P,
Budde WM.
At the time of patient referral, the amount of
glaucomatous optic nerve damage correlated significantly
with a thin central cornea. Progression of glaucomatous
optic nerve neuropathy was independent of central corneal
thickness, suggesting that central corneal thickness may
not play a major role in the pathogenesis of progressive
glaucomatous optic nerve damage.
 Graefes Arch Clin Exp Ophthalmol. 2005 Aug;243(8):741-7. Epub 2005
Feb 8
Progression of visual field defects and visual loss in
trabeculectomized eyes.
Ehrnrooth P, Puska P, Lehto I, Laatikainen L.
Progression of VF defects and development of visual impairment due
to glaucoma was fairly common despite trabeculectomy. Both were
associated with severity of initial VF defect. In this series, no significant
correlation appeared between defect progression and the last IOP, but
association between stability of VF and the amount of IOP reduction
after surgery indicate that a lower target IOP level particularly in eyes
with initially severe VF defect would, however, be needed.
 Ophthalmology. 2004 Nov;111(11):2117-25.
Statistical evaluation of the diagnostic accuracy of
methods used to determine the progression of visual
field defects in glaucoma.
Mayama C, Araie M, Suzuki Y, Ishida K, Yamamoto T,
Kitazawa Y, Shirakashi M, Abe H, Tsukamoto H,
Mishima HK, Yoshimura K, Ohashi Y.
Most of the methods using the TD slope were
characterized by high sensitivity, the AGIS method had a
very high specificity, and those using VF sectors had
reasonable sensitivity and specificity.
 Ophthalmology. 2002 May;109(5):1009-17.
Short wavelength automated perimetry, frequency doubling
technology perimetry, and pattern electroretinography for
prediction of progressive glaucomatous standard visual field
defects.
Bayer AU, Erb C
All three tests (SWAP, FDT, and PERG) have been successful in
detecting glaucoma eyes with a future progression of standard visual
field defects. A test battery of SWAP and PERG P1N2-amplitude
improved the power to predict these progressive defects on SAP. It
remains to be seen whether the long-term follow-up in POAG eyes will
improve the false-positive rate of SWAP and FDT.
Newer techniques-Need
To identify glaucomatous damage prior to
conventional white-on-white perimetry
Because traditional Automated Perimetry will
not reveal a scotoma until 25-40 % of nerve
fibers are damaged
Motion attributes of vision are involved early in
glaucoma and not picked up by conventional
perimetry
Newer Perimetry Techniques
Short wave automated perimetry (S.W.A.P)
High pass resolution perimetry (H.P.R.P)
Frequency doubling perimetry (F.D.P)
Flicker perimetry
Motion perimetry
Detection and resolution perimetry
L-cones
M-cones
S-cones
Rods
Visual
Processing
P-Cells
K-Cells
M-Cells
Visual Acuity
HRP
Flicker
Motion
FDP
B Y
Swap
Short Wave Automated Perimetry
Developed by Stiles
 Also called Blue on yellow perimetry
Software incorporated into Humphrey’s Field
Analyser II (30-2, 24-2 programs)
Intense yellow background with blue stimulus
S.W.A.P.
The Principle:
Concept of reduced redundancy
Stimulate one color-vision mechanism
Large blue target stimulate short wave sensitive
mechanism
Isolate the short–wave sensitive pathways
S.W.A.P
Salient Features:
Stimulus Goldman size V,blue light (440 nm),
200 ms duration
Background- 100 cd/m2 intensity yellow light
(500-700 nm)
Instrumentation and software same as W-W-
perimetry
S.W.A.P.
Advantages
 Detect glaucomatous visual field loss prior to
conventional white-on-white (W-W) perimetry
(3-5 yrs in advance)
Predict future visual feid defects for standard
W-W
More rapid glaucomatous progression seen,
earlier
Correlate well with early optic nerve head
changes
S.W.A.P
Advantages:
SWAP shown more extensive visual field loss
than W-W perimetry in optic neuritis and in
diabetic macula oedema( blue cones are more
susceptible to damage in diabetes)
 SWAP pathway deficits precede luminance
pathway deficits in age-related maculopathy,
central serous choroidopathy and retinitis
pigmentosa.
Progressive glaucomatous loss on HFA ® and Swap (L)
S.W.A.P
Disadvantages:
Affected by absorption of short wavelength
stimuli by the aging lens
Influenced by macular pigment absorption
causing a depression in the foveal peak
Takes approx 15% longer than W-W perimetry ,
30-2 using the Full Threshold strategy and
approx 17% with the FASTPAC strategy
Between-subject normal variability is greater
for SWAP than for conventional perimetry
Principle
 M-cell neuron sub-set comprising a third to a half of
the M-cell neurons (called "non-linear" My-cells) are
first involed in glaucoma, basis for frequency doubling
testing(25%)
When a low spatial frequency sinusoidal grating with
alternating wide light and dark bars undergoes high
temporal-frequency counter phase flicker, (i.e., the
black bands reverse to become white and the white
bands reverse to become become black in rapid
sequence) gratings appear twice as many light/dark
bars (spatial frequency appears doubled) called the
“frequency doubling illusion”
High frequency (e.g., 20-30 Hz) alternation between
light and dark bars (e.g., 1 cycle per degree) shown on
the left two images creates the doubling illusion (2
cycles per degree grating) shown on the right image.
(One cycle = light + dark bar.)
Non-linear M-cell neurons transmit signals related to
this illusion. These neurons are the first involved in
glaucoma, tests presenting alternate grating stimuli
attempt to identify neuron loss earlier
Salient Features
FDT perimetry tolerates up to 6 D of refractive
error
Not affected by external room illumination
Not affected by variations in the pupil size,the
pupil diameter should be greater than 2 mm
Instructions to the patient are also quite simple:
look at a black dot in the center of the screen
and press a button any time a grating pattern is
seen
A 10-degree square pattern is presented at 17
different locations within the central 20 * 20
degrees visual field
Test options include a a screening field
(Screening C-20-1) in which 5-degree gratings
with three contrast levels are show at 17 locations
in the central 20 degree field
FDT screening mode perimetry is considered
abnormal when the following are present:
Any defect in the central five locations
Two mild or moderate defects in the
outer 12 squares
One severe defect in the outer 12 squares
Screening test time greater than 90 seconds
per eye
FDT screening mode perimetry
C-20 and N-30 for FDT Perimetry
N-30 FULL THRESHOLD R/E Glaucoma
Screening 20-1
Glaucoma---R/E
Full threshold
N-30
B/E Normal
Study
Two full threshold test options: Full Threshold N-20 and Full Threshold N-30. Each
grating is 5 degrees square, but in the N-30 test the horizontal area tested is extended to
include an extra portion of the nasal visual field, resulting in a total 30 degree horizontal
field.
FDT perimeter uses central static fixation with classic Heijl-Krakau (blind spot) fixation
checks
Defects are noted as varied gray scale depths called probability symbols
The darker the depth of gray, the less probable (based on age-related norms) that the
defect is a normal occurrence, probability varies from 5% (somewhat unlikely that the
defect is normal) to <0.5% (very unlikely that the defect is normal).
Reliability indices (fixation errors, false positive errors, and false negative errors) are
provided, as well as Mean Deviation (average deviation from a normal visual field based on
age-related norm) and Pattern Standard Deviation Indices (a measure of how locations
differ from each other in the overall field) for the threshold tests, similar to the indices
provided with traditional automated threshold perimetry statistical analyses.
Commercially available versions are being produced by Humphrey and Welch Allyn
F.D.P.
Advantages:
Short test duration( 4-5 min for full threshold)
Not affected by blur upto 6 D
Not affected by pupil size
Minimal training required
 An example of a
superior arcuate deficit
for Frequency
Doubling Technology
(FDT) perimetry in
comparison to the
results obtained for
standard automated
perimetry with the
Humphrey Field
Analyzer. FDT deficit is
more extensive than
those obtained with
standard automated
perimetry.
Humphrey Matrix FDT
 Using the
24-2 test
presentation
pattern, the
Humphrey
Matrix
yielded
these results
for the left
eye of the
same patient
High-Pass Resolution
Perimetry
HPRP
Principle
Ring-shaped stimuli are presented on a
computer screen
The inner and outer borders of the ring are
darker, and the area between is lighter, than the
background. the average contrast of the
stimulus is identical to that of the background,
and is maintained at a constant level while
stimulus size is altered
The computer generated stimuli are "high pass
filtered"; that is, all low spatial frequency
information is removed
The thresholds for the detection of an object as
present and for recognition of what it is become
simultaneous-if the target cannot be
recognized, it will not even be seen
Stimulus design is thus chosen because it
corresponds to center-surround arrangement of
retinal ganglions receptive field
HRP
Salient Features
Test available in Ophthimus (High Tech Vision)
14 target sizes in 1 db steps are available
Parameters obtained are Global deviation,
Local deviation, neural capacity index, etc
The Ophthimus provides global indices and
statistical analyses conceptually similar to those
produced by the Humphrey. In addition, the
Ophthimus provides, as a unique parameter, the
estimated neural capacity
Ring Stimulus used in HRP
Ophthimus provides a printout that includes
the ring target sizes seen graphically as well as
data about the overall deviation and fluctuation
of the responses
Subject reliability is also assessed
Central 30 degrees visual field is examined, 50
locations tested
 Adapts automatically to the patient´s reaction
time as well to responses to fixation control
tests and "blank" and "catch" targets
The patient can, at any time, request a pause
Superior Field Defect on HRP
HRP
Advantages
Quicker examination (5 min duration)
Excellent test-retest reliability
Earlier detection of progression
Continuous feedback helps to improve
concentration
HRP
Advantages:
Early detection and monitoring of glaucomatous
damage
Useful for neurophthalmologic conditions
HRP
Disadvantages
Limited commercial distribution and
representation
Requires near correction of 6D greater than
patients distance correction , special trial lens
needed
Use of ring targets makes it difficult to show the
linear nature of defects such as a hemianopia
that respects the vertical midline or a nerve
fiber layer defect that splits fixation
The exact location and dimensions of the blind
spot are not delineated, this is rarely a
significant problem
Normal Examination ----Right eye
Glaucoma-------Right eye
Flicker Perimetry
Principle
Detection of rapidly flickering stimuli depends
on the magnocellular mechanisms( M-cells)
Tyler suggested that deficits in flicker
sensitivity (for high temporal freq) was lost
early in glaucoma and ocular hypertensives
Three different methods are employed for
flicker perimetry- (a) contrast modulation
flicker, (b) critical flicker fusion, and (c)
luminance pedestal flicker for sinusoidal
temporal stimulus modulation.
Salient Features
Employs light emitting diodes
Uniform background of 50 cd
Stimuli are briefly flickered, patient is asked to
respond if flicker detected
Temporal frequency of flicker is varied to
determine highest rate at which it is detected
(CFF, critical flicker fusion)
Flicker perimetry frequency and contrast
Flicker Perimetry
Advantages:
Normal aging appear later than in HFA
More resistant to optical degradation (from Blur,
cataract, etc)
Flicker Perimetry
Disadvantages:
Still experimental
Lack of standardization
Not too patient- friendly
 The connection between
the CFFF and the
luminous threshold in
Glaucoma patients and
in patients with retinal
detachement. As one
would expect, the CFFF
shows large deviations
in early Glaucoma
compared to standard
perimetry while the
relation of the two
methods in retinal
detachment is more
linear.
Motion Perimetry
Principle:
M-cells and large neurons may be damaged
early in glaucoma leading to degradation in
motion perception
Involves detection of direction of motion of
small dot / line stimulus
Detects the min displacement required to
detect movement (Motion displacement
thresholds are found elevated in pt at risk of
glaucoma with normal visual fields)
Another technique for motion perimetry uses
random pattern of light and dark dots, ‘snow
pattern’, this portion is than moved in a
particular direction, pt detects the direction of
movement
Minimum percentage of dots (coherence)
needed to detect the direction is determined
The central 21 degrees of the visual field are
tested
To complete a testtakes 3-8 minutes
Moving stimuli are vertical barsas described in
detail by Fitzke et al
Test randomly examines 16 locations with one
displacement distance (amplitude) and then
the procedureis repeated five times
Motion sensitivity score are based on the
percentage of response from a total of
84 movements over 14 locations (excluding two
close points to the blind spot)
Stimulus used for random dot coherence perimetry
Motion perimetry shows an inferior nasal nerve fiber bundle defect not present on
conventional automated or luminance size threshold perimetry
RareBit Perimetry (RBP)
 RareBit Perimetry depends
on minute stimuli ("rare"
bits or "microdots") and it
replaces the conventional
thresholding approach with
simple checks for the
presence of function
White Noise Field Campimetry
(Aulhorn's snow field campimetry)
 White noise field campimetry – also called snowfield
campimetry – is a method directly visualizing
scotomas, thus enabling patients to immediately
detect and interactively describe their visual field
defects (VFDs).
 Scotomas are usually described as “clouds”, which are
differentiated from the surrounding normal noise field
by an apparent change in brightness perception and /
or change in noise perception.
 Typical finding in glaucomatous visual
field loss.
 Top: Conventional, automated
threshold-related slightly supraliminal
static perimetry (30° Tuebigen
Automated Perimeter), showing an
inferior arcuate nerve fiber bunde defect
 Bottom: Corresponding result of white
noise field campimetry. According to
the description of the patient the noise
field defect is described as a “cloud”,
which is darker than the surrounding
normal snowfield and characterised by a
reduced apparent movement of the dots
within this area
Multifocal Visual Evoked Potential
 There are two multifocal techniques that are presently
being used, the multifocal electroretinogram
(mfERG),which measures the local electrical responses
of the retina throughout the central (26 degrees
radius) visual field and the multifocal visual evoked
potential (mfVEP), which measures the localized
electrical responses from the primary visual portion of
the brain (occipital cortex) for the central (26 degree
radius) visual field
 Example of
correspondence of
visually evoked
potential perimetry
with standard
automated
perimetry in a
glaucoma patient
with a superior
paracentral arcuate
defect
Test Merit Pt
friendl
Learn Admin
-istrati
Stand
-ardis
Varia-
bility
HFA N/A No Yes Yes Yes No
SWAP YES No Yes Yes Yes No
HRP NO Yes Min Yes No Yes
FDP NO Yes Min Yes Yes Yes
Motio
n
NO - Yes Yes No No
Flicke
r
YES No Yes Yes No No
How the tests measure up?

Perimetry is the technique of evaluating the Visual field .

  • 1.
    “The ideal glaucomascreening test is portable, easy to operate, highly sensitive and specific, quick and patient friendly” Johnson, et al, Glaucoma,2000
  • 2.
    Octopus Perimetry Systems OCTOPUS Perimetry comprises standard white-on- white (SAP), blue-on-yellow (SWAP), Flicker (CFF), manual and automated GOLDMANN kinetic perimetry.
  • 4.
    SEVEN IN ONEGRAPH - OCTOPUS
  • 7.
  • 9.
  • 10.
  • 11.
    HFA Criteria ForField Defect
  • 13.
    Patient Data, Strategyand Test Parameters
  • 14.
  • 15.
  • 16.
    HFA: Total AndPattern Deviation
  • 17.
    Progression of afield  NEW DEFECT: 1. A new cluster of at least 3 non edge abnormal points arises in a typical location, each with threshold sensitivities occurring in fewer than 5% of the normal population(p<5%), and with a sensitivity that occurs in fewer than 1% of the population (p <1%) at one of the points
  • 18.
    Progression of afield  DEEPENING OF A PREEXISTING DEFECT: a defect has deepened or enlarged if 2 or more points within or adjacent to an existing scotoma have worsened by at least 10dB or 3 times the average of SF, whichever is larger.  GENERALIZED DEPRESSION: 1. Decline in MD that is significant at p<1% level OR 2.CPSD showing an obvious trend based on last 5 consecutive fields OR 3.Decline of >3dB at all points on two consecutive fields.
  • 19.
    Procedures used forprogression  Clinical judgment.  Defect classification systems.  Trend analyses  Event analyses
  • 20.
    Trend analyses  Useof linear regression for prediction for prediction of progress.  Adv: can determine temporal patterns and have the potential to detect subtle progressive loss from test variability.  Disadv: 1) minimum 7-8 visual fields required for adequate sensitivity. 2) normal ageing not considered.
  • 21.
    Event analyses  Useof paired t-test to determine whether significant differences are present between one test result and another.  Examples are: 1) DELTA programme on OCTOPUS perimeter. 2) GCP on STATPAC 2 analysis software of HFA.
  • 22.
    How to followup?  Establish a baseline field/fields  Two or three successive fields 4 weeks apart that are reproducible are taken as representative baseline  In case of severely contracted fields concentrate on the central 20 or 10 deg with the 10-2 or the macular tests  Usage of a larger pattern of points. Eg. If the diagnosis was made with a 24-2 pattern with most points abnormal,converting to a 30-2 may be helpful  Usage of a larger size V stimulus in cases with high visual loss
  • 23.
    Change analysis printout Provides a visual display of additional descriptive statistics with large number of examinations on a single page  Includes a box plot panel across the top and several graphs of global indices of a series of examinations below the panel  The visual fields are displayed with a regular interval between them not commensurate with the actual time scale
  • 24.
    The box plot The majority of threshold sensitivity estimations are close to the mid normal value and the deviation is typically near 0dB (the 50th percentile) point in the normal field  For the 30-2 pattern 70% of the points lie between 3dB and -3dB of the average normal values  All the rest are expected to fall between 4dB and -6dB
  • 25.
  • 26.
    Change analysis printout For each examination the deviations are determined at each point, these are the total deviation plot values  A vertical rectangle represents range of deviation for 70% of all locations  The mean deviation is marked by a flanked heavy horizontal bar  The ends of the vertical bars indicate the total range of deviations of all the points
  • 27.
    Interpreting the boxplot for progression  A short box that remains of the same height but shifts downwards indicates progressive generalised depression. Here MD decreases but PSD remains unaffected  Lengthening of the box especially in the inferior arm indicates development and deepening of localised defects. PSD becomes increasingly abnormal  A long box at initial examination that stays the same length and moves downward indicates progressive generalized depression superimposed on a localized defect
  • 28.
    The global indiceson the C.A.P.
  • 29.
    Mean deviation index Observe it first  If almost same in multiple examinations, neither a generalised depression nor a deep focal defect is occuring  Highly variable MD index means examination is not reproducible  Steady improvement means learning curve  Steady downward trend means progressive loss of fields
  • 30.
    Other indices  ThePSD and CPSD increase as scotomas first develop  Their progressive deterioration is helpful in early field losses  As losses become advanced they may stabilise (false security)  Here SF tends to increase as variability at abnormal points increases
  • 31.
    Glaucoma change probabilty It came into vogue to decide how much of variability from baseline is normal.  Patients were repeatedly tested at various stages of glaucoma over a period of < one month  It was observed that amount by which the threshold fluctuates in the absence of progression is affected by how abnormal the test point initially is  On follow up we determine how unlikely it is that the obtained value at a given location could have occurred as a random fluctuation
  • 32.
  • 33.
  • 34.
  • 35.
  • 36.
    Glaucoma progression analysis It is an advanced software module that upgrades STATPAC to assist detection of field defect progression  Can be used with SITA std, SITA fast and full threshold algorithms  The GPA highlights any change from baseline that are larger than expected clinical variability  Does not support FASTPAC or central 10-2
  • 37.
    GPA print outcomponents  Looks similar to the routine HVF printout  Baseline is in the routine overview format  Follow up print outs include graytone, pattern deviation plots, deviation from baseline plot and progression analysis probability plot
  • 38.
    Deviation from baselineplot  The third colomn in the GPA print out  Compares the PD of the follow up fields with that of the baseline  Indicates changes at each tested point in dB notation
  • 39.
    Progression analysis probabilityplot  Fourth column in the GPA print out  Gives the statistical significance of the decibel change shown in the deviation from baseline plot  Compares changes in the baseline and follow up fields to the inter test variability typical of stable glaucoma and shows the plot of points that have changed significantly
  • 44.
    A clinical example 77 yr old male diagnosed with POAG. The IOP in rt eye was 28 mm and lt was 26 mm  CCT were 525 and 523 microns respectively  He was put on latanoprost both eyes with IOP reducing to 16-18mm in both eyes
  • 46.
  • 47.
  • 48.
     He waslost to follow up for 2 yrs during which time he defaulted on his therapy  Patient was folloed up on return with pressures of 18mm on latanoprost
  • 51.
    Rt eye GPAsingle field analysis
  • 52.
    Lt eye GPAsingle field analysis
  • 53.
     J Glaucoma.2006 Jun;15(3):206-12 Keratometry, optic disc dimensions, and degree and progression of glaucomatous optic nerve damage. Jonas JB, Stroux A, Martus P, Budde W. Large optic disc area is statistically significantly, but clinically weakly, correlated with low keratometric readings (diopters).
  • 54.
     Invest OphthalmolVis Sci. 2005 Apr;46(4):1269-74 Central corneal thickness correlated with glaucoma damage and rate of progression. Jonas JB, Stroux A, Velten I, Juenemann A, Martus P, Budde WM. At the time of patient referral, the amount of glaucomatous optic nerve damage correlated significantly with a thin central cornea. Progression of glaucomatous optic nerve neuropathy was independent of central corneal thickness, suggesting that central corneal thickness may not play a major role in the pathogenesis of progressive glaucomatous optic nerve damage.
  • 55.
     Graefes ArchClin Exp Ophthalmol. 2005 Aug;243(8):741-7. Epub 2005 Feb 8 Progression of visual field defects and visual loss in trabeculectomized eyes. Ehrnrooth P, Puska P, Lehto I, Laatikainen L. Progression of VF defects and development of visual impairment due to glaucoma was fairly common despite trabeculectomy. Both were associated with severity of initial VF defect. In this series, no significant correlation appeared between defect progression and the last IOP, but association between stability of VF and the amount of IOP reduction after surgery indicate that a lower target IOP level particularly in eyes with initially severe VF defect would, however, be needed.
  • 56.
     Ophthalmology. 2004Nov;111(11):2117-25. Statistical evaluation of the diagnostic accuracy of methods used to determine the progression of visual field defects in glaucoma. Mayama C, Araie M, Suzuki Y, Ishida K, Yamamoto T, Kitazawa Y, Shirakashi M, Abe H, Tsukamoto H, Mishima HK, Yoshimura K, Ohashi Y. Most of the methods using the TD slope were characterized by high sensitivity, the AGIS method had a very high specificity, and those using VF sectors had reasonable sensitivity and specificity.
  • 57.
     Ophthalmology. 2002May;109(5):1009-17. Short wavelength automated perimetry, frequency doubling technology perimetry, and pattern electroretinography for prediction of progressive glaucomatous standard visual field defects. Bayer AU, Erb C All three tests (SWAP, FDT, and PERG) have been successful in detecting glaucoma eyes with a future progression of standard visual field defects. A test battery of SWAP and PERG P1N2-amplitude improved the power to predict these progressive defects on SAP. It remains to be seen whether the long-term follow-up in POAG eyes will improve the false-positive rate of SWAP and FDT.
  • 58.
    Newer techniques-Need To identifyglaucomatous damage prior to conventional white-on-white perimetry Because traditional Automated Perimetry will not reveal a scotoma until 25-40 % of nerve fibers are damaged Motion attributes of vision are involved early in glaucoma and not picked up by conventional perimetry
  • 59.
    Newer Perimetry Techniques Shortwave automated perimetry (S.W.A.P) High pass resolution perimetry (H.P.R.P) Frequency doubling perimetry (F.D.P) Flicker perimetry Motion perimetry Detection and resolution perimetry
  • 60.
  • 62.
    Short Wave AutomatedPerimetry Developed by Stiles  Also called Blue on yellow perimetry Software incorporated into Humphrey’s Field Analyser II (30-2, 24-2 programs) Intense yellow background with blue stimulus
  • 63.
    S.W.A.P. The Principle: Concept ofreduced redundancy Stimulate one color-vision mechanism Large blue target stimulate short wave sensitive mechanism Isolate the short–wave sensitive pathways
  • 64.
    S.W.A.P Salient Features: Stimulus Goldmansize V,blue light (440 nm), 200 ms duration Background- 100 cd/m2 intensity yellow light (500-700 nm) Instrumentation and software same as W-W- perimetry
  • 66.
    S.W.A.P. Advantages  Detect glaucomatousvisual field loss prior to conventional white-on-white (W-W) perimetry (3-5 yrs in advance) Predict future visual feid defects for standard W-W More rapid glaucomatous progression seen, earlier Correlate well with early optic nerve head changes
  • 67.
    S.W.A.P Advantages: SWAP shown moreextensive visual field loss than W-W perimetry in optic neuritis and in diabetic macula oedema( blue cones are more susceptible to damage in diabetes)  SWAP pathway deficits precede luminance pathway deficits in age-related maculopathy, central serous choroidopathy and retinitis pigmentosa.
  • 68.
    Progressive glaucomatous losson HFA ® and Swap (L)
  • 69.
    S.W.A.P Disadvantages: Affected by absorptionof short wavelength stimuli by the aging lens Influenced by macular pigment absorption causing a depression in the foveal peak Takes approx 15% longer than W-W perimetry , 30-2 using the Full Threshold strategy and approx 17% with the FASTPAC strategy Between-subject normal variability is greater for SWAP than for conventional perimetry
  • 71.
    Principle  M-cell neuronsub-set comprising a third to a half of the M-cell neurons (called "non-linear" My-cells) are first involed in glaucoma, basis for frequency doubling testing(25%) When a low spatial frequency sinusoidal grating with alternating wide light and dark bars undergoes high temporal-frequency counter phase flicker, (i.e., the black bands reverse to become white and the white bands reverse to become become black in rapid sequence) gratings appear twice as many light/dark bars (spatial frequency appears doubled) called the “frequency doubling illusion”
  • 72.
    High frequency (e.g.,20-30 Hz) alternation between light and dark bars (e.g., 1 cycle per degree) shown on the left two images creates the doubling illusion (2 cycles per degree grating) shown on the right image. (One cycle = light + dark bar.)
  • 74.
    Non-linear M-cell neuronstransmit signals related to this illusion. These neurons are the first involved in glaucoma, tests presenting alternate grating stimuli attempt to identify neuron loss earlier
  • 75.
    Salient Features FDT perimetrytolerates up to 6 D of refractive error Not affected by external room illumination Not affected by variations in the pupil size,the pupil diameter should be greater than 2 mm Instructions to the patient are also quite simple: look at a black dot in the center of the screen and press a button any time a grating pattern is seen A 10-degree square pattern is presented at 17 different locations within the central 20 * 20 degrees visual field
  • 76.
    Test options includea a screening field (Screening C-20-1) in which 5-degree gratings with three contrast levels are show at 17 locations in the central 20 degree field FDT screening mode perimetry is considered abnormal when the following are present: Any defect in the central five locations Two mild or moderate defects in the outer 12 squares One severe defect in the outer 12 squares Screening test time greater than 90 seconds per eye FDT screening mode perimetry
  • 77.
    C-20 and N-30for FDT Perimetry
  • 78.
    N-30 FULL THRESHOLDR/E Glaucoma
  • 79.
  • 81.
  • 82.
    Two full thresholdtest options: Full Threshold N-20 and Full Threshold N-30. Each grating is 5 degrees square, but in the N-30 test the horizontal area tested is extended to include an extra portion of the nasal visual field, resulting in a total 30 degree horizontal field. FDT perimeter uses central static fixation with classic Heijl-Krakau (blind spot) fixation checks Defects are noted as varied gray scale depths called probability symbols The darker the depth of gray, the less probable (based on age-related norms) that the defect is a normal occurrence, probability varies from 5% (somewhat unlikely that the defect is normal) to <0.5% (very unlikely that the defect is normal).
  • 83.
    Reliability indices (fixationerrors, false positive errors, and false negative errors) are provided, as well as Mean Deviation (average deviation from a normal visual field based on age-related norm) and Pattern Standard Deviation Indices (a measure of how locations differ from each other in the overall field) for the threshold tests, similar to the indices provided with traditional automated threshold perimetry statistical analyses. Commercially available versions are being produced by Humphrey and Welch Allyn
  • 84.
    F.D.P. Advantages: Short test duration(4-5 min for full threshold) Not affected by blur upto 6 D Not affected by pupil size Minimal training required
  • 85.
     An exampleof a superior arcuate deficit for Frequency Doubling Technology (FDT) perimetry in comparison to the results obtained for standard automated perimetry with the Humphrey Field Analyzer. FDT deficit is more extensive than those obtained with standard automated perimetry.
  • 86.
    Humphrey Matrix FDT Using the 24-2 test presentation pattern, the Humphrey Matrix yielded these results for the left eye of the same patient
  • 87.
  • 88.
    Principle Ring-shaped stimuli arepresented on a computer screen The inner and outer borders of the ring are darker, and the area between is lighter, than the background. the average contrast of the stimulus is identical to that of the background, and is maintained at a constant level while stimulus size is altered
  • 89.
    The computer generatedstimuli are "high pass filtered"; that is, all low spatial frequency information is removed The thresholds for the detection of an object as present and for recognition of what it is become simultaneous-if the target cannot be recognized, it will not even be seen Stimulus design is thus chosen because it corresponds to center-surround arrangement of retinal ganglions receptive field
  • 90.
    HRP Salient Features Test availablein Ophthimus (High Tech Vision) 14 target sizes in 1 db steps are available Parameters obtained are Global deviation, Local deviation, neural capacity index, etc The Ophthimus provides global indices and statistical analyses conceptually similar to those produced by the Humphrey. In addition, the Ophthimus provides, as a unique parameter, the estimated neural capacity
  • 91.
  • 92.
    Ophthimus provides aprintout that includes the ring target sizes seen graphically as well as data about the overall deviation and fluctuation of the responses Subject reliability is also assessed Central 30 degrees visual field is examined, 50 locations tested  Adapts automatically to the patient´s reaction time as well to responses to fixation control tests and "blank" and "catch" targets The patient can, at any time, request a pause
  • 93.
  • 94.
    HRP Advantages Quicker examination (5min duration) Excellent test-retest reliability Earlier detection of progression Continuous feedback helps to improve concentration
  • 95.
    HRP Advantages: Early detection andmonitoring of glaucomatous damage Useful for neurophthalmologic conditions
  • 96.
    HRP Disadvantages Limited commercial distributionand representation Requires near correction of 6D greater than patients distance correction , special trial lens needed Use of ring targets makes it difficult to show the linear nature of defects such as a hemianopia that respects the vertical midline or a nerve fiber layer defect that splits fixation The exact location and dimensions of the blind spot are not delineated, this is rarely a significant problem
  • 97.
  • 98.
  • 99.
  • 100.
    Principle Detection of rapidlyflickering stimuli depends on the magnocellular mechanisms( M-cells) Tyler suggested that deficits in flicker sensitivity (for high temporal freq) was lost early in glaucoma and ocular hypertensives Three different methods are employed for flicker perimetry- (a) contrast modulation flicker, (b) critical flicker fusion, and (c) luminance pedestal flicker for sinusoidal temporal stimulus modulation.
  • 101.
    Salient Features Employs lightemitting diodes Uniform background of 50 cd Stimuli are briefly flickered, patient is asked to respond if flicker detected Temporal frequency of flicker is varied to determine highest rate at which it is detected (CFF, critical flicker fusion)
  • 102.
  • 103.
    Flicker Perimetry Advantages: Normal agingappear later than in HFA More resistant to optical degradation (from Blur, cataract, etc)
  • 104.
    Flicker Perimetry Disadvantages: Still experimental Lackof standardization Not too patient- friendly
  • 105.
     The connectionbetween the CFFF and the luminous threshold in Glaucoma patients and in patients with retinal detachement. As one would expect, the CFFF shows large deviations in early Glaucoma compared to standard perimetry while the relation of the two methods in retinal detachment is more linear.
  • 106.
    Motion Perimetry Principle: M-cells andlarge neurons may be damaged early in glaucoma leading to degradation in motion perception Involves detection of direction of motion of small dot / line stimulus Detects the min displacement required to detect movement (Motion displacement thresholds are found elevated in pt at risk of glaucoma with normal visual fields)
  • 107.
    Another technique formotion perimetry uses random pattern of light and dark dots, ‘snow pattern’, this portion is than moved in a particular direction, pt detects the direction of movement Minimum percentage of dots (coherence) needed to detect the direction is determined
  • 108.
    The central 21degrees of the visual field are tested To complete a testtakes 3-8 minutes Moving stimuli are vertical barsas described in detail by Fitzke et al Test randomly examines 16 locations with one displacement distance (amplitude) and then the procedureis repeated five times Motion sensitivity score are based on the percentage of response from a total of 84 movements over 14 locations (excluding two close points to the blind spot)
  • 109.
    Stimulus used forrandom dot coherence perimetry
  • 110.
    Motion perimetry showsan inferior nasal nerve fiber bundle defect not present on conventional automated or luminance size threshold perimetry
  • 111.
    RareBit Perimetry (RBP) RareBit Perimetry depends on minute stimuli ("rare" bits or "microdots") and it replaces the conventional thresholding approach with simple checks for the presence of function
  • 113.
    White Noise FieldCampimetry (Aulhorn's snow field campimetry)  White noise field campimetry – also called snowfield campimetry – is a method directly visualizing scotomas, thus enabling patients to immediately detect and interactively describe their visual field defects (VFDs).  Scotomas are usually described as “clouds”, which are differentiated from the surrounding normal noise field by an apparent change in brightness perception and / or change in noise perception.
  • 114.
     Typical findingin glaucomatous visual field loss.  Top: Conventional, automated threshold-related slightly supraliminal static perimetry (30° Tuebigen Automated Perimeter), showing an inferior arcuate nerve fiber bunde defect  Bottom: Corresponding result of white noise field campimetry. According to the description of the patient the noise field defect is described as a “cloud”, which is darker than the surrounding normal snowfield and characterised by a reduced apparent movement of the dots within this area
  • 115.
    Multifocal Visual EvokedPotential  There are two multifocal techniques that are presently being used, the multifocal electroretinogram (mfERG),which measures the local electrical responses of the retina throughout the central (26 degrees radius) visual field and the multifocal visual evoked potential (mfVEP), which measures the localized electrical responses from the primary visual portion of the brain (occipital cortex) for the central (26 degree radius) visual field
  • 116.
     Example of correspondenceof visually evoked potential perimetry with standard automated perimetry in a glaucoma patient with a superior paracentral arcuate defect
  • 117.
    Test Merit Pt friendl LearnAdmin -istrati Stand -ardis Varia- bility HFA N/A No Yes Yes Yes No SWAP YES No Yes Yes Yes No HRP NO Yes Min Yes No Yes FDP NO Yes Min Yes Yes Yes Motio n NO - Yes Yes No No Flicke r YES No Yes Yes No No How the tests measure up?