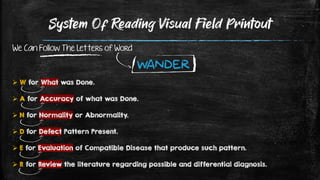
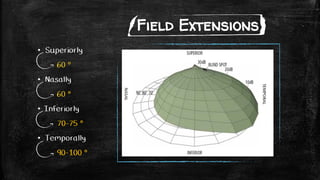
The document discusses how to interpret visual field tests, specifically the Humphrey Visual Field test. It provides details on:
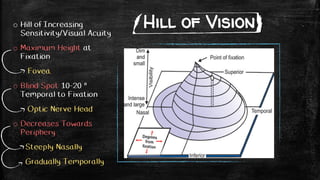
- The anatomy and physiology of the visual field and hill of vision.
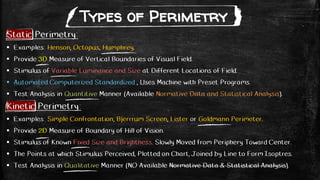
- Types of perimetry tests including static, kinetic, threshold, and supra-threshold tests.
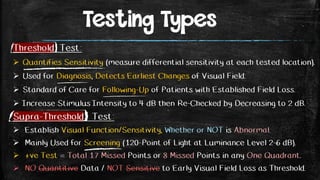
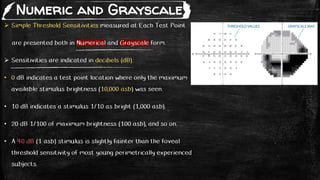
- Components and procedures of Humphrey Visual Field testing including stimuli, test patterns like 24-2 and 10-2, and testing types.
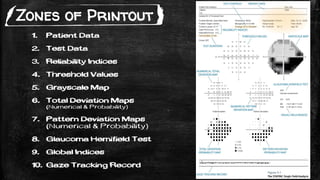
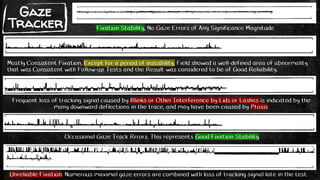
- What the test printout shows including reliability indices, threshold values, deviation maps, and gaze tracking records.
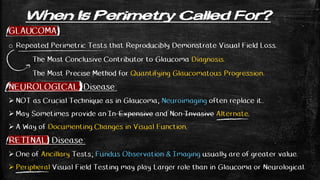
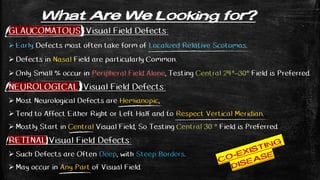
- What abnormalities are looked for in glaucoma, neurological diseases, and retinal diseases and how the test helps in diagnosis and monitoring of these conditions.
![Stimulus Series of White-on-White Light Stimuli
Variable Intensities (0-51 decibel) & Brightness (0.08-10000 apostilb)
Minimum Intensity (0 dB) = Maximum Brightness (10.000 asb)
Maximum Intensity (51 Db) = Maximum Dimness (0.08 asb)
Variable Sizes (I to V), Ranging from 0.25 mm² to 64 mm² (0.1° to 1.72°)
Uniform Background Illumination of 31.5 asb. (10 Cd/m2) [Standardized]
This Adaptation Level = Minimum Brightness for Photopic Vision
That depends upon Retinal Cone function rather than on Rods.
Fixed Duration of (200 milli-seconds) [Standardized]
Long Enough for Visibility.
Shorter than Latency for Voluntary Eye Movements (No Time to See Then Look Towards)
Various Locations at Visual FieldAccurate Mapping of Presentation of Stimuli on Retina.
Fixation Monitoring by Gaze Tracker with Precision of 1°, Recoded with Each Stimulus.](https://image.slidesharecdn.com/humphreyvisualfield-200720201918/85/Visual-Field-Humphrey-Perimetry-6-320.jpg)


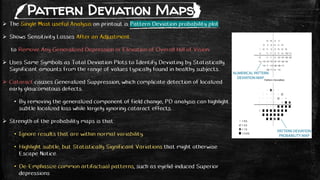
![ Identify Test Locations that are Outside Normal Limits.
Threshold Sensitivity is Compared with Age-Corrected Normal Values at each test
point to produce Total Deviation Numerical Map.
• Negative (ve) Values Indicates Lower than Normal Sensitivity.
• Postive (+ve) Values Indicates Higher than Normal Sensitivity.
• Zero (0) Values Indicates NO Changes.
Statistical Significances of these Deviations and are indicated in the Associated
Total Deviation Probability Plot.
• Deviations are Highlighted when they are Worse than those found in Key at bottom
[5%, 2%, 1%, 0.5%] of Sensitivities in Normal subjects of Same Age as Patient.
• eg. 2% Symbol = 98% of Normal Same Aged have Higher Sensitivity than Recorded.
Range of Sensitivity among healthy subjects is larger in Periphery than Center.
• So deviation of Same Value (5 dB) are Statistically Significant at Center of Field,
But is Totally Within Normal Range of Sensitivity in Periphery..
Total Deviation Maps](https://image.slidesharecdn.com/humphreyvisualfield-200720201918/85/Visual-Field-Humphrey-Perimetry-21-320.jpg)