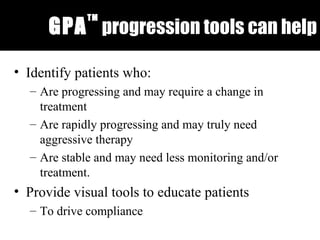
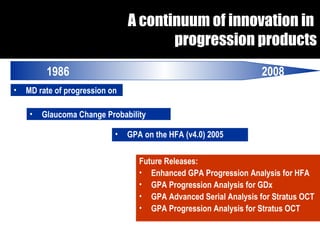
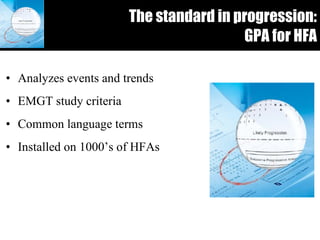
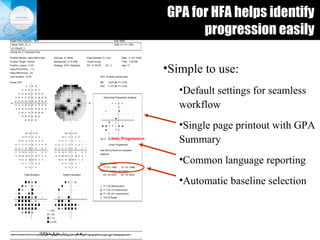
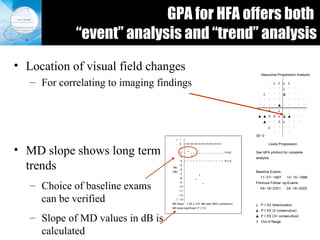
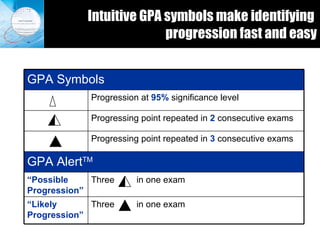
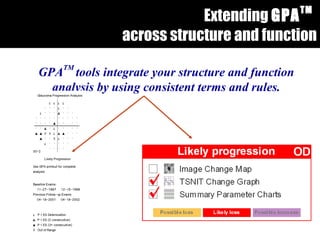
Guided Progression Analysis™ (GPA) The Future of Progression Tools for Structure and Function
GPA TM  progression tools can help Identify patients who: Are progressing and may require a change in treatment Are rapidly progressing and may truly need aggressive therapy Are stable and may need less monitoring and/or treatment . Provide visual tools to educate patients To drive compliance
A continuum of innovation in  progression products Future Releases: Enhanced GPA Progression Analysis for HFA GPA Progression Analysis for GDx  GPA Advanced Serial Analysis for Stratus OCT GPA Progression Analysis for Stratus OCT  MD rate of progression on HFA i GPA on the HFA (v4.0) 2005 1986  2008 Glaucoma Change Probability Analysis 1989
The standard in progression:  GPA for HFA Analyzes events and trends EMGT study criteria Common language terms Installed on 1000’s of HFAs
GPA for HFA helps identify  progression easily  Likely Progression Simple to use:  Default settings for seamless workflow Single page printout with GPA Summary  Common language reporting Automatic baseline selection
GPA for HFA offers both  “event” analysis and “trend” analysis Location of visual field changes  For correlating to imaging findings MD slope shows long term trends  Choice of baseline exams can be verified Slope of MD values in dB is calculated
Intuitive GPA symbols make identifying  progression fast and easy Three  in one exam “ Likely Progression” Three  in one exam “ Possible Progression” GPA Alert TM Progressing point repeated in  3  consecutive exams Progressing point repeated in  2  consecutive exams Progression at  95%  significance level GPA Symbols
Extending  GPA TM   across structure and function GPA TM   tools integrate your structure and function analysis by using consistent terms and rules.
Under development … more innovations  in GPA for HFA Improved metric of visual field loss  New graphical trend display  VF Index plotted against age  Single page printout Available 2007
Under development…Visual Field Index (VFI)   An improved metric for assessing rate of progression Central points weighted more heavily than those on periphery Reduces cataract contribution to the measurement of VF loss “  B ”has more damaged central points  and lower VFI  than“ A ”. A B VFI = 90% VFI = 81%
Under development … more innovations  in GPA for HFA The Regression Graph The VFI Bar
VF Index shows vision loss in terms of %’s Under development … more innovations  in GPA for HFA
Visual Field Index Bar   Shows vision loss in terms of  % Enhanced visual presentation Under development … more innovations  in GPA for HFA 100% % loss to date % loss in next 5 years
VF Index plotted against age: Characterizes trend significance over next 5 years Aids in interpretation & patient education  Helps formulate individualized treatment decisions Under development … more innovations  in GPA for HFA

Hfa progression 110706 e

  • 1.
    Guided Progression Analysis™(GPA) The Future of Progression Tools for Structure and Function
  • 2.
    GPA TM progression tools can help Identify patients who: Are progressing and may require a change in treatment Are rapidly progressing and may truly need aggressive therapy Are stable and may need less monitoring and/or treatment . Provide visual tools to educate patients To drive compliance
  • 3.
    A continuum ofinnovation in progression products Future Releases: Enhanced GPA Progression Analysis for HFA GPA Progression Analysis for GDx GPA Advanced Serial Analysis for Stratus OCT GPA Progression Analysis for Stratus OCT MD rate of progression on HFA i GPA on the HFA (v4.0) 2005 1986 2008 Glaucoma Change Probability Analysis 1989
  • 4.
    The standard inprogression: GPA for HFA Analyzes events and trends EMGT study criteria Common language terms Installed on 1000’s of HFAs
  • 5.
    GPA for HFAhelps identify progression easily Likely Progression Simple to use: Default settings for seamless workflow Single page printout with GPA Summary Common language reporting Automatic baseline selection
  • 6.
    GPA for HFAoffers both “event” analysis and “trend” analysis Location of visual field changes For correlating to imaging findings MD slope shows long term trends Choice of baseline exams can be verified Slope of MD values in dB is calculated
  • 7.
    Intuitive GPA symbolsmake identifying progression fast and easy Three in one exam “ Likely Progression” Three in one exam “ Possible Progression” GPA Alert TM Progressing point repeated in 3 consecutive exams Progressing point repeated in 2 consecutive exams Progression at 95% significance level GPA Symbols
  • 8.
    Extending GPATM across structure and function GPA TM tools integrate your structure and function analysis by using consistent terms and rules.
  • 9.
    Under development …more innovations in GPA for HFA Improved metric of visual field loss New graphical trend display VF Index plotted against age Single page printout Available 2007
  • 10.
    Under development…Visual FieldIndex (VFI) An improved metric for assessing rate of progression Central points weighted more heavily than those on periphery Reduces cataract contribution to the measurement of VF loss “ B ”has more damaged central points and lower VFI than“ A ”. A B VFI = 90% VFI = 81%
  • 11.
    Under development …more innovations in GPA for HFA The Regression Graph The VFI Bar
  • 12.
    VF Index showsvision loss in terms of %’s Under development … more innovations in GPA for HFA
  • 13.
    Visual Field IndexBar Shows vision loss in terms of % Enhanced visual presentation Under development … more innovations in GPA for HFA 100% % loss to date % loss in next 5 years
  • 14.
    VF Index plottedagainst age: Characterizes trend significance over next 5 years Aids in interpretation & patient education Helps formulate individualized treatment decisions Under development … more innovations in GPA for HFA