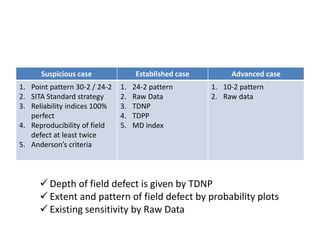
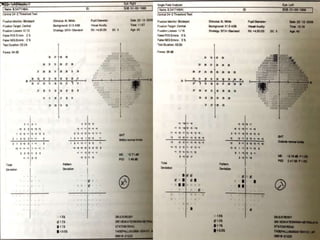
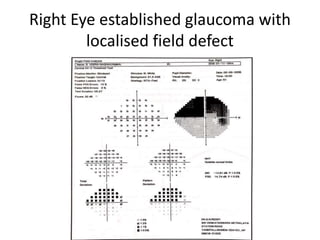
Perimetry
Dr Vedant Murkey
PG Resident
Dept of Ophthalmology
Points to be covered
• Visual field
• Types of perimetry (in brief)
• Kinetic perimetry
• Important definitions and concepts
• Static perimetry (in detail)
• Humphrey’s Field Analysis
• High sensitivity field modalities
Visual Field
• Definition: Part of the environment which is
visible to a steadily fixating eye.
• Normal visual field
• Confrontation test – crudest method
• Technique employed to quantify and examine
the visual field is termed as perimetry
Types of perimetry
1. Kinetic Perimetry
• Two dimensional
• Target moves
• Fast and flexible but more subjective
• May miss shallow scotomas
2. Static Perimetry (diagnostic modality of choice)
• Three dimensional
• Target static
• Slower than kinetic but less subjective
• Defines scotomas and isopters better
Kinetic perimetry – Bjerrum’s Tangent
Screen
• Patient is seated at 2 metres
• Fixates a spot on black screen in front
• White spot (1-10 mm) size brought from
periphery to centre
• Here not the angles but the tangents are
recorded since they are being projected on a
flat screen
• Only central 30 degrees can be measured
Kinetic perimetry – Goldmann’s
perimeter
• When charts of the two eyes are
superimposed we get a large common central
area i.e the field of binocular vision
• Perimetry can be repeated for various colours
as well:
– Red/green should be used first and then
blue/yellow
– Normally white field is largest followed in order by
blue/yellow & red/green.
– Deductions made from variations in colour fields
are particularly unreliable, except in compressive
lesions when red is affected first.
Important definitions and concepts
• Isopter
• Scotoma (relative vs absolute)
• Luminance (asb)
• Background luminance
• Decibels
• Differential light sensitivity
• Threshold
Important definitions and concepts
• Isopter
• Scotoma (relative vs absolute)
• Luminance
• Background luminance
– Concept
– Relation with retinal sensitivity
– Scotopic vs Photopic background luminance
– Importance in retinal diseases
– Background luminance of automated perimeters
• Decibels
• Differential light sensitivity
• Threshold
Automated Perimeter Background Luminance
Octopus 1-2-3 31.4 asb units
Humphrey’s 31.5 asb units
Dicon 31.5 asb units
Important definitions and concepts
• Isopter
• Scotoma (relative vs absolute)
• Luminance
• Background luminance
• Decibels
– Concept
– Need for the terminology
– Relation with luminance, retinal sensitivity
• Differential light sensitivity
• Threshold
Important definitions and concepts
• Isopter
• Scotoma (relative vs absolute)
• Luminance
• Background luminance
• Decibels
• Differential light sensitivity
• Threshold
– Concept
– Suprathreshold vs Infrathreshold
Types of stimuli
1. In kinetic perimetry:
 Given luminance moved from non seeing to seeing area
 Different isopters plotted for various luminance i.e largest isopter
for brightest luminance and smallest for dimmest luminance
2. Static supra-threshold:
 Stimuli of luminance above the expected normal threshold for an
age-matched population
 Used in automated screening strategies
 Milder deficits are usually missed
3. Static threshold:
 Used for detailed assessment of hill of vision
 Threshold luminance is plotted at various locations in the visual field
& compared with age-matched normal
 Full threshold double crossing staircase bracketing strategy is used
 Most commonly used for monitoring glaucoma
Automated static perimetry
• History:
– 1970 – Original Octopus perimeter introduced
– 1982 – Humphrey’s Field Analyser first displayed at AAO
– 1983 – Michael Patella its first clinical trial
– 1984 – Commercial production and use of HFA started
• Automated static perimetry maps visual field which is
mainly for two purposes:
– To diagnose various clinical conditions
• Ocular : Optic Nerve disorders and glaucoma
• CNS conditions : Optic Nerve Pathway disorders, CNS tumors,
occipital lobe infarcts
– To manage glaucoma
Relationship between asb & dB
• Asb are absolute units of light intensity
• dB are relative units of light intensity as the
value will obviously depend on the maximum
light intensity produced by a perimeter.
• Conversion of asb to dB is logarithmic and not
simple multiplication factor:
1 dB = 1/10 log unit of attenuation of maximum
available stimulus
therefore;
10 dB is 1 log unit less intense = 1000 asb units
20 dB is 2 log unit less intense = 100 asb units
30 dB is 3 log unit less intense = 10 asb units
40 dB is 4 log unit less intense = 1 asb units
• Remember,
dB is used to measure both retinal
sensitivity as well as light intensity. To simplify
Low dB
Less
attenuation of
projected light
High intensity
of light
stimulus
If retinal points
respond to this
Low retinal
sensitivity
• Again to re-imburse the same –
– 0 dB = maximum light intensity of the perimeter
minimum retinal sensitivity (absolute
scotoma)
– 40 dB = minimum light intensity of the perimeter
maximum retinal sensitivity (foveal)
HUMPHREY’S FIELD ANALYSIS
• Threshold tests are used to detect glaucoma
field defects.
• The automated perimeter testing has 2
components:
– Where do we test = Point pattern
– How do we test = Testing strategy
Point Pattern
• It should always be studied under 5 headings:
1. Extent of field that is going to be tested
2. Relation of points with horizontal and vertical
meridians
3. Point density
4. Total number of points tested
5. Degree of bare area around the fixation spot
30-2 and 24-2
1. Central 30⁰
2. No point intersecting any axes
3. 6⁰ apart
4. 76 points
5. Circle of 3⁰ radius
1. Central 24⁰
2. No point intersecting any axes
3. 6⁰ apart
4. 54 points
5. Circle of 3⁰ radius
10-2 pattern
1. Central 10⁰
2. No point intersect any of the axes
3. 2⁰ apart
4. 68 points total
5. Circle of 1⁰ radius bare area
Macular point pattern
Nasal Step Point pattern
1. Peripheral (nasal) 30⁰ to 50⁰
2. No point intersect any of the
axes
3. 10⁰ apart and 2 points above
and below the horizontal axis
at 30⁰, 40⁰ and 50⁰ with 2
eccentric random points
4. Total 14 points tested
Test Pattern Point
Density
Total test points Notes
30-2 6⁰ 76 Used for first glaucoma field
24-2 6⁰ 54 Used for routine glaucoma monitoring
10-2 2⁰ 68 The region tested is the same as amsler grid.
Used in advanced glaucoma
Macular
Program
2⁰ 16 For testing extent of macular lesions or
central scotoma
Nasal Step - 14 Screen for nasal step
30-1 & 24-1 6⁰ 71 & 56 Not used much
Testing strategies
• They are of two types:
1. Old standard threshold strategies: Full threshold
strategy
2. Newer threshold strategies:
• FASTPAC
• SITA-Standard
• SITA-Fast
• Newer threshold strategies method are faster:
– Change the stimulus in 3 dB steps
– Crosses threshold only once
– Theoretical resolution though 3 dB rather than 2
dB, the results are very similar
• Test time required for various testing patterns
and strategies:
1. 30-2 full threshold = 20 minutes
2. 24-2 full threshold = 14 minutes
3. 30-2 SITA standard = 10 minutes
4. 24-2 SITA standard = 7 minutes
5. 24-2 SITA fast = 5 minutes
NOTE:
SITA Standard and SITA Fast strategies are not available
for macular program and nasal step
Selection of point pattern
Case Point Pattern
Glaucoma suspect 30-2 SITA Standard
24-2 SITA Standard
Established Glaucoma 24-2 SITA Standard
Advanced Glaucoma 10-2 SITA Standard
10-2 SITA Fast
Macular Program Full threshold
(All Above test to be conducted with
stimulus size V)
Elderly patient / not able to concentrate
for a longer time
24-2 SITA Fast
Understanding HFA Visual Field Report
Print-out
• It is divided into 10 zones and should be studied
and corelated with the clinical findings
Zones independent of normative data & STATPAC
1. Patient data/ Test data
2. Reliability indices / Foveal threshold
3. Raw Data
4. Grey scale
 Zones dependent on normative data & STATPAC
5. Total Deviation Numerical Plot
6. Total Deviation Probability Plot
7. Pattern Deviation Numerical Plot
8. Pattern Deviation Probability Plot
9. Global Indices (MD, PSD, CPSD, SF)
10. Glaucoma Hemifield test:
- Outside normal limit
- Borderline
- Abnormally low sensitive
- Abnormally high sensitive
- Within normal limits
Zone 1 – Test Data
• Patient name & ID
• DOB (most important)
• Pupil diameter (ideal 3-4 mm)
• Visual acuity and refraction
• Fixation target – Central, Small diamond, Large
diamond, Bottom LED
• Fixation monitor
• Colour of stimulus
• Background illumination
• Stimulus size ( III or V )
• Central = most commonly used
• Small diamond = used when patient cannot
fixate as in cases of macular degenerations.
• Large diamond = used in patients with central
scotoma who cannot see central target and
small diamond
• Bottom LED = It is the Bottom LED of large
diamond; used in superior 64 or superior 36
screening test as default.
Zone 2 – Foveal threshold/ Reliability
indices
• Foveal threshold and visual acuity:
In case of good VA and poor foveal threshold, check for the optical correction.
• Fixation losses:
- 5% stimuli are presented to blind spot to assess fixation loss.
- >20% is unreliable
• False positives:
- Trigger happy patients
- >33% unreliable “XX” appears on the report.
- High FP = grey tone of the grey scale show multiple white scotomas
• False negatives:
- Failure to respond to brightest stimulus in an area previously predetermined to
have some sensitivity
- 20% unreliable (the machine defaults it to 33%)
- In advanced glaucoma we may get 50% FN due to small shifts in fixation
• Importance of locating blind spot
Zone 3 – Raw Data
Zone 4 – Grey Scale
• The numerical value of raw data is presented
graphically in a grey scale.
• The pattern and extent of field defect can be
readily identified from the grey scale.
• Successive progression of field defect can also
be identified just by having a look at the grey
scale
Zone 5 – Total Deviation Numerical
Plot (TDNP)
• Concept and conversion from raw data
• No significant field loss if deviation values
between 0 to -2 dB
• It gives an idea of loss of retinal sensitivity at
each point
• TDNP will give us an idea of the depth of
visual field loss
Zone 6 – Total Deviation Probability
Plot (TDPP)
• Probability plots are designed to know the
pattern and extent of field defects and never
the depth.
• Here loss of sensitivity is expressed in terms of
P value.
• Remember the STATPAC will calculate P value
only where the retinal sensitivity is reduced
and not where it is normal or more than
normal.
Zone 7 – Pattern Deviation Numerical
Plot (PDNP)
• Eliminates the generalised depression in the
visual field in TDNP and helps reveal pattern
and extent of the deep scotomas.
• How is it done?
– Selection of 7th best sensitivity point in TDNP
– Change the sign of the value
– Add it to all values of TDNP we get PDNP
Zone 8 – Pattern Deviation Probability
Plot (PDPP)
• Its nothing but PDNP expressed in P value.
• Helps to know pattern and extent of scotoma
by eliminating any generalised depression.
• Never gives the depth of field defect.
• Pg 63
Zone 9 – Global Indices
1. Mean Deviation (MD):
- Average of overall severity of field loss
- MD expresses the average change height of
the hill of vision
- The MD index depends on the extent and
depth of defect in cases of localised field
defect.
2. Pattern Standard Deviation (PSD):
- PSD expresses the dissimilar deviations in TDNP
- It expresses the contour of the hill of vision
- For all practical purposes, its an index used to pick up
localized scotoma which is an early sign to diagnose
glaucoma.
- Once glaucoma is diagnosed, PSD has minimum role in
the management of glaucoma.
- PSD with significant P value(<5%) indicates localised
field defect or a localised field defect in generalised
depression.
3. Short term Fluctuations (SF):
- Not applicable for SITA, only for full threshold and
FAST PAC
- Its an index of intra test variation
- Upto 2.5 dB is normal
4. Corrected Pattern Standard Deviation (CPSD):
- Can be calculated only if SF is known
- Not of much importance
Zone 10 – Glaucoma Hemifield Test
• It is developed to pick up dissimilarity among
the sensitivities of the corresponding points
on either side of horizontal axis to diagnose
glaucoma at an early stage.
• GHT results:
- Outside normal limits: When one of the zone pair’s score
difference must exceed that found in 99% population
- Borderline: when one of the zone pair’s score difference
exceeds that found in 97% of normal individuals
- General reduction of sensitivity: when best part of the field
is depressed to a degree that occurs in fewer than 0.5%
population
- Abnormally high sensitivity: when best part of the field is
better than normal population. Here there is no need to
compare the upper and lower zones
- Within normal limit: when all above are not met
Important note
• Features of localised field defect:
– TDPP and PDPP identical
– PSD high
– MD depend on the depth and extent of the defect
• Features of uniform generalised field defect:
– Generalised depression in TDPP & almost normal in PDPP
– PSD low
– MD equal to most deviation values in TDNP
• Features of irregular generalised field defect:
– Generalised depression in TDPP & localised defect in PDPP
– PSD high
– MD high
Indices to pick up early
loss of sensitivity
(Early sign of glaucoma)
• To decide the target IOP we need to know the
exact nerve damage which can be assessed by
knowing:
– Depth of field defect = TDNP
– Extent of field defect = TDPP
– Present retinal sensitivity = raw data
– Foveal status
– Presenting IOP
How advanced is the disease?
• Early Defect:
– MD better than -6.00 dB
– 25% points in TDNP should have P value 5% and less than 10 points
have P value of 1%
– No point in the central 5 degree has sensitivity <15 dB
• Moderate Defect:
– Exceeds 1 or more criteria of those in early defect but does not meet
sever criteria.
• Severe Defect:
– MD better than -12.00 dB
– More than 50% points in TDNP should have P value 5%
– More than 20 points have P value of 1%
– A point in the central 5 degree has 0 dB sensitivity or points closer
than 5 degree fixation under 15 dB sesnitivity in both upper and lower
fields
Comparing threshold testing strategies
FULL THRESHOLD / FASTPAC SITA STANDARD / SITA FAST
Can be used in
- 30-2 central threshold pattern
- 24-2 central threshold pattern
- 10-2 central threshold pattern
- Peripheral 60-4
- Macular program pattern
- Nasal step
- All tests with stimulus size V
Can be used in
- - 30-2 central threshold pattern
- 24-2 central threshold pattern
- 10-2 central threshold pattern
- Peripheral 60-4
(rest cannot be used)
Reliability indices:
- Fixation losses
- FP
- FN
Reliability indices:
- Fixation losses
- FP
- FN
Calculates Short term Fluctuations (SF) Does not calculate Short term
Fluctuations (SF)
Calculates CPSD Does not calculate CPSD
GHT is present in Full Threshold but
absent in FASTPAC
GHT is present in both
Humphrey Visual Field Printouts
without STATPAC analysis
They include :
1. Three in one printout with size V stimulus
2. Three in one Macular Program Printout
3. Three in one 60-4 Peripheral Printout
4. Nasal Step Printout
Three in one size V stimulus Printout
Three in one Macular program Printout
Three in one Peripheral 60-4 Printout
• Note that:
– Can also be done with SITA strategy but no
STATPAC ever
– Peripheral 30 – 60 degrees in tested
– Total points = 60
– No point lies on horizontal and vertical axes
– Distance between two points is 12 degrees
– It is mainly used in retinitis pigmentosa.
Two in one Nasal Step Printout
Important and Crucial considerations
before interpreting a report
• Pupil size
• Refractive correction for near
• Reliability indices (very important)
– Fixation losses
– False Positives
– False Negatives
• Lens Rim artifacts
– Absolute and sharply demarcated
What to do in cases of High Repeated
Fixation Losses
So what to do ??
1. Change the testing strategy
- SITA Standard to SITA Fast
- Full threshold to FASTPAC
2. Change the central fixation target to small or
big diamond
3. Change the stimulus size to V
Excess False Positives
Excess False Negatives
Lens Rim Artifact
- Visual Field Losses in Glaucoma
- Screening tests
- Clinically important cases
- High sensitivity field modalities
Visual Field Losses in Glaucoma
Approach to visual field losses in
glaucoma
In suspicious case of
glaucoma
Aim is to know
whether glaucoma
present or not
In established case of
glaucoma
Aim is to know the
depth and extent of
field loss & its relation
to fovea
In advanced cases of
glaucoma
Aim is to know the
exact residual retinal
sensitivity
Suspicious case Established case Advanced case
1. Point pattern 30-2 / 24-2
2. SITA Standard strategy
3. Reliability indices 100%
perfect
4. Reproducibility of field
defect at least twice
5. Anderson’s criteria
1. 24-2 pattern
2. Raw Data
3. TDNP
4. TDPP
5. MD index
1. 10-2 pattern
2. Raw data
 Depth of field defect is given by TDNP
 Extent and pattern of field defect by probability plots
 Existing sensitivity by Raw Data
• Anderson’s criteria:
– Criteria 1: Probability plots
There should be minimum of three non-edge adjacent
or cluster points in an expected location with P values
either in TDNP (localised defect) or PDNP (generalised
defect) as:
a. P value of 2 points <5%
b. The remaining one point should have P value <1%
– Criteria 2: PSD < 5%
– Criteria 3: GHT abnormal
• Criteria to pick up early generalised
depression is comparing MD index with other
eye:
1. 2 dB difference of the MD index
2. 1.5 dB difference in MD index in the two eyes
3. An average difference as small as 1 dB in four
consecutive tests
Case 1 – Suspicious case of glaucoma
• 40 yr old male, glaucoma suspected LE due to
RNFL defect. IOP normal both eyes. Angles
normal. No family history. Perimetry advised.
RE has no evidence of
glaucomatous nerve damage.
LE has localised field defect
fulfilling Anderson criteria
confirming the loss of retinal
senistivity due to glaucoma.
Established glaucoma with localised
field defect
• We have to look at:
– Extent and pattern of defect (TDPP ≈ PDPP)
– Progression of field defect
– Depth of field defect (TDNP) and existing
sensitivity (raw data)
– GHT & PSD = not very important now.
– Actual average loss of sensitivity in localised field
defect would be more than the MD index
– Foveal status
Right Eye established glaucoma with
localised field defect
Established glaucoma with irregular
generalised field defect (cataract)
• Less affected areas will be highlighted in the
pattern deviation probability plot when glaucoma
presents with irregular generalised field defect
• We have to look at:
– Extent and pattern of defect (TDPP ≠ PDPP)
– Progression of field defect
– Depth of field defect (TDNP) and existing sensitivity
(raw data)
– GHT & PSD = not very important now.
– MD index would be high
– Foveal status
Case 1 – Right Eye established glaucoma
with irregular generalised field defect
Case of Advanced Glaucoma
• We have to look only at:
– Raw data ONLY
– Very important to assess foveal split
– 10-2 is the modality of choice
Glaucoma Screening Tests
• They also have:
a. Point patterns
b. Testing strategies
Point Pattern No. of points Test time
Armaly Central 84 5-6 min
Armaly full field 98 7-8 min
Nasal 14 2-3 min
• HFA has 4 screening test strategies:
a. Two-zone strategy
b. Three-zone strategy
c. Quantify defect screening strategy
d. Single intensity strategy
Two-Zone Strategy
Three-Zone Strategy
Quantify Defects Strategy
CLINICALLY IMPORTANT CASES
Case
• Bilateral OA R>L
• History of head trauma 1 year ago
• CT scan shows compression of brain tissue
proper
Generalised Field Depresion = B/L Optic
atrophy
Left Homonymous Hemianopia = Occipital
lobe injury
Case
• Ataxic Gait
• Both Eye Fundus – WNL
• Fields
SWAP – Short Wavelength Automated
Perimetry (Blue-Yellow Perimetry)
• Develooped to detect early field defects in glaucoma
• Intense yellow background and blue stimuli
• The green & red cones are bleached by yellow
background and the blue accentuated.
• Disadvantages:
– Takes more time than standard automated perimetry
– Stimulus is difficult to discern
– Patients with cataract may produce significantly
depressed fields.
– SWAP grey scale is darker than normal and may mislead
the physician
Frequency Doubling Technology (FDT)
• FDT perimetry determines contrast threshold
– the minimum contrast necessary for
stimulus detection
• Used to pick up early field defects of glaucoma
• It specifically tests the response of M-type
RGC which are first affected in glaucoma.
• Concept of frequency doubling
P-type RGC M-type RGC
Majority of RGC (80-90%) Lesder density (10-20%)
Project to parvocellular layer of LGB Project to Magnocellular layer of LGB
Small diam. & slow conduction Larger diam. & fast conduction
Responsive to
- High spatial frequencies (fine
details/smaller objects)
- Low temporal frequencies (steady or
constant stimulus presentation and
low flicker rates)
Responsive to
- Low spatial frequencies (broad
patterns/larger objects)
- High temporal frequencies (sudden
change of stimulus presentation and
high flicker rates)
Responsible for processing color vision,
VA.
Responsible for processing motion and
high frequency flicker information
FDT Threshold Patterns in HFA
1. C-30-2 = 69 squares. Size of the square 5⁰ x 5⁰
2. C-24-2 = 55 squares. Size of the square 5⁰ x 5⁰
3. C-10-2 = 44 squares. Size of the square 2⁰ x 2⁰
4. C-20 = 17 squares. Size of the square 10⁰ x 10⁰
5. N-30 = 19 squares. Size of the square 10⁰ x 10⁰
6. Macula = 16 squares. Size of the square 2⁰ x 2⁰
FDT Threshold Strategies in HFA
• Standard Full threshold strategy:
– MOBS – Modified Binary Search
• Newer Contrast threshold strategies:
– REBS – Rapid Efficient Binary System
– ZEST – Zippy Estimation of Sequential Testing
Perimetry
Perimetry

Perimetry

  • 1.
    Perimetry Dr Vedant Murkey PGResident Dept of Ophthalmology
  • 2.
    Points to becovered • Visual field • Types of perimetry (in brief) • Kinetic perimetry • Important definitions and concepts • Static perimetry (in detail) • Humphrey’s Field Analysis • High sensitivity field modalities
  • 3.
    Visual Field • Definition:Part of the environment which is visible to a steadily fixating eye. • Normal visual field • Confrontation test – crudest method • Technique employed to quantify and examine the visual field is termed as perimetry
  • 8.
    Types of perimetry 1.Kinetic Perimetry • Two dimensional • Target moves • Fast and flexible but more subjective • May miss shallow scotomas 2. Static Perimetry (diagnostic modality of choice) • Three dimensional • Target static • Slower than kinetic but less subjective • Defines scotomas and isopters better
  • 9.
    Kinetic perimetry –Bjerrum’s Tangent Screen • Patient is seated at 2 metres • Fixates a spot on black screen in front • White spot (1-10 mm) size brought from periphery to centre • Here not the angles but the tangents are recorded since they are being projected on a flat screen • Only central 30 degrees can be measured
  • 11.
    Kinetic perimetry –Goldmann’s perimeter
  • 12.
    • When chartsof the two eyes are superimposed we get a large common central area i.e the field of binocular vision • Perimetry can be repeated for various colours as well: – Red/green should be used first and then blue/yellow – Normally white field is largest followed in order by blue/yellow & red/green. – Deductions made from variations in colour fields are particularly unreliable, except in compressive lesions when red is affected first.
  • 13.
    Important definitions andconcepts • Isopter • Scotoma (relative vs absolute) • Luminance (asb) • Background luminance • Decibels • Differential light sensitivity • Threshold
  • 15.
    Important definitions andconcepts • Isopter • Scotoma (relative vs absolute) • Luminance • Background luminance – Concept – Relation with retinal sensitivity – Scotopic vs Photopic background luminance – Importance in retinal diseases – Background luminance of automated perimeters • Decibels • Differential light sensitivity • Threshold
  • 16.
    Automated Perimeter BackgroundLuminance Octopus 1-2-3 31.4 asb units Humphrey’s 31.5 asb units Dicon 31.5 asb units
  • 17.
    Important definitions andconcepts • Isopter • Scotoma (relative vs absolute) • Luminance • Background luminance • Decibels – Concept – Need for the terminology – Relation with luminance, retinal sensitivity • Differential light sensitivity • Threshold
  • 18.
    Important definitions andconcepts • Isopter • Scotoma (relative vs absolute) • Luminance • Background luminance • Decibels • Differential light sensitivity • Threshold – Concept – Suprathreshold vs Infrathreshold
  • 20.
    Types of stimuli 1.In kinetic perimetry:  Given luminance moved from non seeing to seeing area  Different isopters plotted for various luminance i.e largest isopter for brightest luminance and smallest for dimmest luminance 2. Static supra-threshold:  Stimuli of luminance above the expected normal threshold for an age-matched population  Used in automated screening strategies  Milder deficits are usually missed 3. Static threshold:  Used for detailed assessment of hill of vision  Threshold luminance is plotted at various locations in the visual field & compared with age-matched normal  Full threshold double crossing staircase bracketing strategy is used  Most commonly used for monitoring glaucoma
  • 21.
    Automated static perimetry •History: – 1970 – Original Octopus perimeter introduced – 1982 – Humphrey’s Field Analyser first displayed at AAO – 1983 – Michael Patella its first clinical trial – 1984 – Commercial production and use of HFA started • Automated static perimetry maps visual field which is mainly for two purposes: – To diagnose various clinical conditions • Ocular : Optic Nerve disorders and glaucoma • CNS conditions : Optic Nerve Pathway disorders, CNS tumors, occipital lobe infarcts – To manage glaucoma
  • 22.
    Relationship between asb& dB • Asb are absolute units of light intensity • dB are relative units of light intensity as the value will obviously depend on the maximum light intensity produced by a perimeter. • Conversion of asb to dB is logarithmic and not simple multiplication factor: 1 dB = 1/10 log unit of attenuation of maximum available stimulus therefore;
  • 23.
    10 dB is1 log unit less intense = 1000 asb units 20 dB is 2 log unit less intense = 100 asb units 30 dB is 3 log unit less intense = 10 asb units 40 dB is 4 log unit less intense = 1 asb units
  • 24.
    • Remember, dB isused to measure both retinal sensitivity as well as light intensity. To simplify Low dB Less attenuation of projected light High intensity of light stimulus If retinal points respond to this Low retinal sensitivity
  • 25.
    • Again tore-imburse the same – – 0 dB = maximum light intensity of the perimeter minimum retinal sensitivity (absolute scotoma) – 40 dB = minimum light intensity of the perimeter maximum retinal sensitivity (foveal)
  • 27.
  • 29.
    • Threshold testsare used to detect glaucoma field defects. • The automated perimeter testing has 2 components: – Where do we test = Point pattern – How do we test = Testing strategy
  • 30.
    Point Pattern • Itshould always be studied under 5 headings: 1. Extent of field that is going to be tested 2. Relation of points with horizontal and vertical meridians 3. Point density 4. Total number of points tested 5. Degree of bare area around the fixation spot
  • 31.
    30-2 and 24-2 1.Central 30⁰ 2. No point intersecting any axes 3. 6⁰ apart 4. 76 points 5. Circle of 3⁰ radius 1. Central 24⁰ 2. No point intersecting any axes 3. 6⁰ apart 4. 54 points 5. Circle of 3⁰ radius
  • 33.
    10-2 pattern 1. Central10⁰ 2. No point intersect any of the axes 3. 2⁰ apart 4. 68 points total 5. Circle of 1⁰ radius bare area
  • 34.
  • 35.
    Nasal Step Pointpattern 1. Peripheral (nasal) 30⁰ to 50⁰ 2. No point intersect any of the axes 3. 10⁰ apart and 2 points above and below the horizontal axis at 30⁰, 40⁰ and 50⁰ with 2 eccentric random points 4. Total 14 points tested
  • 36.
    Test Pattern Point Density Totaltest points Notes 30-2 6⁰ 76 Used for first glaucoma field 24-2 6⁰ 54 Used for routine glaucoma monitoring 10-2 2⁰ 68 The region tested is the same as amsler grid. Used in advanced glaucoma Macular Program 2⁰ 16 For testing extent of macular lesions or central scotoma Nasal Step - 14 Screen for nasal step 30-1 & 24-1 6⁰ 71 & 56 Not used much
  • 37.
    Testing strategies • Theyare of two types: 1. Old standard threshold strategies: Full threshold strategy 2. Newer threshold strategies: • FASTPAC • SITA-Standard • SITA-Fast
  • 39.
    • Newer thresholdstrategies method are faster: – Change the stimulus in 3 dB steps – Crosses threshold only once – Theoretical resolution though 3 dB rather than 2 dB, the results are very similar
  • 40.
    • Test timerequired for various testing patterns and strategies: 1. 30-2 full threshold = 20 minutes 2. 24-2 full threshold = 14 minutes 3. 30-2 SITA standard = 10 minutes 4. 24-2 SITA standard = 7 minutes 5. 24-2 SITA fast = 5 minutes NOTE: SITA Standard and SITA Fast strategies are not available for macular program and nasal step
  • 41.
  • 42.
    Case Point Pattern Glaucomasuspect 30-2 SITA Standard 24-2 SITA Standard Established Glaucoma 24-2 SITA Standard Advanced Glaucoma 10-2 SITA Standard 10-2 SITA Fast Macular Program Full threshold (All Above test to be conducted with stimulus size V) Elderly patient / not able to concentrate for a longer time 24-2 SITA Fast
  • 43.
    Understanding HFA VisualField Report Print-out • It is divided into 10 zones and should be studied and corelated with the clinical findings Zones independent of normative data & STATPAC 1. Patient data/ Test data 2. Reliability indices / Foveal threshold 3. Raw Data 4. Grey scale
  • 44.
     Zones dependenton normative data & STATPAC 5. Total Deviation Numerical Plot 6. Total Deviation Probability Plot 7. Pattern Deviation Numerical Plot 8. Pattern Deviation Probability Plot 9. Global Indices (MD, PSD, CPSD, SF) 10. Glaucoma Hemifield test: - Outside normal limit - Borderline - Abnormally low sensitive - Abnormally high sensitive - Within normal limits
  • 47.
    Zone 1 –Test Data • Patient name & ID • DOB (most important) • Pupil diameter (ideal 3-4 mm) • Visual acuity and refraction • Fixation target – Central, Small diamond, Large diamond, Bottom LED • Fixation monitor • Colour of stimulus • Background illumination • Stimulus size ( III or V )
  • 49.
    • Central =most commonly used • Small diamond = used when patient cannot fixate as in cases of macular degenerations. • Large diamond = used in patients with central scotoma who cannot see central target and small diamond • Bottom LED = It is the Bottom LED of large diamond; used in superior 64 or superior 36 screening test as default.
  • 50.
    Zone 2 –Foveal threshold/ Reliability indices • Foveal threshold and visual acuity: In case of good VA and poor foveal threshold, check for the optical correction. • Fixation losses: - 5% stimuli are presented to blind spot to assess fixation loss. - >20% is unreliable • False positives: - Trigger happy patients - >33% unreliable “XX” appears on the report. - High FP = grey tone of the grey scale show multiple white scotomas • False negatives: - Failure to respond to brightest stimulus in an area previously predetermined to have some sensitivity - 20% unreliable (the machine defaults it to 33%) - In advanced glaucoma we may get 50% FN due to small shifts in fixation • Importance of locating blind spot
  • 52.
    Zone 3 –Raw Data
  • 53.
    Zone 4 –Grey Scale • The numerical value of raw data is presented graphically in a grey scale. • The pattern and extent of field defect can be readily identified from the grey scale. • Successive progression of field defect can also be identified just by having a look at the grey scale
  • 57.
    Zone 5 –Total Deviation Numerical Plot (TDNP) • Concept and conversion from raw data • No significant field loss if deviation values between 0 to -2 dB • It gives an idea of loss of retinal sensitivity at each point • TDNP will give us an idea of the depth of visual field loss
  • 59.
    Zone 6 –Total Deviation Probability Plot (TDPP) • Probability plots are designed to know the pattern and extent of field defects and never the depth. • Here loss of sensitivity is expressed in terms of P value. • Remember the STATPAC will calculate P value only where the retinal sensitivity is reduced and not where it is normal or more than normal.
  • 61.
    Zone 7 –Pattern Deviation Numerical Plot (PDNP) • Eliminates the generalised depression in the visual field in TDNP and helps reveal pattern and extent of the deep scotomas. • How is it done? – Selection of 7th best sensitivity point in TDNP – Change the sign of the value – Add it to all values of TDNP we get PDNP
  • 62.
    Zone 8 –Pattern Deviation Probability Plot (PDPP) • Its nothing but PDNP expressed in P value. • Helps to know pattern and extent of scotoma by eliminating any generalised depression. • Never gives the depth of field defect.
  • 63.
  • 64.
    Zone 9 –Global Indices 1. Mean Deviation (MD): - Average of overall severity of field loss - MD expresses the average change height of the hill of vision - The MD index depends on the extent and depth of defect in cases of localised field defect.
  • 65.
    2. Pattern StandardDeviation (PSD): - PSD expresses the dissimilar deviations in TDNP - It expresses the contour of the hill of vision - For all practical purposes, its an index used to pick up localized scotoma which is an early sign to diagnose glaucoma. - Once glaucoma is diagnosed, PSD has minimum role in the management of glaucoma. - PSD with significant P value(<5%) indicates localised field defect or a localised field defect in generalised depression.
  • 66.
    3. Short termFluctuations (SF): - Not applicable for SITA, only for full threshold and FAST PAC - Its an index of intra test variation - Upto 2.5 dB is normal 4. Corrected Pattern Standard Deviation (CPSD): - Can be calculated only if SF is known - Not of much importance
  • 67.
    Zone 10 –Glaucoma Hemifield Test • It is developed to pick up dissimilarity among the sensitivities of the corresponding points on either side of horizontal axis to diagnose glaucoma at an early stage.
  • 69.
    • GHT results: -Outside normal limits: When one of the zone pair’s score difference must exceed that found in 99% population - Borderline: when one of the zone pair’s score difference exceeds that found in 97% of normal individuals - General reduction of sensitivity: when best part of the field is depressed to a degree that occurs in fewer than 0.5% population - Abnormally high sensitivity: when best part of the field is better than normal population. Here there is no need to compare the upper and lower zones - Within normal limit: when all above are not met
  • 70.
    Important note • Featuresof localised field defect: – TDPP and PDPP identical – PSD high – MD depend on the depth and extent of the defect • Features of uniform generalised field defect: – Generalised depression in TDPP & almost normal in PDPP – PSD low – MD equal to most deviation values in TDNP • Features of irregular generalised field defect: – Generalised depression in TDPP & localised defect in PDPP – PSD high – MD high
  • 74.
    Indices to pickup early loss of sensitivity (Early sign of glaucoma)
  • 75.
    • To decidethe target IOP we need to know the exact nerve damage which can be assessed by knowing: – Depth of field defect = TDNP – Extent of field defect = TDPP – Present retinal sensitivity = raw data – Foveal status – Presenting IOP
  • 76.
    How advanced isthe disease? • Early Defect: – MD better than -6.00 dB – 25% points in TDNP should have P value 5% and less than 10 points have P value of 1% – No point in the central 5 degree has sensitivity <15 dB • Moderate Defect: – Exceeds 1 or more criteria of those in early defect but does not meet sever criteria. • Severe Defect: – MD better than -12.00 dB – More than 50% points in TDNP should have P value 5% – More than 20 points have P value of 1% – A point in the central 5 degree has 0 dB sensitivity or points closer than 5 degree fixation under 15 dB sesnitivity in both upper and lower fields
  • 77.
    Comparing threshold testingstrategies FULL THRESHOLD / FASTPAC SITA STANDARD / SITA FAST Can be used in - 30-2 central threshold pattern - 24-2 central threshold pattern - 10-2 central threshold pattern - Peripheral 60-4 - Macular program pattern - Nasal step - All tests with stimulus size V Can be used in - - 30-2 central threshold pattern - 24-2 central threshold pattern - 10-2 central threshold pattern - Peripheral 60-4 (rest cannot be used) Reliability indices: - Fixation losses - FP - FN Reliability indices: - Fixation losses - FP - FN Calculates Short term Fluctuations (SF) Does not calculate Short term Fluctuations (SF) Calculates CPSD Does not calculate CPSD GHT is present in Full Threshold but absent in FASTPAC GHT is present in both
  • 78.
    Humphrey Visual FieldPrintouts without STATPAC analysis They include : 1. Three in one printout with size V stimulus 2. Three in one Macular Program Printout 3. Three in one 60-4 Peripheral Printout 4. Nasal Step Printout
  • 79.
    Three in onesize V stimulus Printout
  • 80.
    Three in oneMacular program Printout
  • 81.
    Three in onePeripheral 60-4 Printout • Note that: – Can also be done with SITA strategy but no STATPAC ever – Peripheral 30 – 60 degrees in tested – Total points = 60 – No point lies on horizontal and vertical axes – Distance between two points is 12 degrees – It is mainly used in retinitis pigmentosa.
  • 83.
    Two in oneNasal Step Printout
  • 84.
    Important and Crucialconsiderations before interpreting a report • Pupil size • Refractive correction for near • Reliability indices (very important) – Fixation losses – False Positives – False Negatives • Lens Rim artifacts – Absolute and sharply demarcated
  • 85.
    What to doin cases of High Repeated Fixation Losses
  • 86.
    So what todo ?? 1. Change the testing strategy - SITA Standard to SITA Fast - Full threshold to FASTPAC 2. Change the central fixation target to small or big diamond 3. Change the stimulus size to V
  • 87.
  • 88.
  • 89.
  • 90.
    - Visual FieldLosses in Glaucoma - Screening tests - Clinically important cases - High sensitivity field modalities
  • 91.
    Visual Field Lossesin Glaucoma Approach to visual field losses in glaucoma In suspicious case of glaucoma Aim is to know whether glaucoma present or not In established case of glaucoma Aim is to know the depth and extent of field loss & its relation to fovea In advanced cases of glaucoma Aim is to know the exact residual retinal sensitivity
  • 92.
    Suspicious case Establishedcase Advanced case 1. Point pattern 30-2 / 24-2 2. SITA Standard strategy 3. Reliability indices 100% perfect 4. Reproducibility of field defect at least twice 5. Anderson’s criteria 1. 24-2 pattern 2. Raw Data 3. TDNP 4. TDPP 5. MD index 1. 10-2 pattern 2. Raw data  Depth of field defect is given by TDNP  Extent and pattern of field defect by probability plots  Existing sensitivity by Raw Data
  • 93.
    • Anderson’s criteria: –Criteria 1: Probability plots There should be minimum of three non-edge adjacent or cluster points in an expected location with P values either in TDNP (localised defect) or PDNP (generalised defect) as: a. P value of 2 points <5% b. The remaining one point should have P value <1% – Criteria 2: PSD < 5% – Criteria 3: GHT abnormal
  • 94.
    • Criteria topick up early generalised depression is comparing MD index with other eye: 1. 2 dB difference of the MD index 2. 1.5 dB difference in MD index in the two eyes 3. An average difference as small as 1 dB in four consecutive tests
  • 95.
    Case 1 –Suspicious case of glaucoma • 40 yr old male, glaucoma suspected LE due to RNFL defect. IOP normal both eyes. Angles normal. No family history. Perimetry advised.
  • 97.
    RE has noevidence of glaucomatous nerve damage. LE has localised field defect fulfilling Anderson criteria confirming the loss of retinal senistivity due to glaucoma.
  • 98.
    Established glaucoma withlocalised field defect • We have to look at: – Extent and pattern of defect (TDPP ≈ PDPP) – Progression of field defect – Depth of field defect (TDNP) and existing sensitivity (raw data) – GHT & PSD = not very important now. – Actual average loss of sensitivity in localised field defect would be more than the MD index – Foveal status
  • 99.
    Right Eye establishedglaucoma with localised field defect
  • 102.
    Established glaucoma withirregular generalised field defect (cataract) • Less affected areas will be highlighted in the pattern deviation probability plot when glaucoma presents with irregular generalised field defect • We have to look at: – Extent and pattern of defect (TDPP ≠ PDPP) – Progression of field defect – Depth of field defect (TDNP) and existing sensitivity (raw data) – GHT & PSD = not very important now. – MD index would be high – Foveal status
  • 104.
    Case 1 –Right Eye established glaucoma with irregular generalised field defect
  • 106.
    Case of AdvancedGlaucoma • We have to look only at: – Raw data ONLY – Very important to assess foveal split – 10-2 is the modality of choice
  • 108.
    Glaucoma Screening Tests •They also have: a. Point patterns b. Testing strategies Point Pattern No. of points Test time Armaly Central 84 5-6 min Armaly full field 98 7-8 min Nasal 14 2-3 min
  • 109.
    • HFA has4 screening test strategies: a. Two-zone strategy b. Three-zone strategy c. Quantify defect screening strategy d. Single intensity strategy
  • 111.
  • 112.
  • 113.
  • 114.
  • 118.
    Case • Bilateral OAR>L • History of head trauma 1 year ago • CT scan shows compression of brain tissue proper
  • 121.
    Generalised Field Depresion= B/L Optic atrophy Left Homonymous Hemianopia = Occipital lobe injury
  • 123.
    Case • Ataxic Gait •Both Eye Fundus – WNL • Fields
  • 128.
    SWAP – ShortWavelength Automated Perimetry (Blue-Yellow Perimetry) • Develooped to detect early field defects in glaucoma • Intense yellow background and blue stimuli • The green & red cones are bleached by yellow background and the blue accentuated. • Disadvantages: – Takes more time than standard automated perimetry – Stimulus is difficult to discern – Patients with cataract may produce significantly depressed fields. – SWAP grey scale is darker than normal and may mislead the physician
  • 130.
    Frequency Doubling Technology(FDT) • FDT perimetry determines contrast threshold – the minimum contrast necessary for stimulus detection • Used to pick up early field defects of glaucoma • It specifically tests the response of M-type RGC which are first affected in glaucoma. • Concept of frequency doubling
  • 131.
    P-type RGC M-typeRGC Majority of RGC (80-90%) Lesder density (10-20%) Project to parvocellular layer of LGB Project to Magnocellular layer of LGB Small diam. & slow conduction Larger diam. & fast conduction Responsive to - High spatial frequencies (fine details/smaller objects) - Low temporal frequencies (steady or constant stimulus presentation and low flicker rates) Responsive to - Low spatial frequencies (broad patterns/larger objects) - High temporal frequencies (sudden change of stimulus presentation and high flicker rates) Responsible for processing color vision, VA. Responsible for processing motion and high frequency flicker information
  • 134.
    FDT Threshold Patternsin HFA 1. C-30-2 = 69 squares. Size of the square 5⁰ x 5⁰ 2. C-24-2 = 55 squares. Size of the square 5⁰ x 5⁰ 3. C-10-2 = 44 squares. Size of the square 2⁰ x 2⁰ 4. C-20 = 17 squares. Size of the square 10⁰ x 10⁰ 5. N-30 = 19 squares. Size of the square 10⁰ x 10⁰ 6. Macula = 16 squares. Size of the square 2⁰ x 2⁰
  • 135.
    FDT Threshold Strategiesin HFA • Standard Full threshold strategy: – MOBS – Modified Binary Search • Newer Contrast threshold strategies: – REBS – Rapid Efficient Binary System – ZEST – Zippy Estimation of Sequential Testing