Recommended
PPTX
visual_field_exam.pptx CLINIC CORRELATION
PPT
PPTX
PPTX
optic nerve clinical research examination.pptx
PPTX
PPTX
Visual field print out interpretation and analysis
PPT
Visual Field Examination suchana ophthalmology.ppt
PDF
visualfield-140206115003-phpapp02.pdf
PPTX
The Visual Field for Technicians
PPTX
The Visual Field - For Doctors
PPTX
Visual field analysis--interpretation
PPT
Visual Field presentation.nagla.ppt
PPTX
PPTX
FIELD DEFECT POWER POINT SLIDESSSSSSSSSS
PPTX
VISUAL FIELLLLLLDDD DEFECTT PRESENTATIONNN
PPTX
Neuro-Ophthalmic examination by Riyad Banayot.pptx
PPTX
perimetry , it's types, clinical features, treatment.pptx
PPTX
PDF
perimetry-130707155722-phpapp01.pdf
PPTX
PPTX
PPTX
short presentaion on primetry visual field tests
PPTX
visual field assessment in low vision
PPTX
Central and peripheral visual field
PDF
Visual Field | Humphrey Perimetry
PPTX
PPTX
Visual field basics & interpretation
PPT
COA visual field and reading notes in student
PDF
Short notes in Radiation Oncology by SCOPE
PPTX
Innovations in Chronic Pain Management: From Clinical Idea to Published Research
More Related Content
PPTX
visual_field_exam.pptx CLINIC CORRELATION
PPT
PPTX
PPTX
optic nerve clinical research examination.pptx
PPTX
PPTX
Visual field print out interpretation and analysis
PPT
Visual Field Examination suchana ophthalmology.ppt
PDF
visualfield-140206115003-phpapp02.pdf
Similar to visual_field_exam_with_images.pptx SIMPLE
PPTX
The Visual Field for Technicians
PPTX
The Visual Field - For Doctors
PPTX
Visual field analysis--interpretation
PPT
Visual Field presentation.nagla.ppt
PPTX
PPTX
FIELD DEFECT POWER POINT SLIDESSSSSSSSSS
PPTX
VISUAL FIELLLLLLDDD DEFECTT PRESENTATIONNN
PPTX
Neuro-Ophthalmic examination by Riyad Banayot.pptx
PPTX
perimetry , it's types, clinical features, treatment.pptx
PPTX
PDF
perimetry-130707155722-phpapp01.pdf
PPTX
PPTX
PPTX
short presentaion on primetry visual field tests
PPTX
visual field assessment in low vision
PPTX
Central and peripheral visual field
PDF
Visual Field | Humphrey Perimetry
PPTX
PPTX
Visual field basics & interpretation
PPT
COA visual field and reading notes in student
Recently uploaded
PDF
Short notes in Radiation Oncology by SCOPE
PPTX
Innovations in Chronic Pain Management: From Clinical Idea to Published Research
PPTX
VSWarehouse for Genome Centers: Scalable, Secure Whole-Genome Infrastructure ...
PDF
ATLS® Advanced Trauma Life Support.pdf. (overview), Dr Sanjab
PPTX
4.Carpal Tunnel Syndrome (CTS)compression of the median nerve. General orthop...
PPTX
Beyond Tissue Damage: How Nociplastic Pain is Reshaping Our Understanding of ...
PDF
preoperative assessment Pheochromocytoma 2025.pdf
PPTX
ADRENAL GLAND DISORDERS: A BRIEF OVERVIEW
PPTX
Using social media as a teaching learning tool in Oncology
PPTX
9.Deformities of humanbody last units of surgery I.pptx
PPTX
8.Soft Tissue Injuries unit IV. surgery I.pptx
PPTX
2026 ADA Standards of Care:Summary of Changes
PPTX
ACTIVE ASSISTED EXERCISE.pptx file by gokul
PDF
Minerals Characterization of Antibodies Medicinal Plants Using Atomic Absorpt...
PPTX
GROUP 65 PRESENTATION/PUBLIC HEALTH PRACTICUM
PPTX
Gut Microbial Metabolites as Cancer Immunomodulators
PDF
Pòster "Virtual Reality in Pain Management"
PPTX
FAMILY PLANING METHOD AND PROGRAMME IN BRIEF
PDF
Concept of Drug: Foundations of General Pharmacology
PPT
Remembering Brain Health: Targeting Modifiable Risk Factors and Early Detecti...
visual_field_exam_with_images.pptx SIMPLE 1. 2. Learning Objectives
• Define visual field and list indications for testing
• Describe bedside and formal methods
• Explain test performance and pitfalls
• Interpret common defects and localize lesions
3. Definition & Rationale
• Assessment of full area seen while fixating straight ahead
• Detects unreported visual field defects
• Localizes lesions along visual pathway
• Monitors progression of ocular/neurological diseases
4. 5. Normal Visual Field Extents
• Temporal: ~90–100°
• Nasal: ~50–60°
• Superior: ~50–60°
• Inferior: ~70–75°
6. Testing Methods Overview
• Confrontation test (bedside screen)
• Amsler grid (central vision)
• Automated perimetry (Humphrey, Octopus)
• Goldmann kinetic perimetry
7. Confrontation Test
• Seat at 1 m, occlude one eye each
• Patient fixates on examiner's nose
• Bring target from periphery to center
• Compare with examiner's field
8. Amsler Grid
• Monocular testing at 30 cm with near correction
• Fixate center dot
• Report distortions, missing, or blurred areas
9. Automated Static Perimetry
• Stationary light stimuli of varying intensity
• Common programs: 24-2, 30-2, 10-2
• Outputs: grayscale, deviation plots, indices
10. 11. Interpreting Humphrey Printout
• Grayscale: visual impression
• Total deviation vs pattern deviation
• Probability plots: statistical abnormality
• Global indices: MD, PSD, VFI
12. Goldmann Kinetic Perimetry
• Manual kinetic mapping
• Useful for peripheral fields, children, neuro cases
• Documents isopters for comparison
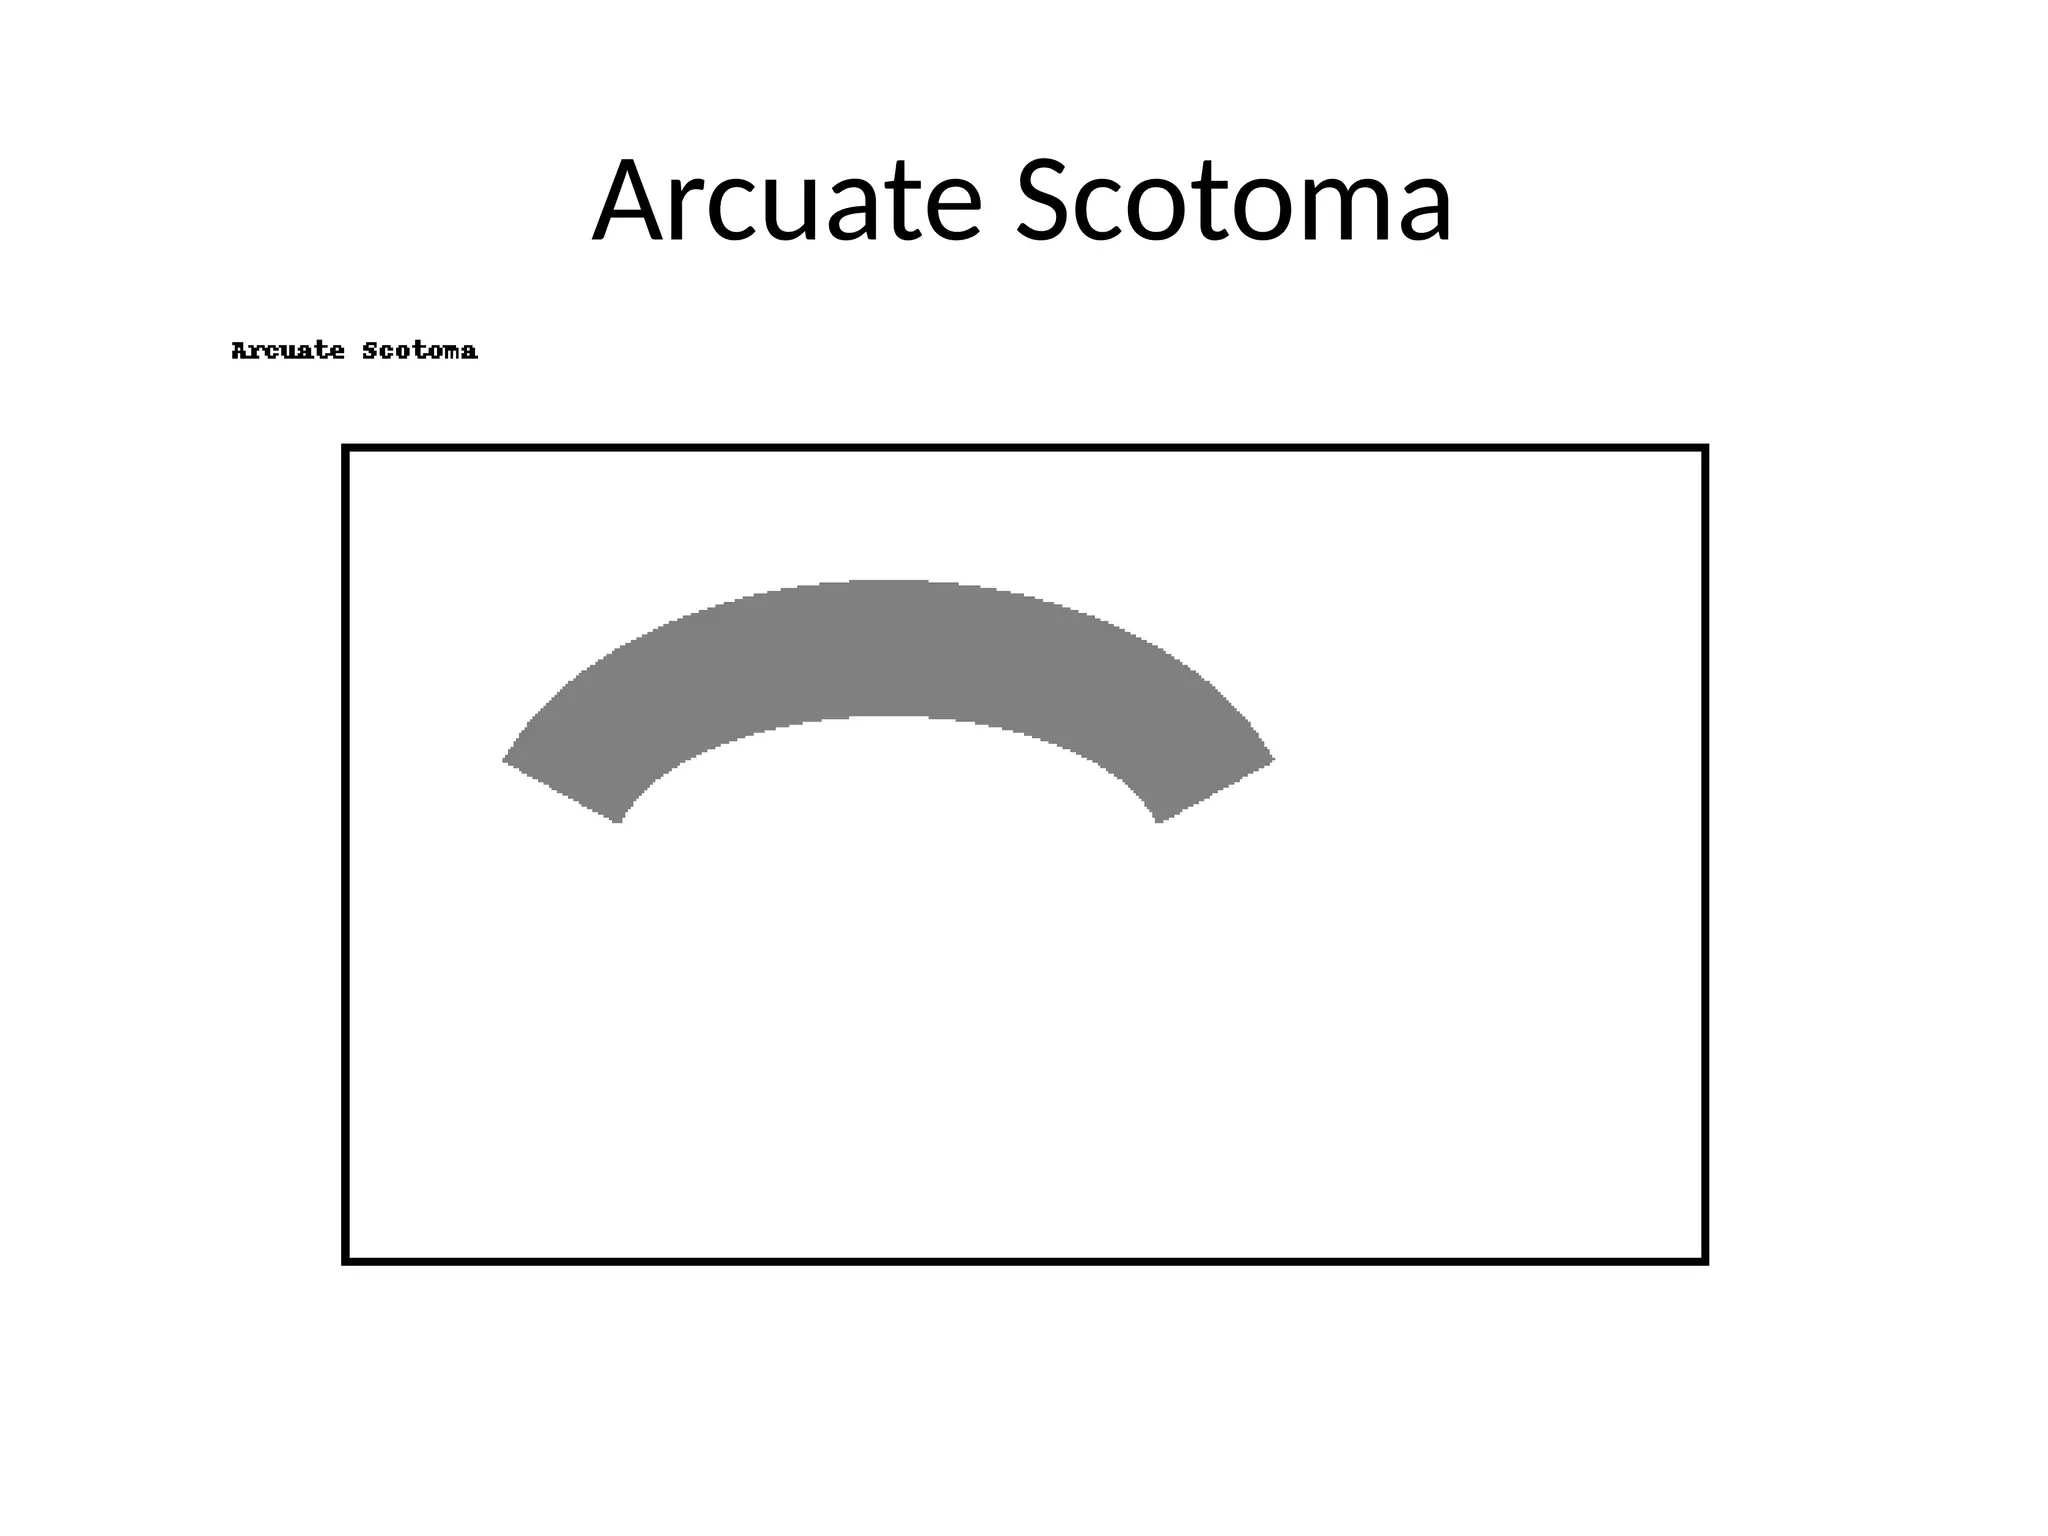
13. Common Defect Patterns
• Monocular defect: retina/optic nerve
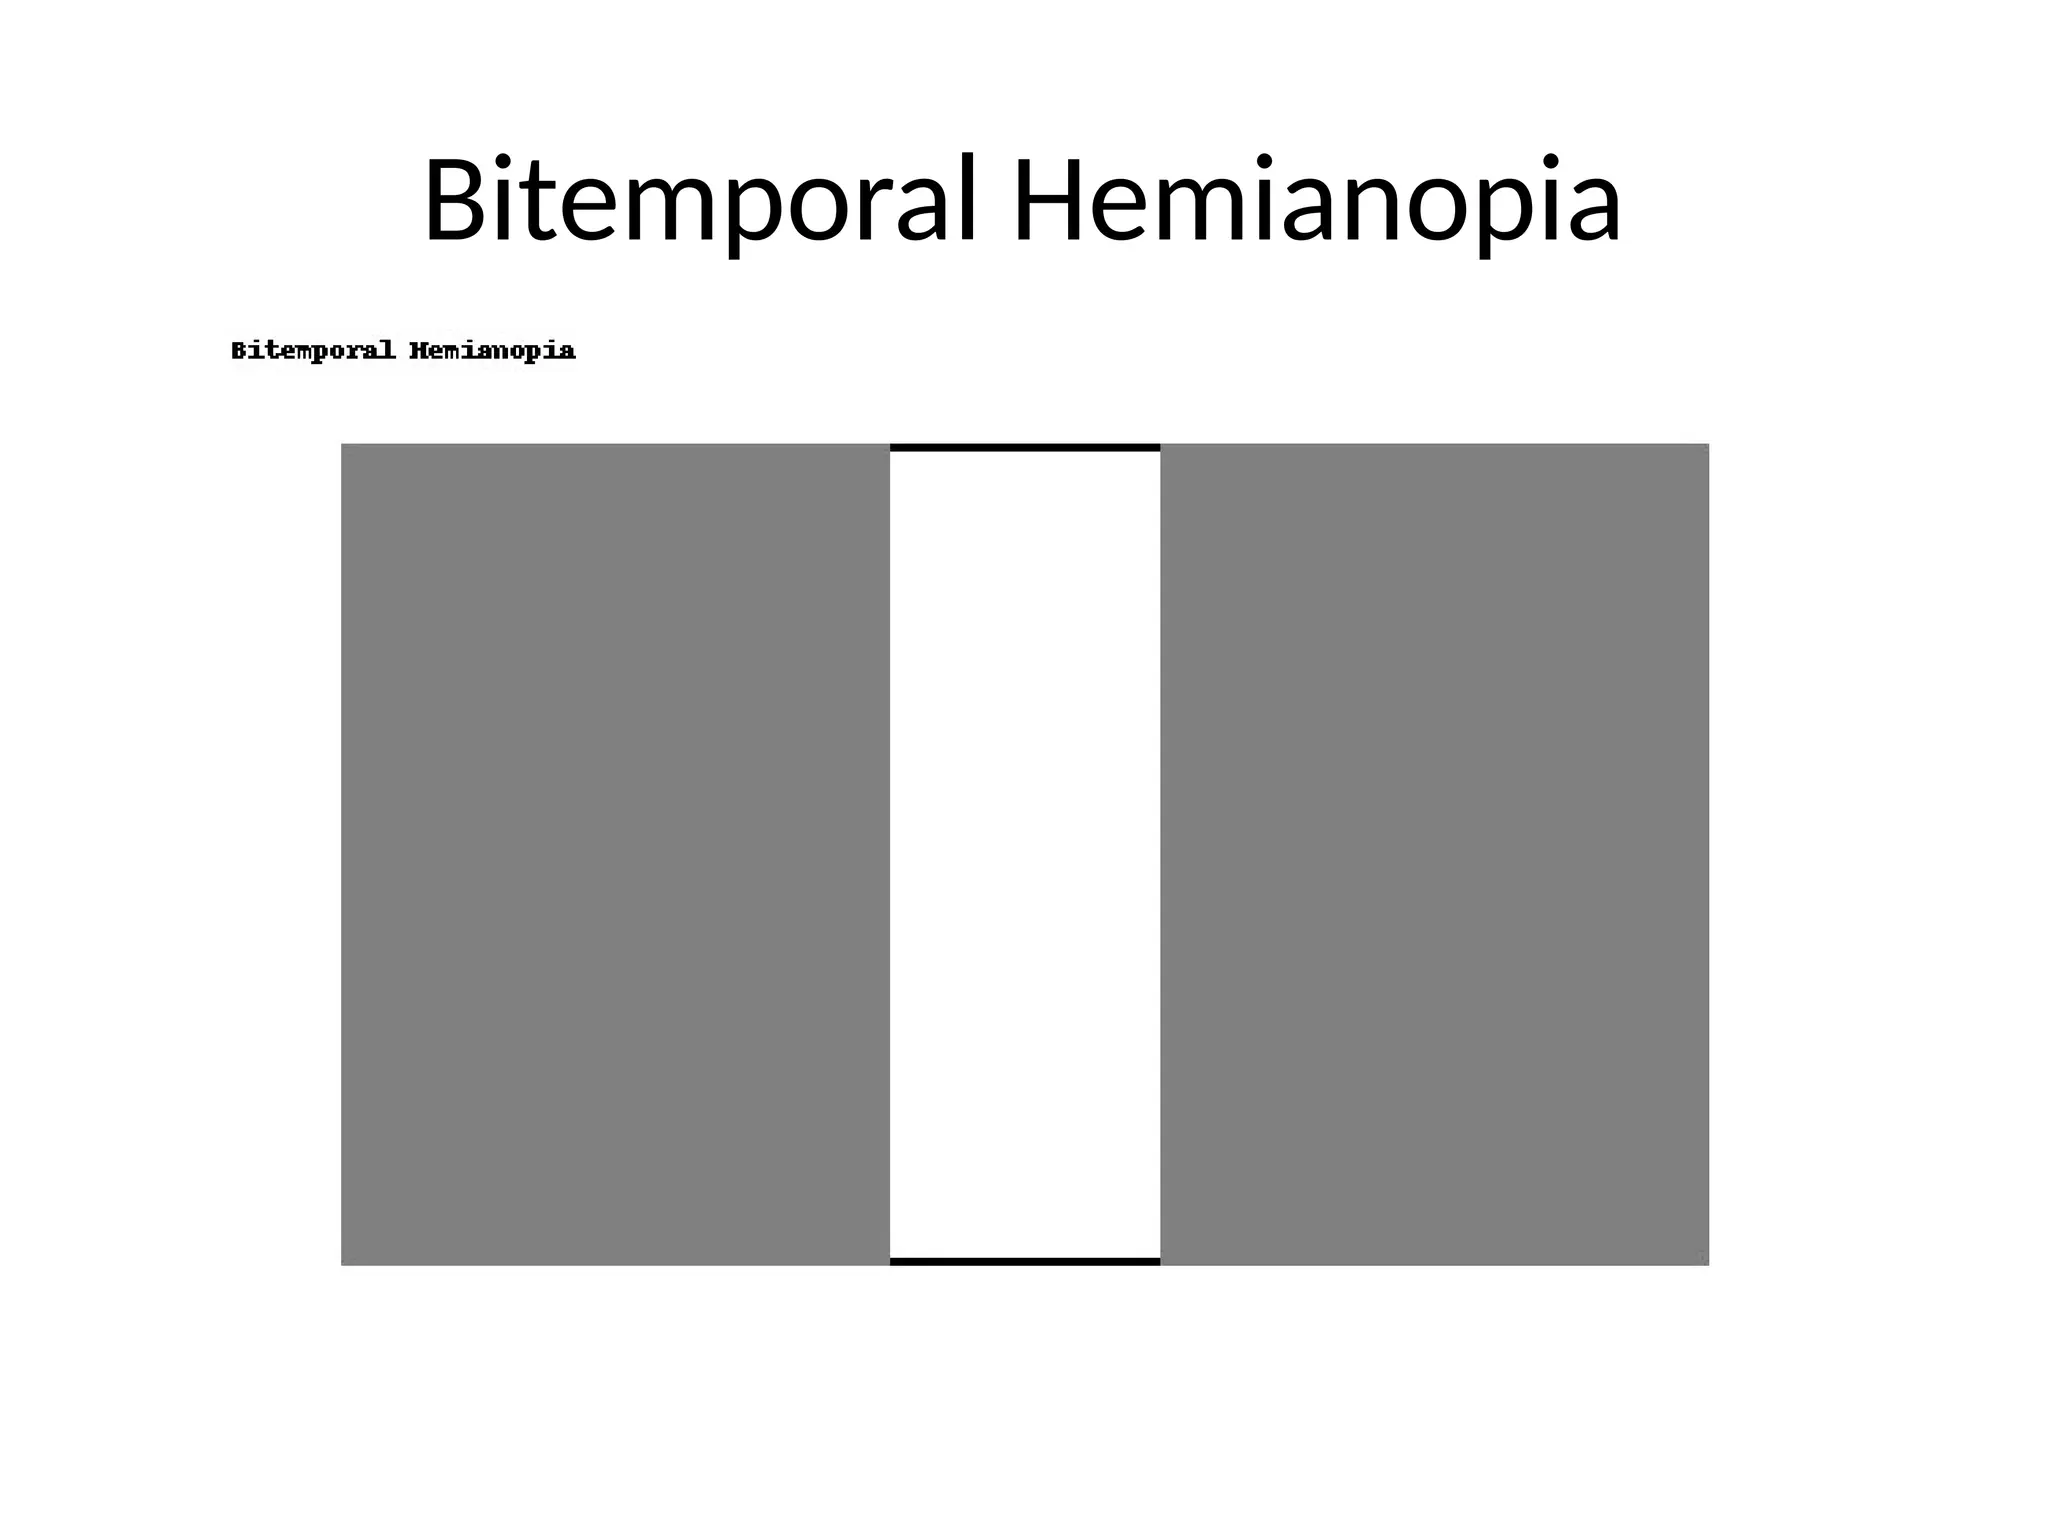
• Bitemporal hemianopia: chiasm
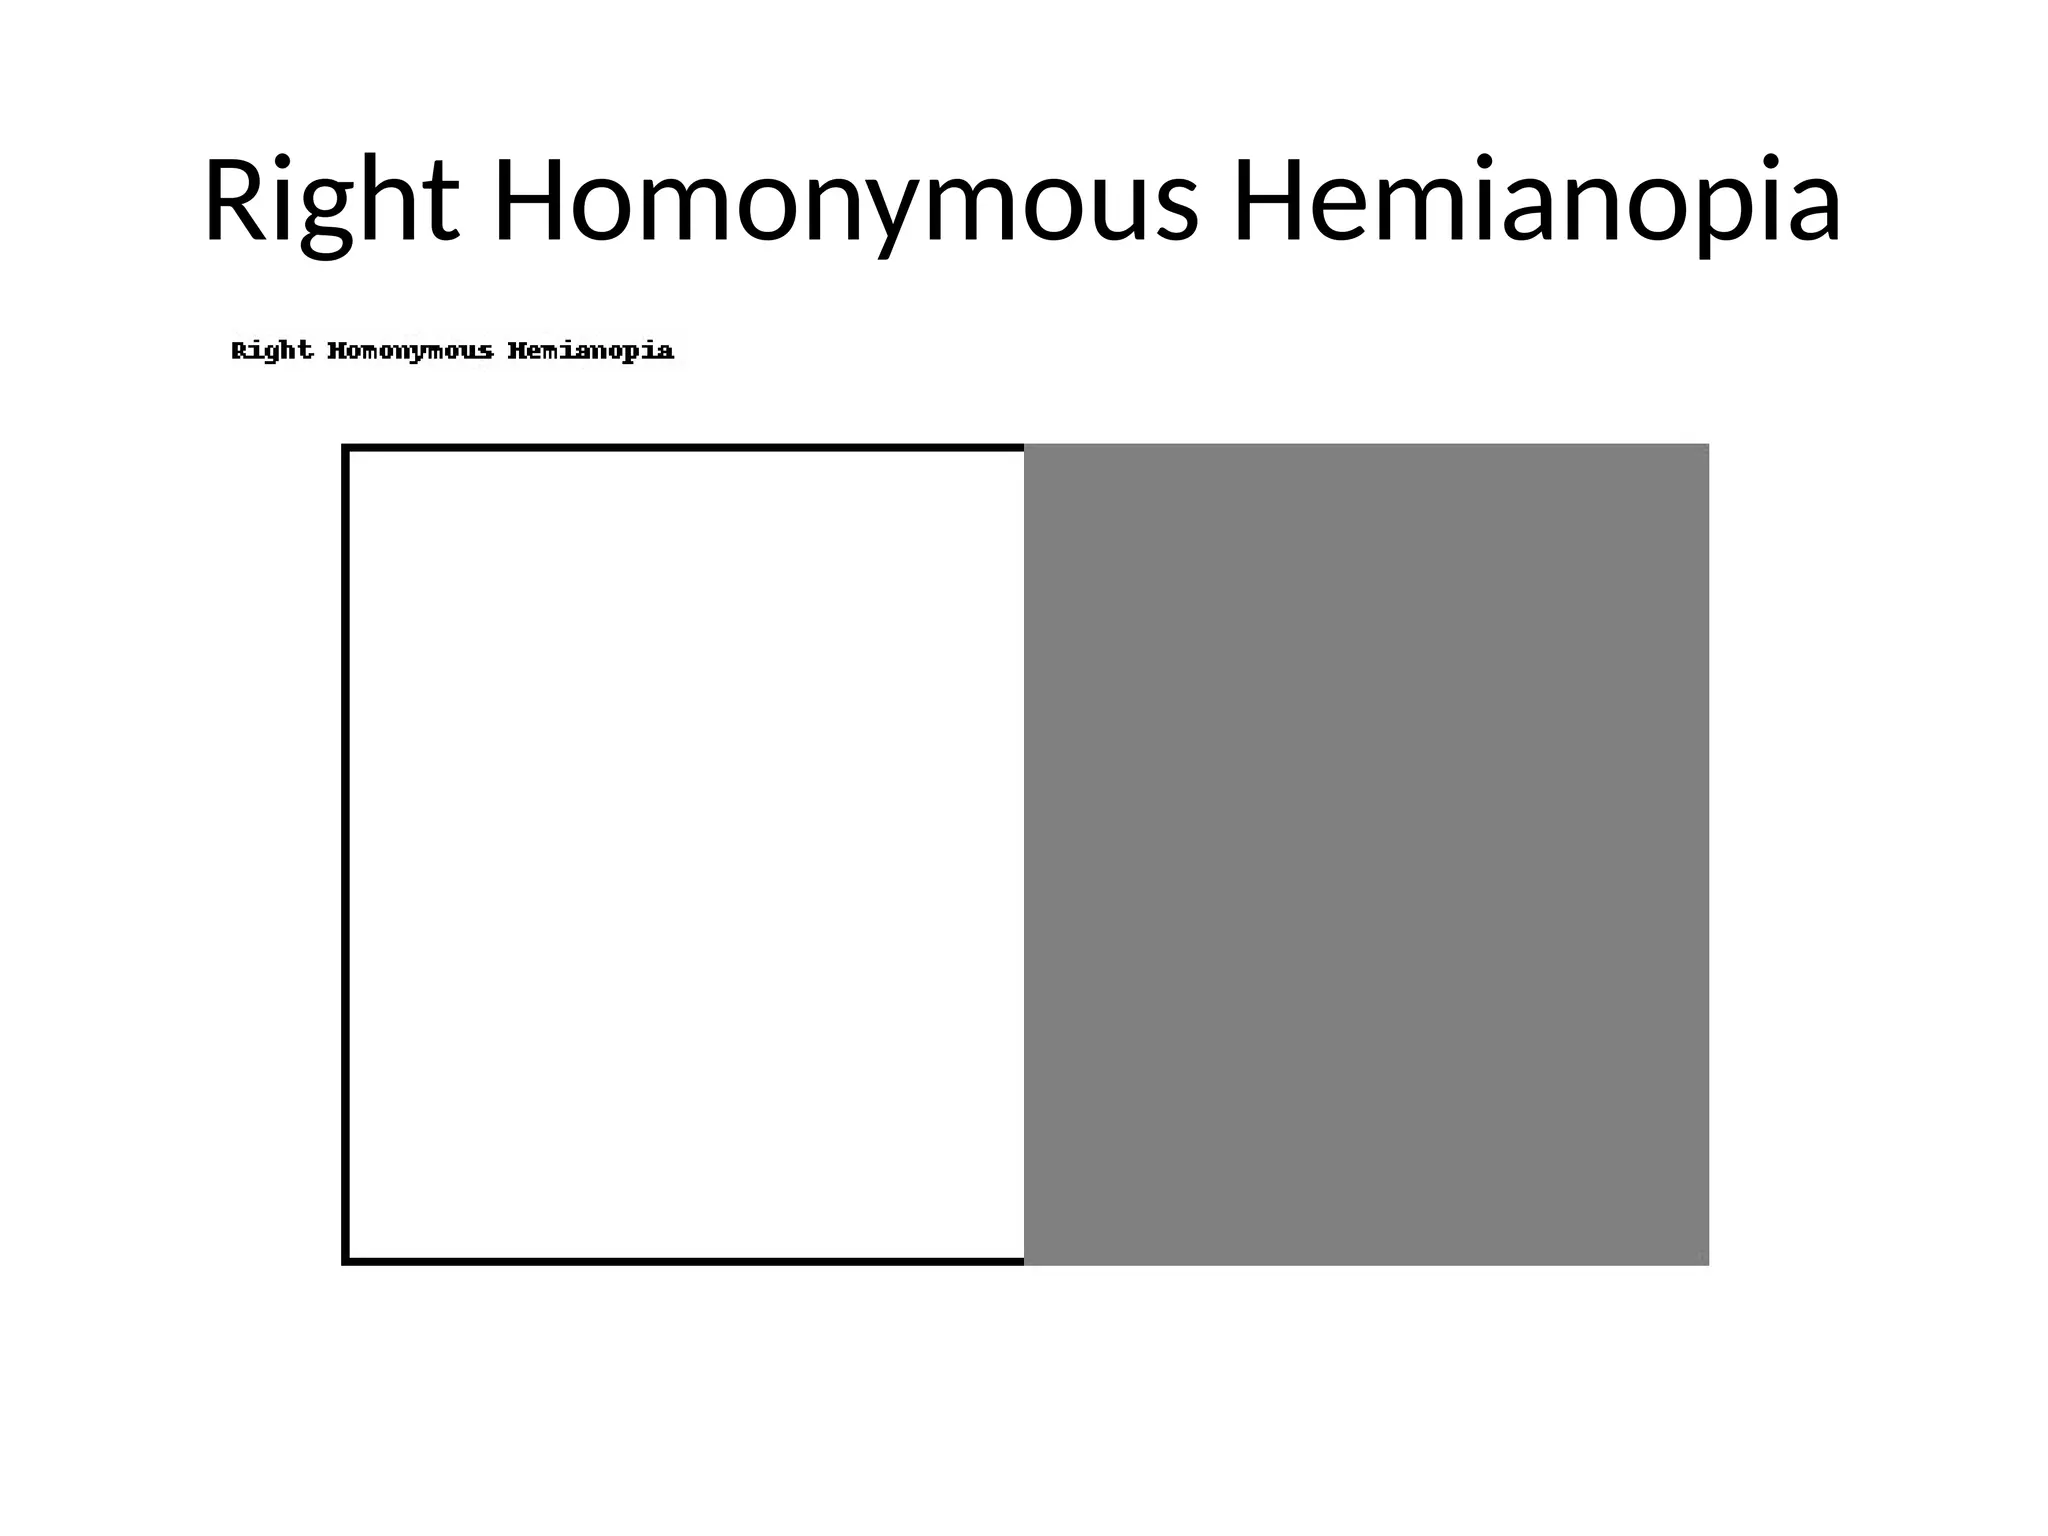
• Homonymous hemianopia: post-chiasm
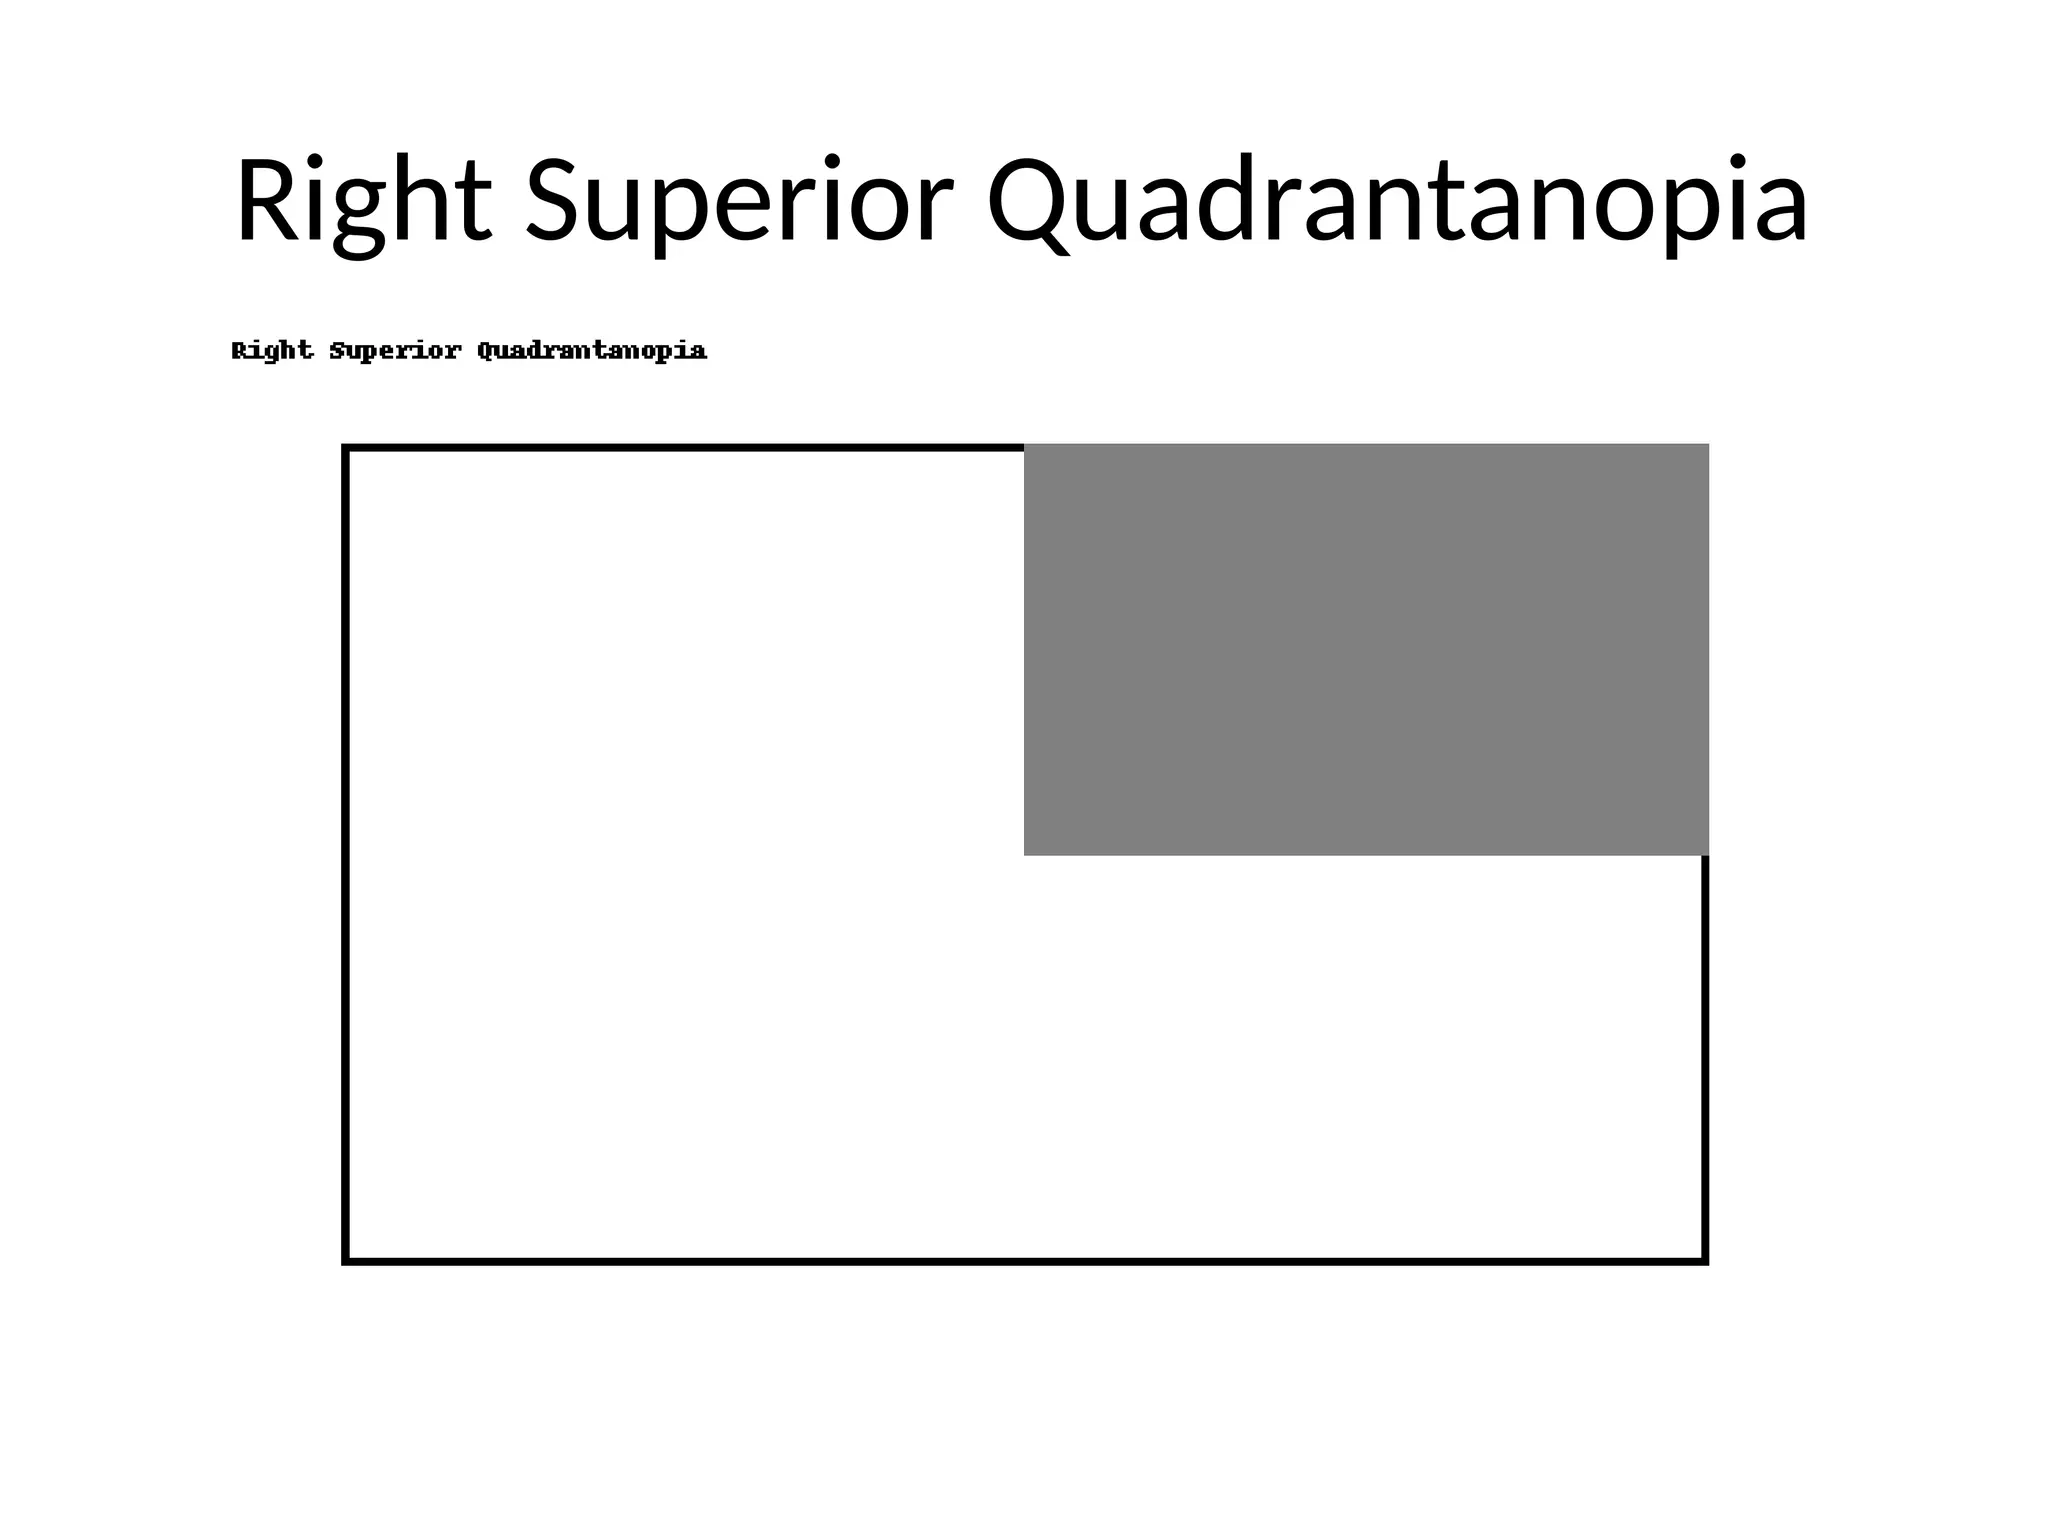
• Quadrantanopia: optic radiations
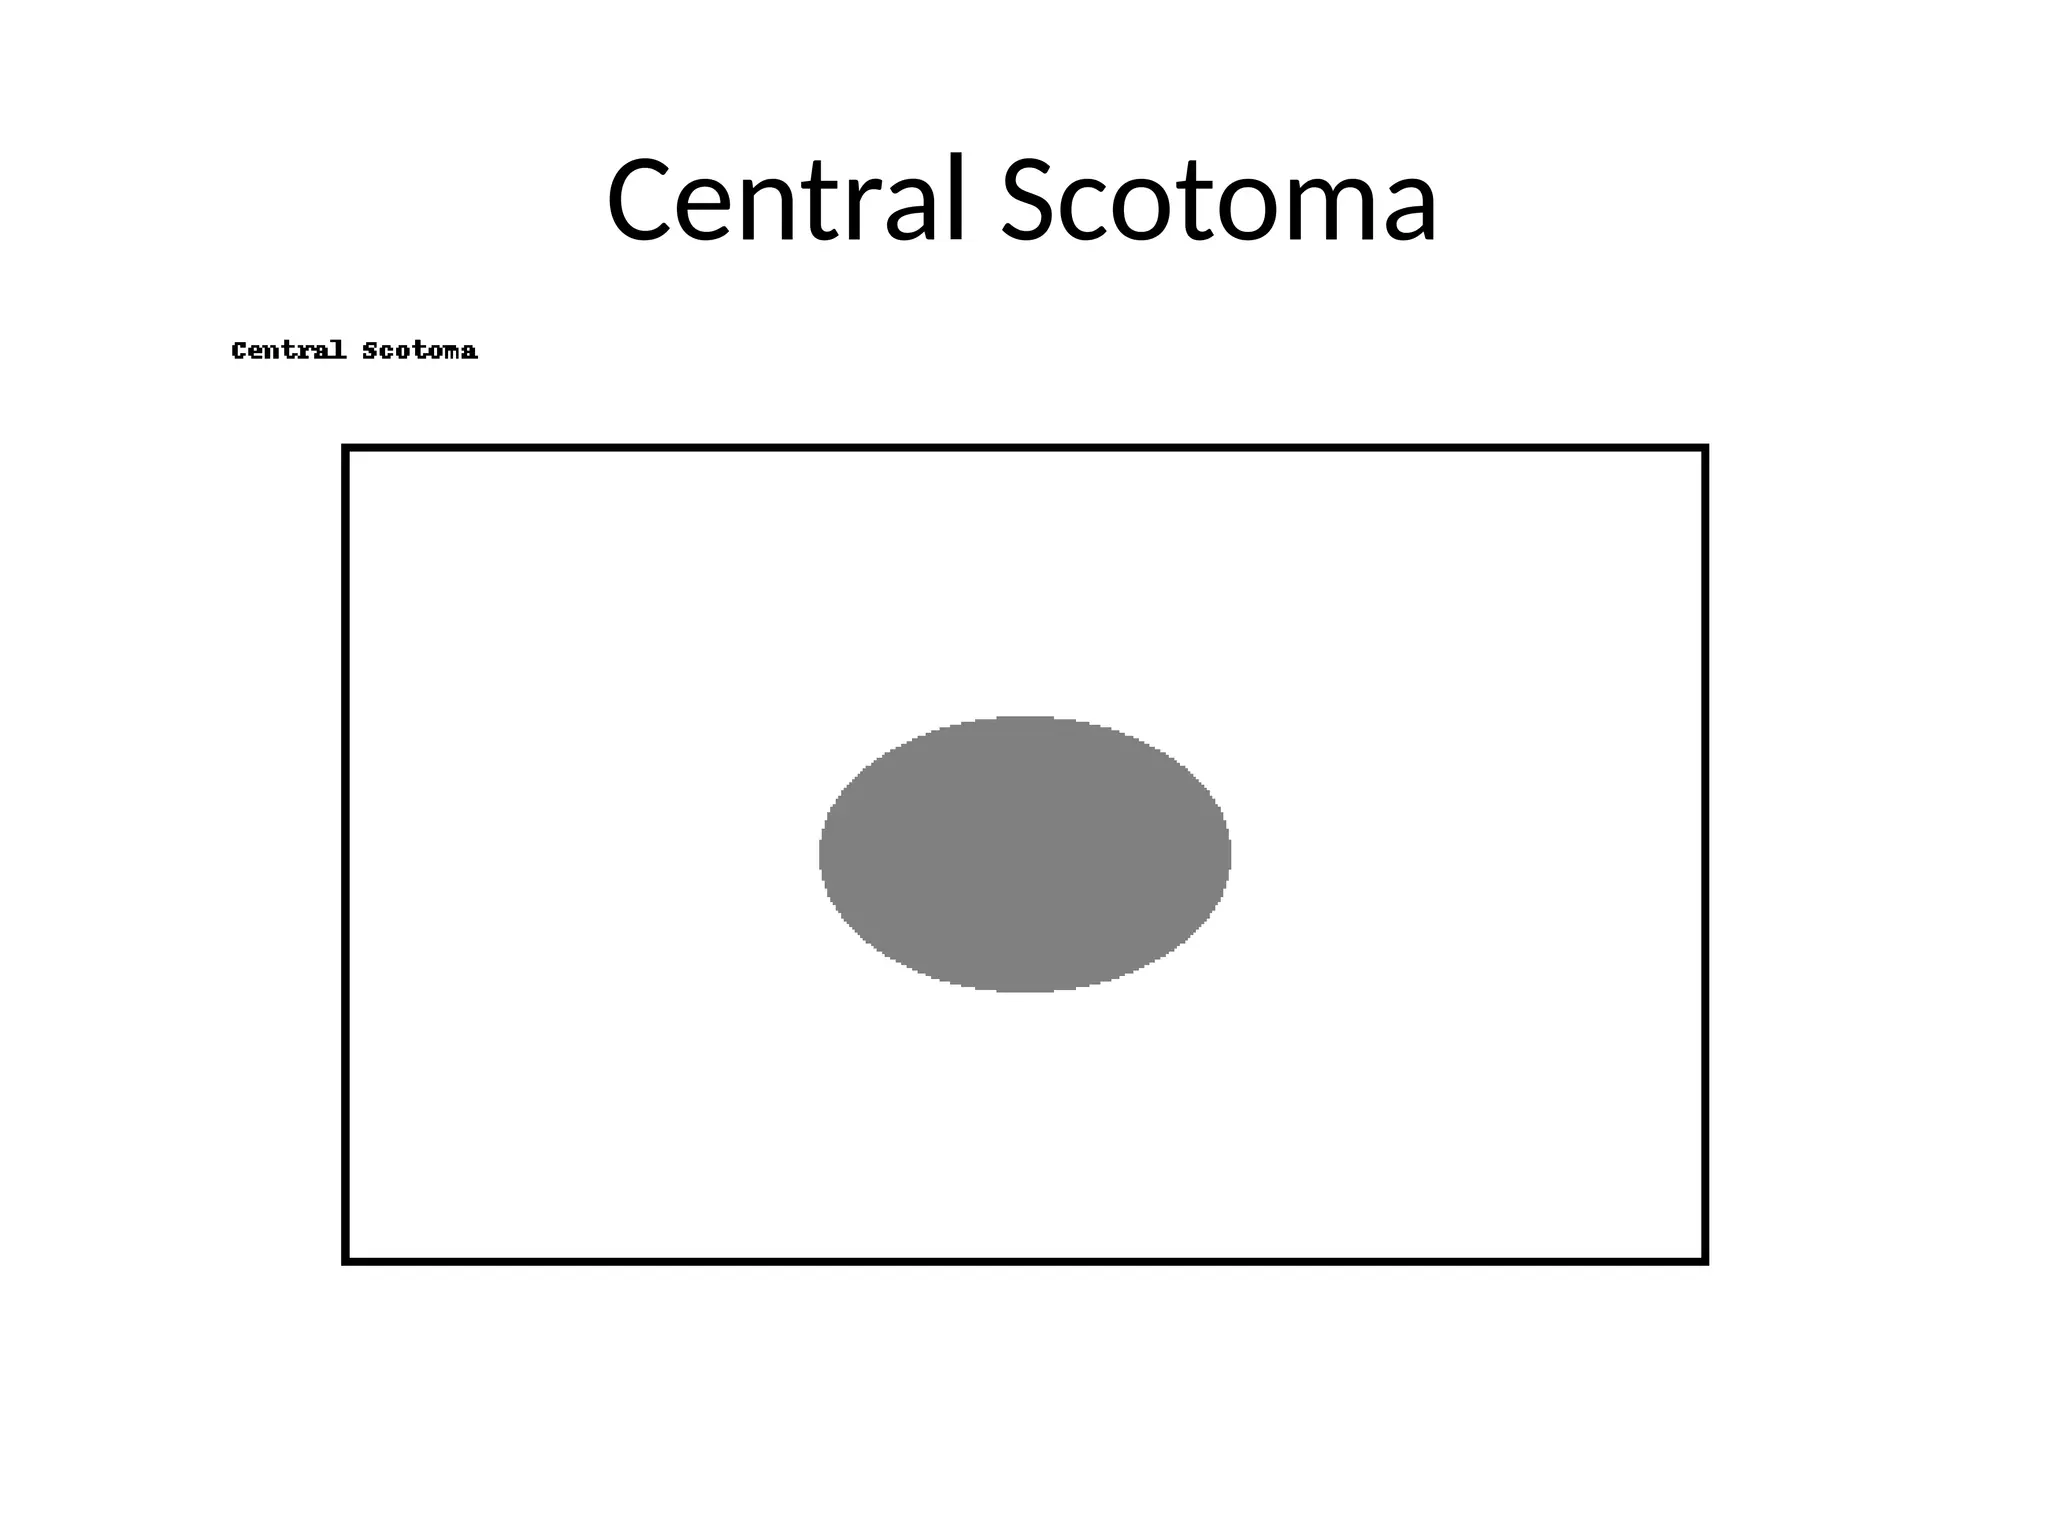
• Central scotoma: macula/optic nerve
14. 15. 16. Tips for Quality Testing
• Correct refraction for near
• Explain test & practice run
• Test when patient is alert
• Repeat baseline to reduce learning effect
17. Pitfalls & Limitations
• Confrontation misses subtle defects
• Automated perimetry needs cooperation
• Media opacities cause diffuse depression
• Inter-test variability
18. When to Order Formal Perimetry
• Abnormal confrontation
• Glaucoma suspect/monitoring
• Optic neuropathy
• Neurological signs of visual pathway lesion
19. Key Takeaways
• Essential for detecting/localizing visual pathway disease
• Choose method based on clinical need
• Interpret with anatomy & reliability in mind
• Correlate with other findings
20. 21. 22. 23. 24. Editor's Notes #2 State objectives clearly so audience knows what they'll learn. #3 Explain that defects often precede symptoms and testing is essential. #4 Insert labeled diagram here showing decussation and pathways. #5 Note variations; automated tests cover central 24–30°. #6 State when each is preferred; formal tests for diagnosis and monitoring. #7 Low sensitivity for subtle defects; still useful for quick screening. #8 Use for macular disease detection and monitoring. #9 Gold standard for glaucoma and many neuro-ophthalmic conditions. #10 Indices help judge validity; high fixation loss or FP = unreliable. #11 Show annotated printout to guide reading. #12 Operator-dependent but versatile. #13 Correlate defect patterns with lesion location. #14 Show visual field plots for each case. #15 Use consistent structured reporting for clarity. #16 These steps improve reliability and reproducibility. #17 Always correlate with history and other tests. #18 Indications for formal testing. #19 Summarize main learning points.
![Visual Pathway Anatomy
• [Diagram placeholder]
• Retina → Optic nerve → Chiasm → Tract → LGN → Radiations → Cortex](https://image.slidesharecdn.com/visualfieldexamwithimages-250815002726-ef77e9f4/75/visual_field_exam_with_images-pptx-SIMPLE-4-2048.jpg)