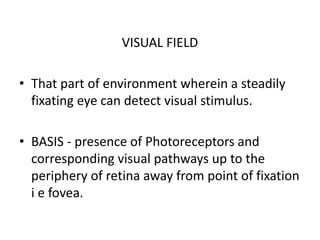
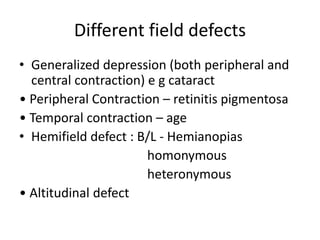
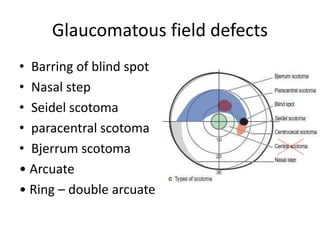
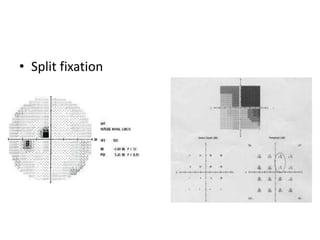
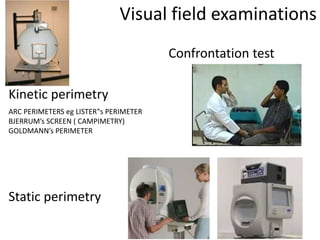
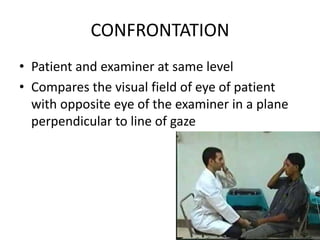
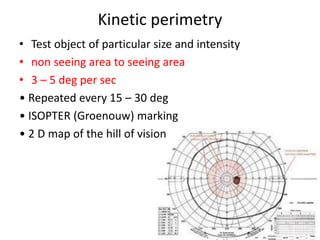
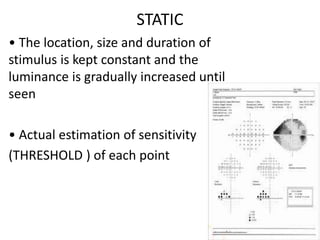
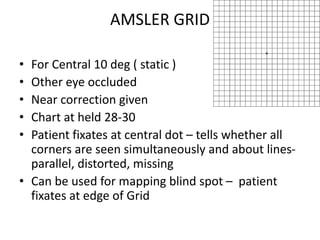
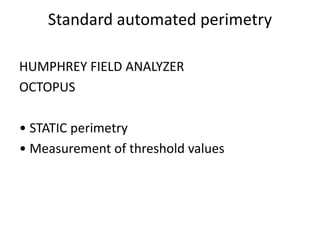
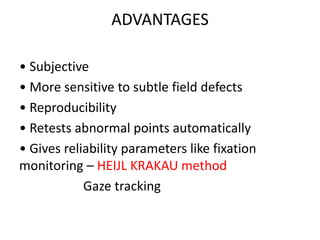
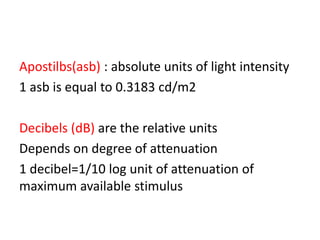
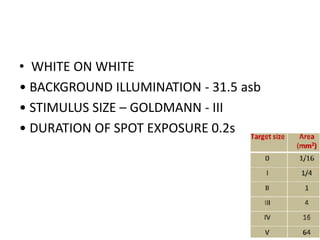
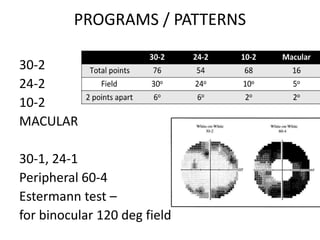
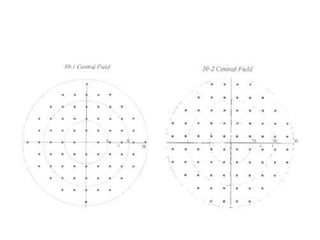
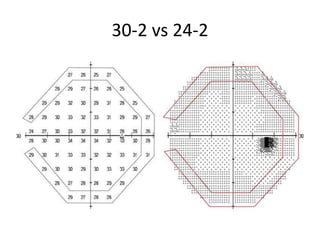
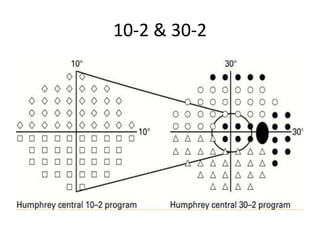
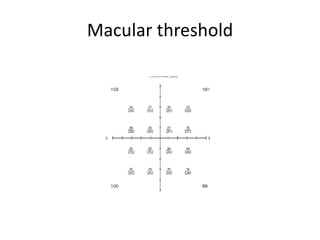
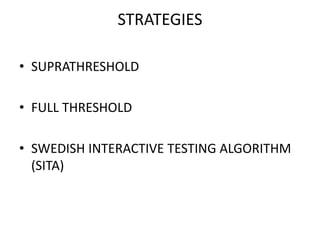
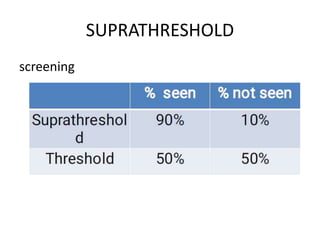
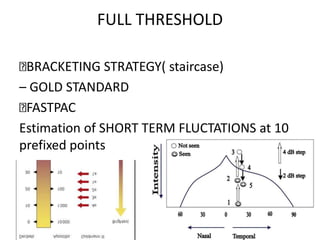
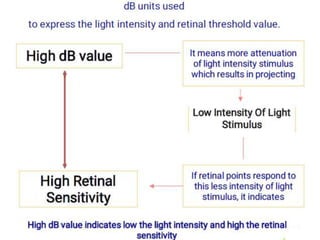
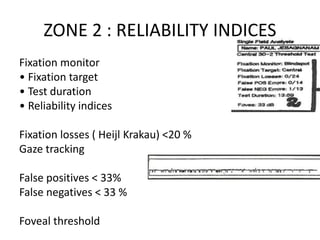
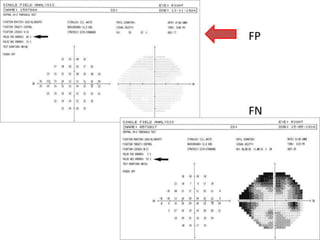
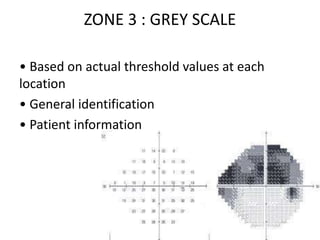
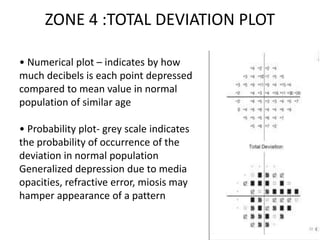
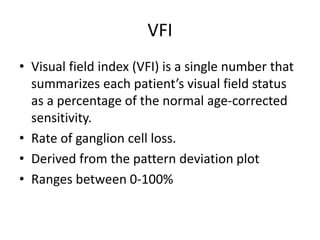
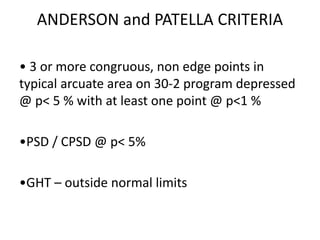
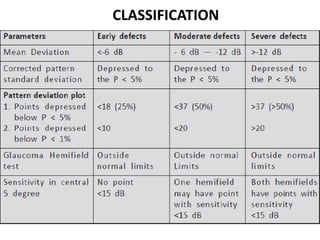
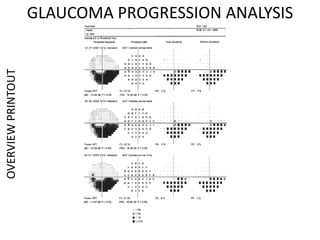
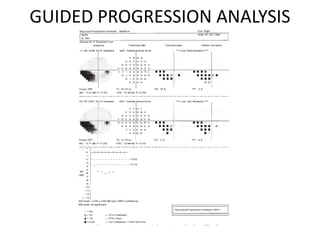
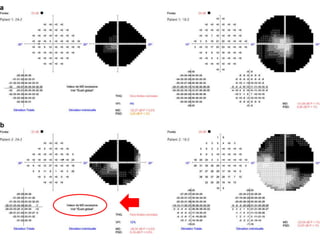
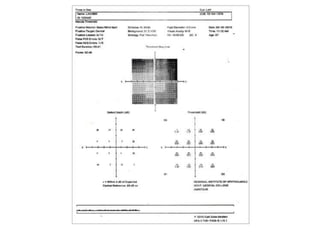
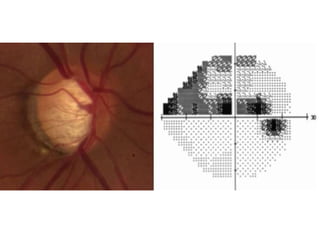
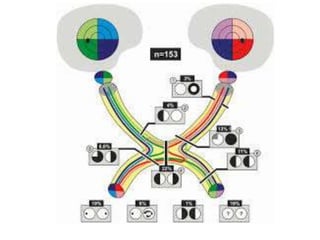
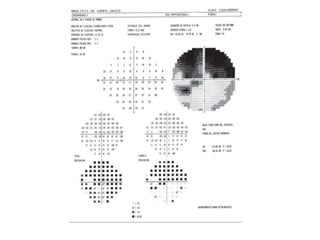
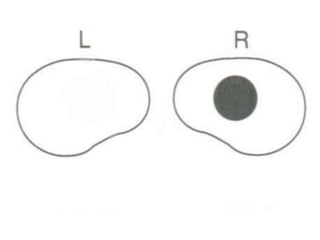
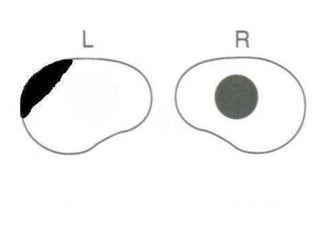
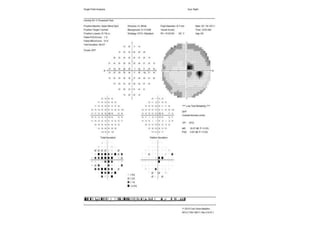
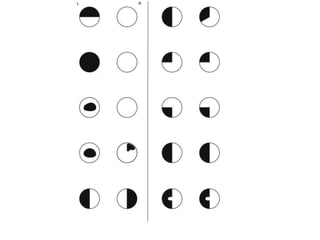
VISUAL FIELD
• That part of environment wherein a steadily
fixating eye can detect visual stimulus.
• BASIS - presence of Photoreceptors and
corresponding visual pathways up to the
periphery of retina away from point of fixation
i e fovea.
Physiological basis
DIFFERENTIAL LIGHT SENSITIVITY
Basis of most modern visual field examination
methods
TRAQUAIR – “HILL OF VISION IN THE SEA OF
DARKNESS
PHYSIOLOGICAL BLIND SPOT
• Corresponding to optic nerve head
• 15 deg temporal to point of fixation
• Span – 5 deg horizontal x 7 deg vertical
• Two thirds below the horizontal meridian
FACTORS affecting visual field
• Apparent size of spot
• Distance from eye
• Duration of stimulus
• Background illumination
• Stimulus intensity
• Contrast
• Colour
• Patient factors
Light / dark adaptation
Vision
Refractive status
Education , attentiveness, cooperation
• SCOTOMA : focal region of abnormally decreased
sensitivity surrounded by an area of normal
sensitivity
ABSOLUTE
RELATIVE
POSITIVE
NEGATIVE
• DEPRESSION : is an area of reduced sensitivity
without a surrounding area of normal sensitivity
appears as denting of isopters.
Different field defects
• Generalized depression (both peripheral and
central contraction) e g cataract
• Peripheral Contraction – retinitis pigmentosa
• Temporal contraction – age
• Hemifield defect : B/L - Hemianopias
homonymous
heteronymous
• Altitudinal defect
Normal arrangement of nerve fibers
Glaucomatous field defects
• Barring of blind spot
• Nasal step
• Seidel scotoma
• paracentral scotoma
• Bjerrum scotoma
• Arcuate
• Ring – double arcuate
• Split fixation
Visual field examinations
Confrontation test
Kinetic perimetry
Static perimetry
ARC PERIMETERS eg LISTER‟s PERIMETER
BJERRUM’s SCREEN ( CAMPIMETRY)
GOLDMANN’s PERIMETER
CONFRONTATION
• Patient and examiner at same level
• Compares the visual field of eye of patient
with opposite eye of the examiner in a plane
perpendicular to line of gaze
Kinetic perimetry
• Test object of particular size and intensity
• non seeing area to seeing area
• 3 – 5 deg per sec
• Repeated every 15 – 30 deg
• ISOPTER (Groenouw) marking
• 2 D map of the hill of vision
STATIC
• The location, size and duration of
stimulus is kept constant and the
luminance is gradually increased until
seen
• Actual estimation of sensitivity
(THRESHOLD ) of each point
AMSLER GRID
• For Central 10 deg ( static )
• Other eye occluded
• Near correction given
• Chart at held 28-30
• Patient fixates at central dot – tells whether all
corners are seen simultaneously and about lines-
parallel, distorted, missing
• Can be used for mapping blind spot – patient
fixates at edge of Grid
Standard automated perimetry
HUMPHREY FIELD ANALYZER
OCTOPUS
• STATIC perimetry
• Measurement of threshold values
ADVANTAGES
• Subjective
• More sensitive to subtle field defects
• Reproducibility
• Retests abnormal points automatically
• Gives reliability parameters like fixation
monitoring – HEIJL KRAKAU method
Gaze tracking
Apostilbs(asb) : absolute units of light intensity
1 asb is equal to 0.3183 cd/m2
Decibels (dB) are the relative units
Depends on degree of attenuation
1 decibel=1/10 log unit of attenuation of
maximum available stimulus
• WHITE ON WHITE
• BACKGROUND ILLUMINATION - 31.5 asb
• STIMULUS SIZE – GOLDMANN - III
• DURATION OF SPOT EXPOSURE 0.2s
PROGRAMS / PATTERNS
30-2
24-2
10-2
MACULAR
30-1, 24-1
Peripheral 60-4
Estermann test –
for binocular 120 deg field
30-2 vs 24-2
10-2 & 30-2
Macular threshold
STRATEGIES
• SUPRATHRESHOLD
• FULL THRESHOLD
• SWEDISH INTERACTIVE TESTING ALGORITHM
(SITA)
SUPRATHRESHOLD
screening
FULL THRESHOLD
BRACKETING STRATEGY( staircase)
– GOLD STANDARD
FASTPAC
Estimation of SHORT TERM FLUCTATIONS at 10
prefixed points
SWEDISH INTERACTIVE TESTING
ALGORITHM (SITA)
SITA algorithm developed for the Humphrey
perimeter uses a complex mathematical model to
estimate threshold values for each point based on
responses to stimuli presented at that location, as
well as information gathered from nearby locations
How it is different?
Calculations of to False POSITIVE errors and
False NEGATIVE errors in Percentage
Does not Calculate Short term-Fluctuation
Single Crossing of seeing and non seeing zones
Calculations are done after the test, so there is
less fatigue for the patient
• SITA STANDARD ( Bracketing strategy based)
• SITA FAST ( FASTPAC based)
• SITA FASTER
Analyzes patients response and responds accordingly
Decreases overall no of stimuli presented, hence test
duration
Paces the test according to patients speed
Doesn‟t estimate Short term Fluctuations
• 24-2 sita faster – 2min
Pre-requisites
• Selection of adequate test
• Proper environment
• Comfortable sitting position
• Visual acuity >3/60
• Adequate size of pupil >3mm
• Proper explanation – running of
demonstration
• Age >18 years
8 Zones
Zone 1
Patient data
• Name, DOB, eye
• Vision, refraction,
• Pupil diameter
Test data
• Date and time
• Program and strategy
• Background
illumination
• Test size, color
ZONE 2 : RELIABILITY INDICES
Fixation monitor
• Fixation target
• Test duration
• Reliability indices
Fixation losses ( Heijl Krakau) <20 %
Gaze tracking
False positives < 33%
False negatives < 33 %
Foveal threshold
FP
FN
ZONE 3 : GREY SCALE
• Based on actual threshold values at each
location
• General identification
• Patient information
ZONE 4 :TOTAL DEVIATION PLOT
• Numerical plot – indicates by how
much decibels is each point depressed
compared to mean value in normal
population of similar age
• Probability plot- grey scale indicates
the probability of occurrence of the
deviation in normal population
Generalized depression due to media
opacities, refractive error, miosis may
hamper appearance of a pattern
ZONE 5 : PATTERN DEVIATION PLOT
• Selection of the 7th best sensitivity point
for ex. If it is -5, add +5 to all the
deviations. The new resultant deviations
will form the Pattern deviation numerical
Plot.
• Numerical - calculated by adjustment for
generalized depression or elevation of
visual field
• Thus brings out pattern
• Probability plot
ZONE 6 : GLOBAL INDICES
• MEAN DEVIATION : average loss of
sensitivity from normal age matched population
along with probability calculated from total
deviation plot
• PATTERN STANDARD DEVIATION : measures
irregularity by summing the absolute value of the
difference between the threshold value for each
point and the average visual field sensitivity.
PSD= normal value for each point + MD
• SHORT TERM FLUCTUATIONS
• CORRECTED PATTERN STANDARD DEVIATION
ZONE 7 : GLAUCOMA HEMIFIELD TEST
• PLAIN ENGLISH LANGUAGE MESSAGE
• Comparison of 5 clusters of points in superior
hemifield with mirror images in inferior
hemifield.
GHT
OUTSIDE NORMAL LIMITS
all cluster pairs differ @ p < 1% OR
1 cluster pair differs @ p < 0.5%
BORDERLINE
hemifields differ @ p < 3%
GENERAL REDUCTION OF SENSITIVITY
overall field depressed @ p < 0.5%
ABNORMAL HIGH SENSITIVITY
overall field elevated( best 15 % points)
@ p < 0.5 %
WITHIN NORMAL LIMITS
VFI
• Visual field index (VFI) is a single number that
summarizes each patient’s visual field status
as a percentage of the normal age-corrected
sensitivity.
• Rate of ganglion cell loss.
• Derived from the pattern deviation plot
• Ranges between 0-100%
Zone 8: RAW DATA
ANDERSON and PATELLA CRITERIA
• 3 or more congruous, non edge points in
typical arcuate area on 30-2 program depressed
@ p< 5 % with at least one point @ p<1 %
•PSD / CPSD @ p< 5%
•GHT – outside normal limits
CLASSIFICATION
GLAUCOMA PROGRESSION ANALYSISOVERVIEWPRINTOUT
GUIDED PROGRESSION ANALYSIS
SHORT WAVELENGTH AUTOMATED
PERIMETERY
• “BLUE ON YELLOW”
• detects glaucomatous defects 3-5 years earlier
than SAP
• high fluctuation rates
FREQUENCY DOUBLING
PERIMETRY
• Based on frequency doubling illusion
• Test stimulus – series of white and black bands
flickering at 25 Hz ( low spatial frequency &
high temporal frequency)
• Detects damage to Magnocellular Ganglion
cells
RANDOM DOT MOTION PERIMETRY
Patient has to tell direction in which dots are
moving
HIGH PASS RESOLUTION PERIMETRY
Test resolution and not mere threshold
detection
ARTEFACTS
• OBSTRUCTION
RIM ARTEFACTS
PTOSIS
MEDIA OPACITIES
• MIOSIS
• REFRACTION ARTEFACTS
• High power plus and minus lenses
PTOSIS
GLAUCOMATOUS FIELD DEFECTS
NEUROLOGICAL FIELD DEFECTS
Visual field examination

Visual field examination

  • 2.
    VISUAL FIELD • Thatpart of environment wherein a steadily fixating eye can detect visual stimulus. • BASIS - presence of Photoreceptors and corresponding visual pathways up to the periphery of retina away from point of fixation i e fovea.
  • 4.
    Physiological basis DIFFERENTIAL LIGHTSENSITIVITY Basis of most modern visual field examination methods TRAQUAIR – “HILL OF VISION IN THE SEA OF DARKNESS
  • 5.
    PHYSIOLOGICAL BLIND SPOT •Corresponding to optic nerve head • 15 deg temporal to point of fixation • Span – 5 deg horizontal x 7 deg vertical • Two thirds below the horizontal meridian
  • 6.
    FACTORS affecting visualfield • Apparent size of spot • Distance from eye • Duration of stimulus • Background illumination • Stimulus intensity • Contrast • Colour • Patient factors Light / dark adaptation Vision Refractive status Education , attentiveness, cooperation
  • 7.
    • SCOTOMA :focal region of abnormally decreased sensitivity surrounded by an area of normal sensitivity ABSOLUTE RELATIVE POSITIVE NEGATIVE • DEPRESSION : is an area of reduced sensitivity without a surrounding area of normal sensitivity appears as denting of isopters.
  • 8.
    Different field defects •Generalized depression (both peripheral and central contraction) e g cataract • Peripheral Contraction – retinitis pigmentosa • Temporal contraction – age • Hemifield defect : B/L - Hemianopias homonymous heteronymous • Altitudinal defect
  • 9.
  • 10.
    Glaucomatous field defects •Barring of blind spot • Nasal step • Seidel scotoma • paracentral scotoma • Bjerrum scotoma • Arcuate • Ring – double arcuate
  • 11.
  • 12.
    Visual field examinations Confrontationtest Kinetic perimetry Static perimetry ARC PERIMETERS eg LISTER‟s PERIMETER BJERRUM’s SCREEN ( CAMPIMETRY) GOLDMANN’s PERIMETER
  • 13.
    CONFRONTATION • Patient andexaminer at same level • Compares the visual field of eye of patient with opposite eye of the examiner in a plane perpendicular to line of gaze
  • 14.
    Kinetic perimetry • Testobject of particular size and intensity • non seeing area to seeing area • 3 – 5 deg per sec • Repeated every 15 – 30 deg • ISOPTER (Groenouw) marking • 2 D map of the hill of vision
  • 15.
    STATIC • The location,size and duration of stimulus is kept constant and the luminance is gradually increased until seen • Actual estimation of sensitivity (THRESHOLD ) of each point
  • 16.
    AMSLER GRID • ForCentral 10 deg ( static ) • Other eye occluded • Near correction given • Chart at held 28-30 • Patient fixates at central dot – tells whether all corners are seen simultaneously and about lines- parallel, distorted, missing • Can be used for mapping blind spot – patient fixates at edge of Grid
  • 17.
    Standard automated perimetry HUMPHREYFIELD ANALYZER OCTOPUS • STATIC perimetry • Measurement of threshold values
  • 18.
    ADVANTAGES • Subjective • Moresensitive to subtle field defects • Reproducibility • Retests abnormal points automatically • Gives reliability parameters like fixation monitoring – HEIJL KRAKAU method Gaze tracking
  • 19.
    Apostilbs(asb) : absoluteunits of light intensity 1 asb is equal to 0.3183 cd/m2 Decibels (dB) are the relative units Depends on degree of attenuation 1 decibel=1/10 log unit of attenuation of maximum available stimulus
  • 20.
    • WHITE ONWHITE • BACKGROUND ILLUMINATION - 31.5 asb • STIMULUS SIZE – GOLDMANN - III • DURATION OF SPOT EXPOSURE 0.2s
  • 21.
    PROGRAMS / PATTERNS 30-2 24-2 10-2 MACULAR 30-1,24-1 Peripheral 60-4 Estermann test – for binocular 120 deg field
  • 23.
  • 24.
  • 25.
  • 26.
    STRATEGIES • SUPRATHRESHOLD • FULLTHRESHOLD • SWEDISH INTERACTIVE TESTING ALGORITHM (SITA)
  • 27.
  • 28.
    FULL THRESHOLD BRACKETING STRATEGY(staircase) – GOLD STANDARD FASTPAC Estimation of SHORT TERM FLUCTATIONS at 10 prefixed points
  • 31.
    SWEDISH INTERACTIVE TESTING ALGORITHM(SITA) SITA algorithm developed for the Humphrey perimeter uses a complex mathematical model to estimate threshold values for each point based on responses to stimuli presented at that location, as well as information gathered from nearby locations
  • 32.
    How it isdifferent? Calculations of to False POSITIVE errors and False NEGATIVE errors in Percentage Does not Calculate Short term-Fluctuation Single Crossing of seeing and non seeing zones Calculations are done after the test, so there is less fatigue for the patient
  • 33.
    • SITA STANDARD( Bracketing strategy based) • SITA FAST ( FASTPAC based) • SITA FASTER Analyzes patients response and responds accordingly Decreases overall no of stimuli presented, hence test duration Paces the test according to patients speed Doesn‟t estimate Short term Fluctuations
  • 34.
    • 24-2 sitafaster – 2min
  • 35.
    Pre-requisites • Selection ofadequate test • Proper environment • Comfortable sitting position • Visual acuity >3/60 • Adequate size of pupil >3mm • Proper explanation – running of demonstration • Age >18 years
  • 36.
  • 37.
    Zone 1 Patient data •Name, DOB, eye • Vision, refraction, • Pupil diameter Test data • Date and time • Program and strategy • Background illumination • Test size, color
  • 38.
    ZONE 2 :RELIABILITY INDICES Fixation monitor • Fixation target • Test duration • Reliability indices Fixation losses ( Heijl Krakau) <20 % Gaze tracking False positives < 33% False negatives < 33 % Foveal threshold
  • 39.
  • 40.
    ZONE 3 :GREY SCALE • Based on actual threshold values at each location • General identification • Patient information
  • 41.
    ZONE 4 :TOTALDEVIATION PLOT • Numerical plot – indicates by how much decibels is each point depressed compared to mean value in normal population of similar age • Probability plot- grey scale indicates the probability of occurrence of the deviation in normal population Generalized depression due to media opacities, refractive error, miosis may hamper appearance of a pattern
  • 42.
    ZONE 5 :PATTERN DEVIATION PLOT • Selection of the 7th best sensitivity point for ex. If it is -5, add +5 to all the deviations. The new resultant deviations will form the Pattern deviation numerical Plot. • Numerical - calculated by adjustment for generalized depression or elevation of visual field • Thus brings out pattern • Probability plot
  • 43.
    ZONE 6 :GLOBAL INDICES • MEAN DEVIATION : average loss of sensitivity from normal age matched population along with probability calculated from total deviation plot • PATTERN STANDARD DEVIATION : measures irregularity by summing the absolute value of the difference between the threshold value for each point and the average visual field sensitivity. PSD= normal value for each point + MD • SHORT TERM FLUCTUATIONS • CORRECTED PATTERN STANDARD DEVIATION
  • 44.
    ZONE 7 :GLAUCOMA HEMIFIELD TEST • PLAIN ENGLISH LANGUAGE MESSAGE • Comparison of 5 clusters of points in superior hemifield with mirror images in inferior hemifield.
  • 45.
    GHT OUTSIDE NORMAL LIMITS allcluster pairs differ @ p < 1% OR 1 cluster pair differs @ p < 0.5% BORDERLINE hemifields differ @ p < 3% GENERAL REDUCTION OF SENSITIVITY overall field depressed @ p < 0.5% ABNORMAL HIGH SENSITIVITY overall field elevated( best 15 % points) @ p < 0.5 % WITHIN NORMAL LIMITS
  • 46.
    VFI • Visual fieldindex (VFI) is a single number that summarizes each patient’s visual field status as a percentage of the normal age-corrected sensitivity. • Rate of ganglion cell loss. • Derived from the pattern deviation plot • Ranges between 0-100%
  • 47.
  • 48.
    ANDERSON and PATELLACRITERIA • 3 or more congruous, non edge points in typical arcuate area on 30-2 program depressed @ p< 5 % with at least one point @ p<1 % •PSD / CPSD @ p< 5% •GHT – outside normal limits
  • 49.
  • 50.
  • 51.
  • 52.
    SHORT WAVELENGTH AUTOMATED PERIMETERY •“BLUE ON YELLOW” • detects glaucomatous defects 3-5 years earlier than SAP • high fluctuation rates
  • 53.
    FREQUENCY DOUBLING PERIMETRY • Basedon frequency doubling illusion • Test stimulus – series of white and black bands flickering at 25 Hz ( low spatial frequency & high temporal frequency) • Detects damage to Magnocellular Ganglion cells
  • 54.
    RANDOM DOT MOTIONPERIMETRY Patient has to tell direction in which dots are moving HIGH PASS RESOLUTION PERIMETRY Test resolution and not mere threshold detection
  • 57.
    ARTEFACTS • OBSTRUCTION RIM ARTEFACTS PTOSIS MEDIAOPACITIES • MIOSIS • REFRACTION ARTEFACTS • High power plus and minus lenses
  • 61.
  • 62.
  • 68.