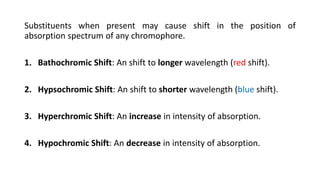
The current presentation explains basics of chromophore and auxochrome concept, types of absorption shift, effect of solvent, its polarity and effect of conjugation on absorption in uv-visible spectroscopy.
This document provides an overview of UV-Visible spectroscopy. It discusses how UV radiation causes electronic transitions in molecules, which can be observed via absorption spectroscopy. The instrumentation used includes sources of UV and visible light, a monochromator to select wavelengths, and a detector. Samples are dissolved and placed in transparent cuvettes for analysis. Spectra are recorded as absorbances and show absorption bands corresponding to electronic transitions. UV-Vis is useful for structure elucidation and quantitative analysis.
This document discusses chromophores, which are groups that absorb electromagnetic radiation in the UV or visible region and impart color to compounds. It defines chromophores and provides examples such as C=C and C=O groups. Chromophores can be independent, requiring only one group to impart color, or dependent, requiring more than one group. The document also discusses auxochromes, which are groups that alter the wavelength and intensity of light absorbed by chromophores. It gives examples of how auxochromes can cause bathochromic, hypsochromic, hyperchromic, or hypochromic shifts in absorption.
The coupling constant is the distance between peaks in a multiplet in NMR spectroscopy. It is measured in Hertz and does not depend on external magnetic field strength. The value of the coupling constant provides information to distinguish multiplets and can indicate structural features like cis/trans isomers. Coupling occurs between protons close in space, known as geminal, vicinal, and sometimes long-range coupling over several bonds. The coupling constant is affected by factors like bond angle, dihedral angle, and electronegativity of substituents.
The document discusses measuring the molar extinction coefficient of protoporphyrin IX (PPIX) films deposited on titanium dioxide (TiO2) using different solvents. It defines molar extinction coefficient and how it relates to light absorption.Graphs show extinction coefficient values of 1.49x10⁵ M-1cm-1 for PPIX/TiO2 in DMF, 1.15x10⁵ M-1cm-1 in THF, and 1.26x10⁵ M-1cm-1 in a t-butanol:acetonitrile mix. DMF yielded the highest value. The extinction coefficient determines light harvesting efficiency and dye-sensitized solar cell performance.
Fluorescence spectroscopy involves three main processes: excitation, where a molecule absorbs a photon and reaches an excited state; internal conversion and vibrational relaxation in the excited state; and fluorescence emission, where the molecule returns to the ground state and emits a photon. It has many applications including structural elucidation of molecules, monitoring molecular interactions and conformational changes, and tracking ions and biomolecules in cells. Specifically, intrinsic protein fluorescence relies on tryptophan residues, while extrinsic labels are often used for non-fluorescent compounds. Fluorescence resonance energy transfer (FRET) also allows measuring distances between fluorophores to study biomolecular interactions and conformational dynamics.
Optical rotatory dispersion (ORD) is the variation in optical rotation of a substance with changing wavelength of light. ORD can determine the absolute configuration of chiral molecules like metal complexes. It works by measuring how fast left and right circularly polarized light travels through a sample. A polarimeter measures the optical rotation as a function of wavelength in ORD spectroscopy. Key effects seen in ORD spectra include the Cotton effect, where peaks and troughs appear near absorption bands due to differences in how left and right polarized light interact with chiral molecules. ORD can be used to analyze chiral compounds and determine their stereochemistry.
This document discusses absorption laws, chromophores, and limitations in ultraviolet-visible spectroscopy. It describes Beer's law and Lambert's law, which state that absorbance is directly proportional to concentration and path length. Deviations from these laws can occur. Chromophores are groups that absorb specific wavelengths, while auxochromes induce bathochromic shifts. Substituents can cause bathochromic, hypsochromic, hyperchromic, or hypochromic shifts in absorption. UV-Vis spectroscopy has many applications in qualitative and quantitative analysis.
Fluorescence spectroscopy involves using ultraviolet light to excite electrons in molecules, causing them to emit visible light. The emitted light has a longer wavelength than the absorbed light. Fluorimeters are used to measure fluorescence, exciting samples at an absorption wavelength and measuring emission at a longer fluorescence wavelength. Fluorescence spectroscopy is useful for applications like determining fluorescent drugs in formulations, carrying out limit tests for fluorescent impurities, and studying drug-protein binding in bioanalysis.
Principle and instrumentation of UV-visible spectrophotometer.Protik Biswas
UV-visible spectrophotometry uses light in the ultraviolet and visible range to analyze substances. When light passes through a sample, some is absorbed and some is transmitted. The ratio of light entering versus exiting the sample is used to calculate absorbance, which follows Beer's Law - absorbance is directly proportional to concentration. A spectrophotometer consists of a light source, monochromator to isolate wavelengths, sample holder, and detector to measure transmitted light intensity and thus absorbance. This allows analysis of concentration for substances that absorb specific wavelengths of UV or visible light.
The document discusses the nuclear Overhauser effect (NOE), which occurs when two protons are in close proximity within a molecule. Irradiating one proton perturbs its spin distribution and affects the relaxation of the other nearby proton. This causes the intensity of the other proton's signal to increase or decrease, indicating their proximity. The NOE provides information about molecular geometry without requiring coupling between nuclei and can reveal which protons are near each other in a structure.
This document discusses chemical shift in NMR spectroscopy. It begins by defining chemical shift as the shift in the NMR signal resulting from shielding and deshielding by electrons. Protons near electronegative atoms experience deshielding and absorb at lower fields, while protons near electropositive atoms experience shielding and absorb at higher fields. Tetramethylsilane (TMS) is commonly used as an internal reference standard due to its non-reactivity and single peak. Factors that influence chemical shift include electronegativity, anisotropy, hydrogen bonding, and molecular structure. Common isotopes used in NMR include 1H, 13C, 19F, and 31P. Reference standards are necessary for quantitative NMR and include T
Factors affecting IR absorption frequency Vrushali Tambe
1. Many factors affect the absorption frequency in IR spectroscopy, including reduced mass, bond strength, hydrogen bonding, electronic effects, and molecular structure.
2. Coupling between vibrations and Fermi resonance can cause frequency shifts and intensity changes. Hydrogen bonding causes broad bands while strong bonds absorb at higher frequencies.
3. Electronic effects like induction, mesomerism, and conjugation influence frequency by altering bond strength. Ring size, hybridization, and physical state also impact the absorption frequency.
This document discusses nuclear magnetic resonance (NMR) spectroscopy. It begins by describing the basic components of an NMR spectrometer, including a magnet, sample holder, radio frequency generator, detector, and reader. It then discusses the importance of using deuterated solvents like CDCl3 in NMR to minimize background signals. The document also explains the two main nuclear relaxation processes in NMR - spin-lattice and spin-spin relaxation. Additional sections cover factors that influence chemical shifts like electronegativity and anisotropic effects. Finally, the document provides examples of the number of NMR signals expected for different compounds based on equivalent and non-equivalent protons.
1. NMR spectroscopy can be used to investigate molecular properties like conformational isomerism and hydrogen bonding, determine optical purity, and study drug-receptor interactions.
2. 1H NMR spectra provide information on the number of different types of hydrogens, chemical shifts indicating hydrogen types, integration showing the number of each type of hydrogen, and splitting patterns revealing neighboring hydrogens.
3. NMR spectroscopy allows for quantitative analysis including assaying single or multiple components by peak area, determining percent hydrogen in compounds, and analyzing moisture content from water peak ratios.
IR SPECTROSCOPY, INTRODUCTION, PRINCIPLE, THEORY, FATE OF ABSORBED RADIATION, FERMI RESONANCE, FINGERPRINT REGION, VIBRATIONS, FACTORS AFFECTING ABSORPTION OF IR RADIATION, SAMPLING TECHNIQUES, APPLICATIONS OF IR SPECTROSCOPY.
Fluorescence spectroscopy analyzes the fluorescent properties of molecules. It works by exciting a molecule to a higher electronic state using a photon, causing it to emit a photon of lower energy as it returns to the ground state. The difference in wavelengths allows detection of emission photons. Key aspects covered include the principles of absorption and emission, instrumentation used, and different types of data that can be recorded such as fluorescence measurements, steady state techniques, and fluorescence anisotropy/polarization.
The document discusses Fourier-transform nuclear magnetic resonance (FT-NMR) spectroscopy. It provides an introduction to Fourier transforms and their use in converting time domain NMR spectra to frequency domain spectra. It describes the components of an FT-NMR instrument, including an RF transmitter coil, magnet, receiver coil, and computer. Key advantages of FT-NMR are its dramatic increase in sensitivity over continuous wave NMR, allowing detection of samples under 5 mg, and its ability to rapidly provide high signal-to-noise ratio spectra.
This document provides an overview of the principles of UV-visible spectroscopy. It discusses how UV-visible spectroscopy involves exciting electrons from lower to higher orbital energies using electromagnetic radiation between 200-800nm. The absorption of radiation is dependent on the structure of the compound and type of electron transition. The main types of electron transitions are σ->σ*, n->π*, π->π*, and n->σ*. Selection rules determine which transitions are allowed. UV-visible spectroscopy is used in pharmaceutical analysis for qualitative, quantitative, and structural analysis of compounds in solution.
This document provides an overview of UV-Visible Spectroscopy. It discusses the basic principles including electromagnetic radiation, interaction of radiation with matter, and electronic transitions. It describes Beer-Lambert's law and how absorbance is directly proportional to concentration and path length. Different types of electronic transitions like σ→σ*, n→σ*, π→π*, and n→π* are explained. Instrumentation components like radiation sources, monochromators, sample holders and detectors are briefly outlined. Key terms like chromophore, auxochrome, bathochromic shift, hypsochromic shift, hyperchromic effect and hypochromic effect are also defined.
1313
C NMR spectroscopy provides information about the number and types of nonequivalent carbon atoms in a molecule. It detects the number of protons bonded to each carbon and the electronic environment of the carbons. The chemical shift range for 1313
C NMR is much wider than for 1H NMR, from 0 to 220 ppm versus 0 to 12 ppm, making individual carbon signals easier to distinguish. Signal averaging and Fourier transform techniques improve the sensitivity of the 1313
C NMR spectrum. Decoupling and DEPT experiments can also provide information about the types of carbon atoms present.
SlideShare Presentation on Mass spectrophotometerNaveen K L
This document provides an overview of mass spectroscopy including its instrumentation and applications. It describes how mass spectroscopy works by bombarding compounds with electrons to produce ions or fragments that are then separated by mass and detected. The key components of a mass spectrometer are described as the sample inlet, ion source, mass analyzer, detector, and vacuum system. Common types of mass analyzers like magnetic sector, quadrupole, and time-of-flight are explained. Applications of mass spectroscopy include identification of unknown compounds, clinical research, and determination of molecular formulas and fragmentation patterns.
Capillary electrophoresis is a technique that uses narrow bore capillaries to separate charged molecules via electrophoretic mobility. When a voltage is applied, molecules migrate through the capillary at different rates depending on their charge and size. This allows analytes like proteins, nucleic acids, and small molecules to be separated. Key advantages are high efficiency, short analysis times, and low sample volume requirements. Common modes include capillary zone electrophoresis, capillary gel electrophoresis, and micellar electrokinetic capillary chromatography. Applications include analysis in pharmaceuticals and detection of microbial contamination.
This document provides an overview of mass spectrometry. It begins with introductions to spectroscopy and mass spectroscopy. The basic principles of mass spectrometry are that molecules are ionized, the ions are accelerated and passed through electric and magnetic fields based on their mass-to-charge ratio, and detected. Common ionization techniques include electron ionization, chemical ionization, and desorption techniques like fast atom bombardment. The document describes different types of ions detected, such as molecular, fragment, and rearrangement ions. It also covers various mass analyzers used to separate ions such as magnetic sector, double focusing, and quadrupole analyzers.
This document discusses fluorescence spectroscopy. It begins by defining fluorescence as the emission of light by a substance that has absorbed light or electromagnetic radiation. It then explains that fluorescence spectroscopy analyzes fluorescence from a sample using a light source, usually ultraviolet light, that causes molecules to emit visible light. The document provides details on the theory, instrumentation, and applications of fluorescence spectroscopy. It describes how fluorescence spectroscopy can be used to quantitatively determine the concentration of known analytes in solution based on their fluorescent properties.
IR spectroscopy analyzes the vibrational frequencies of bonds in molecules to determine their structure. It works by measuring the absorption of IR radiation by molecular bonds. Different functional groups absorb at characteristic frequencies, producing a molecular "fingerprint". IR spectroscopy is useful for identification of unknown compounds, analyzing purity, and monitoring chemical reactions through changes in bond absorption. It is a nondestructive technique applied in various fields such as pharmaceutical analysis, biomedical research, forensic science, and atmospheric studies.
NMR, principle and instrumentation by kk sahu sirKAUSHAL SAHU
Introduction
History
Principle
Assembly
Solvents
Chemical shift
Factors affecting chemical shift
2D NMR
NOE effect
NOESY
COSY
Application
Conclusion
References
The document discusses how solvents and chromophores affect UV-visible spectroscopy. It states that the solvent exerts influence on the absorption spectrum, with the same drug showing different absorption maxima in different solvents. Common solvents used are water, methanol, ethanol, ether, and cyclohexane. The solvent should not absorb in the region studied and have minimum interaction with solute. Chromophores like conjugated systems, carbonyls, and metal complexes determine absorption. Factors like conjugation, auxochromes, and solvent polarity can shift absorption maxima.
This document discusses chromophores and how solvents affect absorption spectra. It defines a chromophore as a covalently bonded group that absorbs UV or visible radiation. Chromophores are classified as independent or dependent based on the number needed to impart color. Absorption maxima can shift to longer (bathochromic) or shorter (hypsochromic) wavelengths due to auxochromes or solvent changes. Solvent polarity also affects absorption based on the type of electronic transition involved. Temperature and solvent interactions determine the fineness of absorption bands.
This presentation is all about UV spectroscopy
In this presentation I discussed principle of UV spectroscopy, Absorption law, Intensity shift ,effect of solvent on Absorption shift and all type of transition in UV spectroscopy.
We all know that UV spectroscopy deals with the determination of structure of compounds with interaction of electromagnetic radiation (UV rays) with matter. And i mentioned about principle how UV spectroscopy work in which I discussed about excitation of matter electron and how we used absorption spectra in terms of absorbance.
I also mentioned about effect of solvent on Absorption shift how the polar and non-polar compound are affected when we change the polarity of solvent.
This document provides an overview of spectroscopy. It discusses topics like electromagnetic radiation, photons, wavelength, frequency, the electromagnetic spectrum, absorption spectroscopy, emission spectroscopy, Lambert's law, Beer's law, chromophores, auxochromes, shifts in absorption spectra, and components of a visible spectrophotometer like sources, filters, and monochromators.
This document discusses ultraviolet-visible spectroscopy and its principles. It covers the electromagnetic spectrum, units used, absorption laws including Lambert's law and Beer's law. It describes chromophores and auxochromes, types of electronic transitions, factors affecting absorption bands, and solvent effects. Different types of absorption bands and applications of UV-Vis spectroscopy are also summarized.
UV/Visible spectroscopy involves electronic transitions that absorb light in the ultraviolet-visible region. There are several types of transitions including n→π*, π→π*, and σ→σ* transitions. The energy and wavelength of absorbed light depends on the difference between molecular orbital energies. Chromophores and auxochromes determine absorption properties, and solvents, concentration, and temperature can affect observed spectra. UV/Vis spectrometers contain a light source, monochromator, sample holder, and detector to measure absorption of light by a sample.
UV/visible spectroscopy involves using electromagnetic radiation in the UV and visible light range to analyze samples. Absorption of this radiation causes electronic transitions between molecular energy levels. The wavelength and intensity of absorption peaks provide information about functional groups in molecules. Factors like conjugation and substituents can cause bathochromic, hypsochromic, hyperchromic, or hypochromic shifts in absorption maxima and intensity. UV/visible spectroscopy has applications in qualitative and quantitative analysis, detection of impurities, and determination of molecular properties.
Solvents and solvent effect in UV - Vis Spectroscopy, By Dr. Umesh Kumar sh...Dr. UMESH KUMAR SHARMA
This document discusses solvent effects on UV-visible spectroscopy. It begins by explaining that UV spectra are usually measured in dilute solutions using solvents that are transparent in the wavelength range and do not interact strongly with the solute. Common solvents mentioned are ethanol, hexane, and water. The document then discusses various solvent effects including bathochromic shifts, hypsochromic shifts, hyperchromic shifts, and hypochromic shifts. It provides examples of how solvents can alter absorption wavelengths and intensities. The document concludes by mentioning several reference texts on this topic.
UV/visible spectroscopy involves the interaction of electromagnetic radiation in the ultraviolet-visible spectral region with matter. It works based on electronic transitions in molecules that absorb UV-visible light. The absorbed wavelengths are characteristic of the chemical bonds in a substance. Beer's law states that absorbance is directly proportional to concentration, allowing for quantitative analysis. Chromophores are functional groups that absorb UV-visible light, while auxochromes modify the absorption properties. Shifts in absorption maximum wavelength or intensity can provide information about molecular structure. Applications include qualitative and quantitative analysis of organic compounds.
1. Color is an attribute resulting from light reflected, transmitted, or emitted from objects that causes visual sensations dependent on wavelength.
2. Theories of color include chromophore-auxochrome theory, which proposes unsaturated groups called chromophores impart color, and auxochromes intensify it.
3. Modern theories include valence bond theory, where excited states resemble less stable, charge-separated forms, and molecular orbital theory, where π→π* transitions in conjugated systems cause visible absorption.
UV-visible spectroscopy involves using light in the UV-visible spectral region to analyze chemical substances. It works on the principle of Beer-Lambert's law, where absorbance is directly proportional to concentration and path length. Different functional groups and conjugated systems can absorb light at characteristic wavelengths. The technique is used for quantitative and qualitative analysis of samples through measurement of absorption spectra. It provides information about electronic transitions and molecular structure of compounds.
UV-Visible spectroscopy uses electromagnetic radiation to analyze molecular structure by measuring absorption of specific wavelengths. It follows Beer's and Lambert's laws, where absorbance is proportional to concentration. Absorption is due to electronic transitions between orbitals. Deviations from Beer's law can occur at high concentrations or due to chemical changes. Chromophores and auxochromes determine absorption wavelength. Applications include structure elucidation, quantitative analysis, and detection of impurities.
This document discusses chromophores, auxochromes, and spectral shifts in organic chemistry. It defines chromophores as the part of a molecule responsible for its color and absorption spectrum. Auxochromes are substituents that modify a chromophore's absorption by increasing conjugation. There are two types of spectral shifts: bathochromic shifts move absorption to longer wavelengths (red shift) while hypsochromic shifts move it to shorter wavelengths (blue shift). Hyperchromic effects increase absorption intensity while hypochromic effects decrease it. Examples like phenol and nitrobenzene are provided.
LEC 1 Dyestuff and Colour Science. pptx.pptxNasirSarwar5
Dyestuffs and dyes impart color to substrates like textiles, paper, and plastics. Dyes contain aromatic compounds that absorb certain wavelengths of light, appearing colored. Chromophores are structures within dyes that are responsible for light absorption by altering the energy levels of delocalized electrons. Auxochromes intensify dye color by further modifying electron energies. Factors like hue, strength, and bathochromic/hypsochromic shifts describe dye color properties. Photochromism causes reversible color changes in dyes under light due to cis-trans isomerization of azobenzene structures.
UV-Visible spectroscopy, a versatile analytical technique used to study the interaction of molecules with light within the ultraviolet and visible regions of the electromagnetic spectrum. It is a fundamental tool in chemistry, biochemistry, and related fields for analyzing the electronic structure of molecules, determining their concentrations, and studying their behavior.
1. Principle of UV-Visible Spectroscopy:
UV-Vis spectroscopy is based on the principle that molecules absorb specific wavelengths of light due to electronic transitions.
When molecules absorb light in the UV or visible range, they move from a ground state to an excited state.
2. Instrumentation:
UV-Vis spectrophotometer is the key instrument used for this technique.
Components include a light source, sample holder, monochromator, and a detector.
The sample is placed in a cuvette, and the spectrophotometer measures the absorbance of light passing through the sample.
3. Beer-Lambert Law:
The Beer-Lambert law relates the concentration of a solution, the path length (distance that light travels through the solution), and the absorbance of light by the solution.
A = ε * c * l, where A is absorbance, ε is the molar absorptivity (a constant for a specific compound and wavelength), c is the concentration, and l is the path length.
4. Absorbance Spectra:
UV-Vis spectroscopy generates absorbance spectra, which are plots of absorbance versus wavelength.
Peaks in the spectra indicate the wavelengths of light that are absorbed by the sample, providing information about the electronic structure of the molecules.
5. Applications:
Quantitative Analysis: UV-Vis is widely used for quantitative analysis of compounds by measuring the absorbance of a sample and comparing it to a standard curve.
Identification of Compounds: The unique absorbance spectra can be used to identify compounds.
Kinetics: UV-Vis can monitor reaction kinetics by following the change in absorbance over time.
Pharmaceutical Analysis: It is crucial in quality control for pharmaceuticals.
Environmental Analysis: UV-Vis is used in environmental monitoring, such as water quality analysis.
6. Advantages:
It's a rapid and simple technique.
It can be highly sensitive for many compounds.
It is non-destructive to the sample.
7. Limitations:
It does not provide structural information about the molecules.
It may not be suitable for analyzing complex mixtures.
This document discusses chromophores and how they absorb electromagnetic radiation. It defines a chromophore as a covalently bonded group that absorbs UV or visible light. Common chromophores include C=C, C=O, and NO2 groups. Chromophores can be independent, requiring only one group to impart color, or dependent, requiring more than one group. Auxochromes are groups that alter the wavelength and intensity of absorption when attached to a chromophore. Absorption maxima can be bathochromically or hypsochromically shifted and absorption intensity can be hyperchromically or hypochromically altered.
this slides contains information about UV Visible spectroscopy and how we can demonstrate its applications in our daily life as it also contains visible region and all the wavelengths includes in this region and why substances appears colored
UV-Visible Spectroscopy is a technique that uses light in the visible and adjacent ranges. It works based on absorption of light by molecules. Key points:
1. Absorption of light is based on electronic transitions in molecules. Different types of transitions (π-π*, n-π*) result in different absorption bands.
2. Chromophores and auxochromes determine the wavelength of absorption. Auxochromes cause bathochromic shifts.
3. Instruments use various components like light sources, monochromators and detectors to isolate wavelengths and measure absorption.
4. Factors like temperature, solvent and concentration affect the absorption spectrum based on Beer-Lambert law.
This document discusses Beer's law, which states that absorbance of a solution is directly proportional to the concentration of the absorbing material in the solution. It defines Beer's law, derives the mathematical equation, and lists some limitations and sources of deviation from the law, including high concentrations, dissociation/association reactions, use of polychromatic radiation, stray light, and mismatched sample cells. The derivation shows how the Beer's law equation is obtained based on probability of photon absorption in thin sections of the sample.
Electron microscopes use a beam of electrons instead of light to examine objects at a very fine scale. Transmission electron microscopes (TEMs) were developed first and use a thin sample, while scanning electron microscopes (SEMs) were developed later and can examine thicker samples. TEMs use electromagnetic lenses to focus electrons that pass through a thin sample, allowing observation of sample structure and composition. The electron beam interacts with the sample through elastic and inelastic scattering. Magnetic lenses collimate scattered electrons to form diffraction patterns containing structural information.
Gel electrophoresis is a technique used to separate DNA, RNA, and proteins based on their size and charge. During gel electrophoresis, a current is applied to move the molecules through a gel, with smaller molecules moving faster through the pores in the gel. This allows researchers to determine the size of unknown molecules by comparing their migration to molecules of known sizes. Key aspects of gel electrophoresis include preparing an agarose or polyacrylamide gel, loading samples and a ladder, running the current, and visualizing the separated molecules using dyes like ethidium bromide under ultraviolet light.
The document discusses various concepts related to quality including definitions of quality, quality management, quality control, quality assurance, ISO standards, total quality management, and documentation requirements. It provides definitions for quality as fitness for use, conformance to specifications, and meeting customer expectations. Quality management involves building quality into products through controls and preventing deficiencies. Quality control tests and inspects materials and products, while quality assurance reviews quality systems and procedures. Documentation is essential for defining and controlling quality systems.
This document provides information about carbonyl compounds, specifically aldehydes and ketones. It discusses their IUPAC nomenclature, methods of preparation including oxidation of alcohols and oxidative cleavage of alkenes, and physical and chemical properties. The chemical reactions covered include nucleophilic addition, reduction, condensation, and oxidation reactions. Examples of important aldehydes and ketones are also mentioned along with their structures and uses.
Carboxylic acids contain a carboxyl (-COOH) functional group. They are classified as monocarboxylic, dicarboxylic, or tricarboxylic based on the number of carboxyl groups. Carboxylic acids are named using IUPAC or common names. They are resonance stabilized and can form hydrogen bonds. Carboxylic acids are acidic due to the stability of the conjugate base. They undergo characteristic reactions like forming salts, anhydrides, esters, amides, and undergoing oxidation, reduction, decarboxylation. Common carboxylic acids and their uses include acetic acid, lactic acid, citric acid, benzoic acid, and aspirin.
বাংলাদেশের অর্থনৈতিক সমীক্ষা ২০২৪ [Bangladesh Economic Review 2024 Bangla.pdf] কম্পিউটার , ট্যাব ও স্মার্ট ফোন ভার্সন সহ সম্পূর্ণ বাংলা ই-বুক বা pdf বই " সুচিপত্র ...বুকমার্ক মেনু 🔖 ও হাইপার লিংক মেনু 📝👆 যুক্ত ..
আমাদের সবার জন্য খুব খুব গুরুত্বপূর্ণ একটি বই ..বিসিএস, ব্যাংক, ইউনিভার্সিটি ভর্তি ও যে কোন প্রতিযোগিতা মূলক পরীক্ষার জন্য এর খুব ইম্পরট্যান্ট একটি বিষয় ...তাছাড়া বাংলাদেশের সাম্প্রতিক যে কোন ডাটা বা তথ্য এই বইতে পাবেন ...
তাই একজন নাগরিক হিসাবে এই তথ্য গুলো আপনার জানা প্রয়োজন ...।
বিসিএস ও ব্যাংক এর লিখিত পরীক্ষা ...+এছাড়া মাধ্যমিক ও উচ্চমাধ্যমিকের স্টুডেন্টদের জন্য অনেক কাজে আসবে ...
Exploiting Artificial Intelligence for Empowering Researchers and Faculty, In...Dr. Vinod Kumar Kanvaria
Exploiting Artificial Intelligence for Empowering Researchers and Faculty,
International FDP on Fundamentals of Research in Social Sciences
at Integral University, Lucknow, 06.06.2024
By Dr. Vinod Kumar Kanvaria
हिंदी वर्णमाला पीपीटी, hindi alphabet PPT presentation, hindi varnamala PPT, Hindi Varnamala pdf, हिंदी स्वर, हिंदी व्यंजन, sikhiye hindi varnmala, dr. mulla adam ali, hindi language and literature, hindi alphabet with drawing, hindi alphabet pdf, hindi varnamala for childrens, hindi language, hindi varnamala practice for kids, https://www.drmullaadamali.com
A workshop hosted by the South African Journal of Science aimed at postgraduate students and early career researchers with little or no experience in writing and publishing journal articles.
Walmart Business+ and Spark Good for Nonprofits.pdfTechSoup
"Learn about all the ways Walmart supports nonprofit organizations.
You will hear from Liz Willett, the Head of Nonprofits, and hear about what Walmart is doing to help nonprofits, including Walmart Business and Spark Good. Walmart Business+ is a new offer for nonprofits that offers discounts and also streamlines nonprofits order and expense tracking, saving time and money.
The webinar may also give some examples on how nonprofits can best leverage Walmart Business+.
The event will cover the following::
Walmart Business + (https://business.walmart.com/plus) is a new shopping experience for nonprofits, schools, and local business customers that connects an exclusive online shopping experience to stores. Benefits include free delivery and shipping, a 'Spend Analytics” feature, special discounts, deals and tax-exempt shopping.
Special TechSoup offer for a free 180 days membership, and up to $150 in discounts on eligible orders.
Spark Good (walmart.com/sparkgood) is a charitable platform that enables nonprofits to receive donations directly from customers and associates.
Answers about how you can do more with Walmart!"
How to Manage Your Lost Opportunities in Odoo 17 CRMCeline George
Odoo 17 CRM allows us to track why we lose sales opportunities with "Lost Reasons." This helps analyze our sales process and identify areas for improvement. Here's how to configure lost reasons in Odoo 17 CRM
This presentation was provided by Steph Pollock of The American Psychological Association’s Journals Program, and Damita Snow, of The American Society of Civil Engineers (ASCE), for the initial session of NISO's 2024 Training Series "DEIA in the Scholarly Landscape." Session One: 'Setting Expectations: a DEIA Primer,' was held June 6, 2024.
2. Learning Outcomes:
• The learners will be able to understand:
• Chromophores & Auxochromes
• Types of absorption shifts
• Effect of solvent
• Effect of conjugation
3. Chromophores
In Greek: Chroma = colour ; phoros = bearer
• Any isolated covalently bonded group that shows a characteristic
absorption in the uv/visible region. e.g. C=C, C=O or NO2
• Any substance or groups that absorbs radiation at particular wave
length can be considered as chromophore whether it may or may not
impart color to the compound.
• A molecule containing a chromophore is called as chromogen.
• Mainly exhibit n-π* and π –π* transitions.
4. • chromophores function by altering the energy in the delocalized
electron cloud of the dye, and this alteration results in the compounds
absorbing radiation from the visible light.
• When some of the wavelengths found in white light are absorbed, then
we see what is left over as colored light. The color that we see is
referred to as the complementary color of the color that was removed.
For instance, if the red rays are removed from white light, the color we
detect is blue‐green.
COMPLIMENTARY COLORS
Violet Yellow-Green
Blue Yellow
Cyan Orange
Blue-Green Red
Green Purple
5. • Conjugated double bonds interact with each other in chromophores and
due to this interaction between the double bonds, partial delocalization
of the bonding electrons is observed. Therefore, the electrons are
distributed over a larger area.
• Types of chromophores: 1. independent
2. dependent
Independent chromophore: If one chromophore is required to impart
color to the compound. e.g. azo (-N=N-), Nitroso (-N=O)
Dependent chromophore: if more than one chromophore is required
to impart color to the compound. e.g. Acetone having one ketone group is
colorless whereas diacetyl having two ketone groups is yellow.
7. Auxochromes
• The word auxochrome is derived from two roots. The prefix auxo is from
auxein, and means increased. The second part, chrome means colour, so
the basic meaning of the word auxochrome is colour increaser.
• Auxochrome is defined as any group, which does not itself act as a
chromophore but whose presence brings about a shift of the absorption
band towards the red end of the spectrum (longer wavelength).
• The effect is due to its ability to extend the conjugation of a chromophore
by sharing the nonbonding electrons.
• The new chromophore formed will have a different absorption maximum
and extinction coefficient values.
Benzene – 255nm (εmax - 203)
Aniline – 280nm (εmax- 1430), so the auxochrome group is – NH2
• Ex: - OH, - OR, -NH2, -NHR, -NR2, -SH etc.
8. Types:
1. Basic (positive) auxochromes groups:
Effective in acidic solutions.
Example: OH, OR, NHR
2. Acidic (negative) auxochromes groups:
Effective in alkaline solutions.
Example: NO, CO, CN
10. Substituents when present may cause shift in the position of
absorption spectrum of any chromophore.
1. Bathochromic Shift: An shift to longer wavelength (red shift).
2. Hypsochromic Shift: An shift to shorter wavelength (blue shift).
3. Hyperchromic Shift: An increase in intensity of absorption.
4. Hypochromic Shift: An decrease in intensity of absorption.
11. Bathochromic Shift:
• Also known as red shift.
• Shift in the position of absorption maximum to the longer wavelength.
• Change of solvent polarity (low)/ auxochromes/conjugation may cause
bathochromic shift.
• Example; π- π* in ethylene : λmax= 165 nm
π- π* in 1,3-butadiene : λmax= 217 nm
12. Hypsochromic Shift:
• Also known as blue shift.
• Shift in the position of absorption maximum to the shorter wavelength.
• Change of solvent polarity (high)/ removal of conjugation may cause
bathochromic shift.
• Example; Aniline (lone pair in conjugation with ring) : λmax= 280 nm
In acidic solution, C6H5NH3
+ (lone pair not present) : λmax= 203 nm
13. Hyperchromic Shift:
• Shift due to increase in intensity, εmax increases.
• Due to introduction of auxochrome.
• Example; Pyridine : λ = 257 nm, εmax = 2750
2-methyl Pyridine : λ = 262 nm, εmax = 3560
14. Hypochromic Shift:
• Shift due to decrease in intensity, εmax decreases.
• Due to introduction of any substituent that may cause distortion in
molecular geometry.
• Example; Biphenyl : λ = 250 nm, εmax = 19000
2-methyl biphenyl : λ = 237 nm, εmax = 10250
15. Solvent Effects
• A compound may absorb a maximum radiation energy at particular
wavelength in one solvent but shall absorb partially at the same
wavelength in another solvent.
Eg: Acetone in n-hexane; λ max = 279 nm
Acetone in water; λ max = 264.5 nm
• Most commonly used solvent is 95% ethanol.
1. It is cheap
2. Has good dissolving power
3. Does not absorbs radiations above 210nm.
Solvent Wavelength (nm)
Water 205
Ethanol 210
Methanol 210
Ether 210
Cyclohexane 210
Dichloromethane 220
16. Effect of solvent polarity
• Polarity plays an important role in the position and intensity of
absorption maximum of a particular chromophore.
a) In case of non-polar solvents e.g. Iodine solution (purple
color) the absorption maxima occurs at almost the same
wavelength as in iodine vapor (5180 A0)
b) In case of polar solvents , a brownish color is obtained instead
of purple color , because the absorption occurs at shorter
wavelengths.
17. Effect of solvent polarity
• Many analyte exhibit fine structures when measured in low dipole
moments.
• Solute-solvent interactions are greater when strong dipole forces are
involved.
• Solvent effects help in recognizing bands due to n-π* and π- π*
transitions.
• The non bonding electrons can interact strongly with polar solvents
and results in characteristic shift to shorter wavelength
(hypsochromic shift), whereas, those of π- π* transitions are shifted
to higher wavelengths (bathochromic shift).
18. Why n-π* transitions causes hypsochromic shift whereas π -π*
transition causes bathochromic shift in polar solvents?
The energy of the nonbonding orbital is lowered by H-bonding in polar
solvents, and thereby increase the energy of n-π* transition (short λ).
The energy of π* orbital is decreased relative to the π orbital and
therefore, energy of π-π* transition is decreased (long λ).
Molarabsorptivity,ε
Wavelength, λ
CHCl3
C2H5OH
Absorption spectrum of iodine in a polar and a non polar solvents
19. Effect of conjugation:
• In presence of conjugation, electronic energy levels of a chromophore
move closer together and energy required to cause transition
decreases, and the wavelength of the light absorbed becomes longer,
and bathochromic shift is observed.
logε
Wavelength, λ
A
B
C
CH3-(CH=CH)n-CH3 UV spectra of dimethyl polyenes. (a) n=3 (b) n=4 (c) n=5