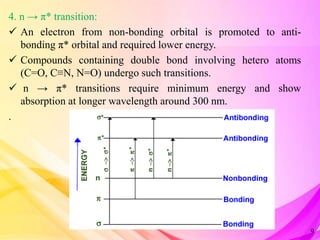
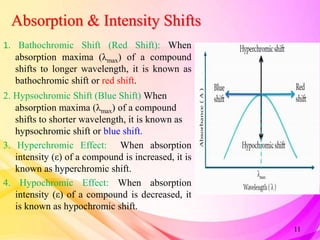
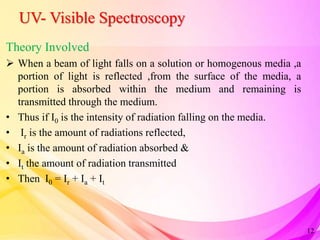
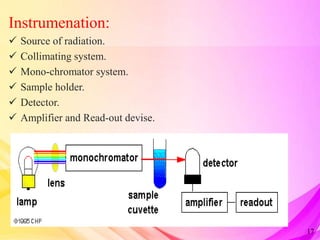
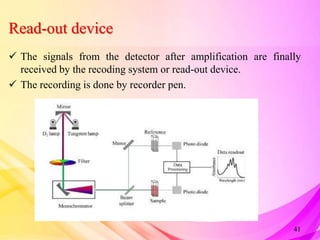
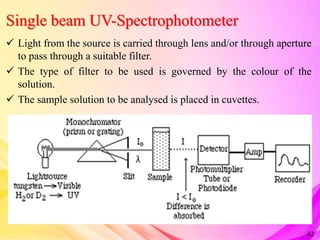
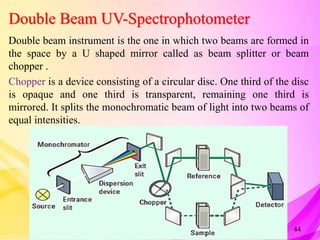
This document provides an overview of UV-Visible Spectroscopy. It discusses the basic principles including electromagnetic radiation, interaction of radiation with matter, and electronic transitions. It describes Beer-Lambert's law and how absorbance is directly proportional to concentration and path length. Different types of electronic transitions like σ→σ*, n→σ*, π→π*, and n→π* are explained. Instrumentation components like radiation sources, monochromators, sample holders and detectors are briefly outlined. Key terms like chromophore, auxochrome, bathochromic shift, hypsochromic shift, hyperchromic effect and hypochromic effect are also defined.
This document describes the components and design of spectrophotometry instruments. It discusses the key components including the light source, monochromator system using filters, prisms or gratings, sample holder, detector and readout. Specific light sources like tungsten-halogen lamps, hydrogen and xenon discharge lamps are covered. Requirements for an ideal light source and operating principles of filters, prisms and diffraction gratings as monochromators are summarized.
This presentation gives you thorough knowledge about the IR Spectroscopy. This include basic principle, type of vibrations, factors influencing vibrational frequency, instrumentation and applications of IR Spectroscopy. This is the most widely used technique for identifying unknown functional group depending on the vibrational frequency.
UV/visible spectroscopy involves the interaction of electromagnetic radiation with matter. Absorption spectroscopy measures the absorption of UV or visible light, while emission spectroscopy measures light emitted from a sample. The wavelength and frequency of electromagnetic radiation are inversely related by the equation c=λν. Electronic transitions in molecules, such as σ→σ*, π→π*, n→σ*, and n→π* can be detected using UV/visible spectroscopy. Beer's law states that absorbance is directly proportional to concentration and path length. Chromophores are functional groups in molecules that absorb UV or visible light.
1) IR spectroscopy uses infrared radiation to identify chemical substances by their absorption patterns.
2) The main components of an IR spectrometer are a radiation source, monochromator, sample cells, detectors, and recorder.
3) Common radiation sources are Nernst glowers, globar sources, and incandescent wires, which emit IR radiation that is focused through the sample.
IR interpretation and sample handling Afzaye Rasul
The document discusses sample handling and interpretation of infrared spectroscopy. It describes several methods for preparing solid, liquid, and gas samples for IR analysis. These include pressed KBr pellets for solids, liquid samples in thin films between windows, and gases in cells. The document then outlines how to interpret IR spectra by identifying key functional groups like carbonyl, hydroxyl, aromatic, and C=C bands. It provides examples of infrared absorptions for several classes of organic compounds including alkanes, alkenes, alcohols, ketones, and amides.
UV-visible spectroscopy is a technique that uses light in the visible and adjacent ranges. It works by measuring how much light is absorbed by a sample at each wavelength. There are several types of electronic transitions that can occur when molecules absorb this light. The amount of light absorbed follows Beer's law and is proportional to the concentration and path length of the sample. A UV-visible spectrophotometer consists of a light source, monochromator, sample holder, detector, and recording device. This technique has many applications including detection of impurities, structure elucidation, and quantitative analysis in pharmaceutical analysis.
IR SPECTROSCOPY, INTRODUCTION, PRINCIPLE, THEORY, FATE OF ABSORBED RADIATION, FERMI RESONANCE, FINGERPRINT REGION, VIBRATIONS, FACTORS AFFECTING ABSORPTION OF IR RADIATION, SAMPLING TECHNIQUES, APPLICATIONS OF IR SPECTROSCOPY.
This presentation include the detailed explanation of various parts of a UV-Visible spectrophotometer and two types of UV-Visible spectrophotometers-Single beam and Doube beam. It also include the comparison between single beam and double beam spectrophotometers.
In this slide contains principle of IR spectroscopy and sampling techniques.
Presented by: R.Banuteja (Department of pharmaceutical analysis).
RIPER, anantpur.
The document discusses infrared (IR) absorption spectroscopy. It begins by defining IR spectroscopy and explaining that it deals with the infrared region of the electromagnetic spectrum. It then discusses the different IR regions and how IR radiation causes molecular vibrations when it hits a molecule. The document goes on to describe different types of molecular vibrations including stretching, bending, scissoring, and twisting vibrations. It also discusses factors that affect vibrational frequencies such as atomic mass and bond strength. Finally, it briefly discusses instrumentation used in IR spectroscopy such as sources, sample cells, detectors, and the applications of IR spectroscopy.
IR spectroscopy analyzes the vibrational frequencies of bonds in molecules to determine their structure. It works by measuring the absorption of IR radiation by molecular bonds. Different functional groups absorb at characteristic frequencies, producing a molecular "fingerprint". IR spectroscopy is useful for identification of unknown compounds, analyzing purity, and monitoring chemical reactions through changes in bond absorption. It is a nondestructive technique applied in various fields such as pharmaceutical analysis, biomedical research, forensic science, and atmospheric studies.
The document discusses various ionization techniques used in mass spectrometry. It describes electron impact ionization, chemical ionization including positive and negative modes, atmospheric pressure chemical ionization, field ionization, field desorption, and electrospray ionization. Each technique is explained in terms of its construction, working principle, advantages, and limitations. Electron impact ionization is the most widely used classical method that produces extensive fragmentation, while chemical ionization and electrospray ionization are suited for high molecular weight compounds that undergo less fragmentation.
This document discusses instrumentation methods of fluorimetry. It describes the key components of a fluorimeter including light sources like mercury vapor lamps and xenon arc lamps, filters and monochromators to select wavelengths of light, sample cells to hold liquid samples, and detectors like photomultiplier tubes and photovoltaic cells. Common types of fluorimeters are single beam, double beam, and spectrofluorimeters. Applications include determination of inorganic substances, proteins, and drugs.
The document discusses fluorescence spectroscopy. It defines fluorescence as emission of light that occurs when a substance absorbs light and returns to its ground state, emitting photons. Factors that affect fluorescence include the molecular structure, substituents, concentration, pH, temperature, and viscosity. Instrumentation for fluorescence spectroscopy includes a light source, filters, sample cells, and detectors such as photomultiplier tubes. Applications of fluorescence spectroscopy include determination of inorganic substances, use as fluorescent indicators, pharmaceutical analysis, and liquid chromatography.
Gas chromatography is a technique used to separate and analyze mixtures that can be vaporized without decomposition. It works by partitioning components to be separated between a stationary phase and a mobile gas phase. The key components of a gas chromatography instrument are the carrier gas, injection port, column, temperature control system, and detector. Factors like temperature, flow rate, column length, and amount of sample injected can influence separation of the components. Gas chromatography has applications in qualitative and quantitative analysis and is used in quality control of pharmaceuticals.
NMR spectroscopy is a technique that uses magnetic fields and radiofrequency pulses to analyze atomic nuclei and study the physical and chemical properties of molecules. It provides detailed information about molecular structure by detecting hydrogen and other nuclei. The document discusses the basic principles of NMR, instrumentation, factors affecting chemical shifts, and applications in medicine such as anatomical imaging and tumor detection.
UV spectroscopy, Electronic transitions, law of UV, Deviations of UV, chromop...Rajesh Singh
This PowerPoint Presentation includes the principle, electronic transitions, application, chromophore, Auxochrome, Deviations and instrumentation of UV- Visible Spectrophotometer. It covers beer-lambert low and its quantitative applications. It also includes the qualitative applications in different fields of study. Presented by Rajesh Singh in GLA University Mathura.
The document discusses infrared (IR) spectroscopy, which analyzes the interaction of infrared radiation with matter. IR spectroscopy can provide information about a compound's chemical structure and molecular structure by measuring its absorption of IR radiation. It is widely used to analyze organic materials and some inorganic molecules. The document then describes various components of IR instrumentation, including IR radiation sources like the Nernst glower and globar, monochromators that separate wavelengths, sample cells and techniques, and detectors like thermocouples, bolometers, and thermistors that measure the radiation absorbed.
Thin layer chromatography (TLC) is a chromatography technique used to separate mixtures by distributing the components between a stationary phase, such as silica gel coated on a plate, and a mobile phase, such as a solvent mixture, which moves up the plate by capillary action. TLC involves spotting a sample mixture onto the plate, developing it in a solvent system, and visualizing the separated components, which travel at different rates depending on how they partition between the stationary and mobile phases. TLC is a simple, fast, and inexpensive analytical technique used for qualitative and quantitative analysis of organic compounds and testing compound purity.
Thermal detectors contain a small active element that absorbs radiation and experiences a temperature change. The temperature change is inversely proportional to the exposed surface area of the element. There are several types of thermal detectors including thermocouples, thermistors, and pneumatic devices like the Golay cell. Thermocouples use two dissimilar metals where radiation heats the junction and creates a potential difference. Thermistors are made of materials with resistance highly dependent on temperature. Pyroelectric detectors contain non-centrosymmetric crystals that generate an electric field in response to temperature change rate. The Golay cell consists of a gas-filled cylinder with a flexible diaphragm that deforms in response to pressure changes
Nuclear magnetic resonance spectroscopy is an analytical technique that uses radio waves and strong magnetic fields to characterize organic molecules. The key components of an NMR spectrometer include a sample holder, permanent magnet, magnetic coil, radio frequency generator and receiver, and readout system. The magnet provides a strong and uniform magnetic field, the generator produces radio waves to excite the nuclei, and the receiver and readout system detect and display the resonance signals to identify the molecules.
This document provides an overview of infrared spectroscopy. It discusses the principle that infrared spectroscopy involves absorption of infrared radiation which causes vibrational transitions in molecules. The instrumentation involves an infrared source, sample holder, and detector. Applications include identifying functional groups in organic molecules, determining drug formulations, and analyzing biological samples like urine.
UV/visible spectroscopy involves measuring the absorption of ultraviolet or visible light by molecules. It utilizes light in the wavelength range of 200-800 nm.
The key components of a UV-visible spectrophotometer are a light source, wavelength selector such as a monochromator, sample holder, detector, and associated electronics. Common light sources include deuterium lamps, tungsten lamps, and mercury lamps. Samples are typically held in quartz or glass cuvettes. Detectors include phototubes and photodiodes.
UV-visible spectroscopy can be used to analyze samples containing multiple components. Methods for multicomponent analysis include simultaneous equations using absorption data at two wavelengths, absorbance ratio methods
This document provides an overview of the principles of UV-visible spectroscopy. It discusses how UV-visible spectroscopy involves exciting electrons from lower to higher orbital energies using electromagnetic radiation between 200-800nm. The absorption of radiation is dependent on the structure of the compound and type of electron transition. The main types of electron transitions are σ->σ*, n->π*, π->π*, and n->σ*. Selection rules determine which transitions are allowed. UV-visible spectroscopy is used in pharmaceutical analysis for qualitative, quantitative, and structural analysis of compounds in solution.
Gas chromatography and its instrumentationArgha Sen
This document provides an introduction to gas chromatography including a brief history and overview of the technique. It describes the basic components and instrumentation of a gas chromatography system including the carrier gas, sample injection systems, columns, temperature programming, and various detection systems. It also discusses different types of gas chromatography such as gas-solid, gas-liquid, and headspace GC. Finally, some common applications of gas chromatography are mentioned such as qualitative and quantitative analysis of compounds like fatty acids, foods, pollutants, and drugs.
This document provides an overview of UV/Visible spectroscopy. It begins with definitions of spectroscopy and discusses the principles, including that spectroscopy involves measuring the absorption or emission of electromagnetic radiation by molecules as they change energy states. It also defines key terms like chromophores, auxochromes, and discusses different types of electronic transitions that can occur. The document then discusses instrumentation components like sources of radiation, collimating systems, monochromators, and detectors. It provides details on various types of sources, monochromators, and filters. In summary, the document provides a comprehensive introduction to the theory, applications, and instrumentation of UV/Visible spectroscopy.
Spectroscopy is the measurement of electromagnetic radiation absorbed or emitted by molecules or atoms as they move between energy states. It is a powerful analytical technique used to study molecular structure. A spectrometer measures the spectrum of a sample, which is a graph of intensity versus wavelength or frequency. There are different types of spectroscopy depending on the type of radiation used, such as UV-visible, infrared, or mass spectroscopy. The interaction of matter with electromagnetic radiation follows Beer's law, which states that absorbance is directly proportional to concentration and path length.
UV spectroscopy involves the interaction of ultraviolet or visible light with matter. It works on the principle that when UV or visible light hits a molecule, electrons within the molecule can be excited to higher energy levels. This causes absorption of specific wavelengths of light that are characteristic of a particular chemical bond or structure. The wavelength of absorbed light and intensity of absorption can be used to identify molecules and determine concentration.
Spectroscopy is the branch of science that deals with the study of interaction of electromagnetic radiation with matter. It uses electromagnetic radiation in the ultraviolet-visible region. When this radiation interacts with molecules, electronic transitions between different energy levels can occur. The wavelength and intensity of absorbed light depends on characteristics of the molecule such as its structure and functional groups. Spectroscopy can be used to identify unknown compounds, determine molecular structure, and calculate concentration through the Beer-Lambert law.
UV/Visible spectroscopy involves the interaction of electromagnetic radiation in the ultraviolet-visible spectral region with matter. Key points:
1. Electromagnetic radiation consists of photons that interact with molecules through electronic, vibrational, and rotational energy transitions.
2. UV/Vis spectroscopy follows Beer's law - absorbance is directly proportional to concentration and path length. It can be used to determine concentrations.
3. Chromophores are functional groups that absorb UV-Vis radiation through n→π* and π→π* transitions. Common chromophores include C=O, C=C, C≡N.
4. Auxochromes are functional groups that modify the absorption properties of chromoph
This document discusses UV/Visible spectroscopy. It begins by defining spectroscopy as the study of interaction between electromagnetic radiation and matter. It then discusses the different types of spectroscopy including UV spectroscopy, IR spectroscopy, NMR spectroscopy, and emission spectroscopy. The document focuses on UV/Visible spectroscopy. It discusses electromagnetic radiation, including frequency, wavelength, and the relationship between them. It also discusses how electromagnetic radiation interacts with matter through electronic, vibrational, and rotational energy levels. The document then explains the principles of spectroscopy including Lambert's law and Beer's law. It discusses terms such as chromophores and auxochromes as they relate to UV/Visible spectroscopy.
Spectroscopy is the branch of science dealing the study of interaction of electromagnetic radiation with matter. OR
It is the measurement of electromagnetic radiation (EMR) absorbed or emitted when molecule or ions or atoms of a sample move from one energy state to another energy state.
Spectroscopy is the most powerful tool available for the study of atomic & molecular structure and is used in the analysis of a wide range of samples .
Ultraviolet spectroscopy involves the interaction of electromagnetic radiation in the ultraviolet region with organic molecules. There are four main types of electronic transitions that can occur - σ → σ*, n → σ*, π → π*, and n → π*. The π → π* and n → π* transitions are most common in the near-UV region and involve excitation of π and non-bonding electrons. The Beer-Lambert law describes the relationship between absorbance and analyte concentration or path length, but is subject to limitations from chemical and instrumental factors.
Introduction, electromagnetic radiation, units, electromagnetic and absorption spectra, Lambert’s and Beer’s laws, deviations from Lambert’s–Beer’s law, chromophores and auxochromes, absorption and intensity shift, types of electronic transition, effects of solvents,
electronic transition in polyenes, instrumentation, colorimetry, Woodward-Fieser rules for
calculating absorption maximum, analysis of mixtures, applications of ultraviolet and visible
spectroscopy in quantitative analysis of drugs, use of ultra violet and visible spectroscopy in
structural analysis.
Spectroscopy uses electromagnetic radiation to obtain information about molecules that are too small to see. Infrared (IR) spectroscopy analyzes the vibrations of bonds in molecules, which absorb specific wavelengths of infrared light. Different functional groups have characteristic IR absorptions that can be used for structure determination. Mass spectroscopy determines molecular mass by ionizing molecules and analyzing the resulting molecular ions. UV-visible spectroscopy analyzes electronic transitions in molecules, which absorb specific wavelengths and can reveal properties like conjugation. Together these techniques provide essential structural information about organic compounds.
UV/visible spectroscopy involves the interaction of electromagnetic radiation in the ultraviolet-visible spectral region with matter. It works based on electronic transitions in molecules that absorb UV-visible light. The absorbed wavelengths are characteristic of the chemical bonds in a substance. Beer's law states that absorbance is directly proportional to concentration, allowing for quantitative analysis. Chromophores are functional groups that absorb UV-visible light, while auxochromes modify the absorption properties. Shifts in absorption maximum wavelength or intensity can provide information about molecular structure. Applications include qualitative and quantitative analysis of organic compounds.
uv-visible spectroscopy also available video lecture on youtube channel name ...Pharma Rising, Bhopal
The document discusses various topics related to electromagnetic radiation and UV-visible spectroscopy. It defines electromagnetic radiation and its origin from atomic and molecular processes. It describes the electromagnetic spectrum and different regions. UV-visible spectroscopy involves electronic transitions in molecules from ground state to excited state. The types of electronic transitions that can occur are σ-σ*, n-σ*, π-π* and n-π* depending on the orbitals involved. Beer's law states that absorbance is directly proportional to concentration, and deviations from Beer's law can occur due to chemical associations or dissociations, or instrumental factors.
UV/visible spectroscopy involves using electromagnetic radiation in the UV and visible light range to analyze samples. Key principles are that different functional groups and molecular structures absorb radiation at characteristic wavelengths. Absorption of light causes electronic transitions between molecular orbitals. The Beer-Lambert law states that absorbance is directly proportional to concentration, with molar absorptivity coefficients describing this relationship. Absorption spectra provide information to identify compounds and determine concentrations.
This document provides an overview of UV-Visible spectroscopy. Some key points:
- UV-Vis spectroscopy involves promoting electrons from the ground state to excited states using electromagnetic radiation in the ultraviolet and visible regions.
- Different types of electronic transitions are possible including π-π*, n-π*, and σ-σ* transitions. The π-π* and n-π* transitions fall within the UV-Vis range.
- The wavelength of maximum absorbance (λmax) provides information about the energy gap between orbitals. Conjugated systems have longer λmax values and smaller energy gaps.
- Instruments use light sources, monochromators, sample and reference cells, and
Uv visible spectroscopy with InstrumentationSHIVANEE VYAS
Spectroscopy is the study of interaction of electromagnetic radiation with matter. It involves measuring the spectrum (absorption or emission) of a sample when it interacts with electromagnetic radiation such as visible light, UV light, or infrared light. The main types of spectroscopy are absorption spectroscopy and emission spectroscopy. UV-visible spectroscopy measures absorption of ultraviolet and visible light by a substance in solution. It follows Beer-Lambert law where absorbance is directly proportional to concentration and path length of light through the sample. Electronic transitions that occur when absorbing UV-visible light include σ→σ*, n→π*, π→π*, etc. Factors like auxochromes, conjugation, and solvents can cause shifts in the absorption maximum
This document provides an overview of UV-Visible-NIR spectroscopy. It begins with an introduction to electromagnetic radiation and the electromagnetic spectrum. It then discusses various spectroscopy techniques including UV spectroscopy, visible spectroscopy, and NIR spectroscopy. It covers topics such as electronic transitions, terms used in UV-Vis spectroscopy like chromophores and auxochromes, Beer's law, instrumentation, and applications. Some key applications discussed include photo degradation of dyes using photocatalysis, measuring the band gap of TiO2 powder, and estimating the optical properties of nanoparticles.
This document discusses UV-visible spectrophotometry and how it can be used for pharmaceutical analysis. It provides an overview of how light interacts with matter, describing atomic and molecular absorption. It also defines key terms like chromophores, auxochromes, and discusses the different types of electronic transitions that can occur. The document aims to explain the fundamentals of UV-visible spectrophotometry and its applications in quality control for the pharmaceutical industry.
UV/visible spectroscopy involves using electromagnetic radiation in the UV and visible light range to analyze samples. Absorption of this radiation causes electronic transitions between molecular energy levels. The wavelength and intensity of absorption peaks provide information about functional groups in molecules. Factors like conjugation and substituents can cause bathochromic, hypsochromic, hyperchromic, or hypochromic shifts in absorption maxima and intensity. UV/visible spectroscopy has applications in qualitative and quantitative analysis, detection of impurities, and determination of molecular properties.
This document discusses instrumental techniques of analysis, specifically visible and ultraviolet spectroscopy. It covers the basic theory of spectroscopy and how matter interacts with electromagnetic radiation. Key points include:
1. Spectroscopy involves studying the interaction of matter with electromagnetic radiation like light.
2. UV-visible spectroscopy measures absorption of samples when electrons are excited from ground state to excited state.
3. Beer's law and Lambert's law describe the relationship between absorbance, concentration, and path length of samples.
4. The combined Beer-Lambert law states absorbance is directly proportional to concentration and path length of the absorbing species.
Macroeconomics- Movie Location
This will be used as part of your Personal Professional Portfolio once graded.
Objective:
Prepare a presentation or a paper using research, basic comparative analysis, data organization and application of economic information. You will make an informed assessment of an economic climate outside of the United States to accomplish an entertainment industry objective.
Strategies for Effective Upskilling is a presentation by Chinwendu Peace in a Your Skill Boost Masterclass organisation by the Excellence Foundation for South Sudan on 08th and 09th June 2024 from 1 PM to 3 PM on each day.
A review of the growth of the Israel Genealogy Research Association Database Collection for the last 12 months. Our collection is now passed the 3 million mark and still growing. See which archives have contributed the most. See the different types of records we have, and which years have had records added. You can also see what we have for the future.
How to Manage Your Lost Opportunities in Odoo 17 CRMCeline George
Odoo 17 CRM allows us to track why we lose sales opportunities with "Lost Reasons." This helps analyze our sales process and identify areas for improvement. Here's how to configure lost reasons in Odoo 17 CRM
MATATAG CURRICULUM: ASSESSING THE READINESS OF ELEM. PUBLIC SCHOOL TEACHERS I...NelTorrente
In this research, it concludes that while the readiness of teachers in Caloocan City to implement the MATATAG Curriculum is generally positive, targeted efforts in professional development, resource distribution, support networks, and comprehensive preparation can address the existing gaps and ensure successful curriculum implementation.
Biological screening of herbal drugs: Introduction and Need for
Phyto-Pharmacological Screening, New Strategies for evaluating
Natural Products, In vitro evaluation techniques for Antioxidants, Antimicrobial and Anticancer drugs. In vivo evaluation techniques
for Anti-inflammatory, Antiulcer, Anticancer, Wound healing, Antidiabetic, Hepatoprotective, Cardio protective, Diuretics and
Antifertility, Toxicity studies as per OECD guidelines
Exploiting Artificial Intelligence for Empowering Researchers and Faculty, In...Dr. Vinod Kumar Kanvaria
Exploiting Artificial Intelligence for Empowering Researchers and Faculty,
International FDP on Fundamentals of Research in Social Sciences
at Integral University, Lucknow, 06.06.2024
By Dr. Vinod Kumar Kanvaria
Main Java[All of the Base Concepts}.docxadhitya5119
This is part 1 of my Java Learning Journey. This Contains Custom methods, classes, constructors, packages, multithreading , try- catch block, finally block and more.
A Strategic Approach: GenAI in EducationPeter Windle
Artificial Intelligence (AI) technologies such as Generative AI, Image Generators and Large Language Models have had a dramatic impact on teaching, learning and assessment over the past 18 months. The most immediate threat AI posed was to Academic Integrity with Higher Education Institutes (HEIs) focusing their efforts on combating the use of GenAI in assessment. Guidelines were developed for staff and students, policies put in place too. Innovative educators have forged paths in the use of Generative AI for teaching, learning and assessments leading to pockets of transformation springing up across HEIs, often with little or no top-down guidance, support or direction.
This Gasta posits a strategic approach to integrating AI into HEIs to prepare staff, students and the curriculum for an evolving world and workplace. We will highlight the advantages of working with these technologies beyond the realm of teaching, learning and assessment by considering prompt engineering skills, industry impact, curriculum changes, and the need for staff upskilling. In contrast, not engaging strategically with Generative AI poses risks, including falling behind peers, missed opportunities and failing to ensure our graduates remain employable. The rapid evolution of AI technologies necessitates a proactive and strategic approach if we are to remain relevant.
June 3, 2024 Anti-Semitism Letter Sent to MIT President Kornbluth and MIT Cor...Levi Shapiro
Letter from the Congress of the United States regarding Anti-Semitism sent June 3rd to MIT President Sally Kornbluth, MIT Corp Chair, Mark Gorenberg
Dear Dr. Kornbluth and Mr. Gorenberg,
The US House of Representatives is deeply concerned by ongoing and pervasive acts of antisemitic
harassment and intimidation at the Massachusetts Institute of Technology (MIT). Failing to act decisively to ensure a safe learning environment for all students would be a grave dereliction of your responsibilities as President of MIT and Chair of the MIT Corporation.
This Congress will not stand idly by and allow an environment hostile to Jewish students to persist. The House believes that your institution is in violation of Title VI of the Civil Rights Act, and the inability or
unwillingness to rectify this violation through action requires accountability.
Postsecondary education is a unique opportunity for students to learn and have their ideas and beliefs challenged. However, universities receiving hundreds of millions of federal funds annually have denied
students that opportunity and have been hijacked to become venues for the promotion of terrorism, antisemitic harassment and intimidation, unlawful encampments, and in some cases, assaults and riots.
The House of Representatives will not countenance the use of federal funds to indoctrinate students into hateful, antisemitic, anti-American supporters of terrorism. Investigations into campus antisemitism by the Committee on Education and the Workforce and the Committee on Ways and Means have been expanded into a Congress-wide probe across all relevant jurisdictions to address this national crisis. The undersigned Committees will conduct oversight into the use of federal funds at MIT and its learning environment under authorities granted to each Committee.
• The Committee on Education and the Workforce has been investigating your institution since December 7, 2023. The Committee has broad jurisdiction over postsecondary education, including its compliance with Title VI of the Civil Rights Act, campus safety concerns over disruptions to the learning environment, and the awarding of federal student aid under the Higher Education Act.
• The Committee on Oversight and Accountability is investigating the sources of funding and other support flowing to groups espousing pro-Hamas propaganda and engaged in antisemitic harassment and intimidation of students. The Committee on Oversight and Accountability is the principal oversight committee of the US House of Representatives and has broad authority to investigate “any matter” at “any time” under House Rule X.
• The Committee on Ways and Means has been investigating several universities since November 15, 2023, when the Committee held a hearing entitled From Ivory Towers to Dark Corners: Investigating the Nexus Between Antisemitism, Tax-Exempt Universities, and Terror Financing. The Committee followed the hearing with letters to those institutions on January 10, 202
June 3, 2024 Anti-Semitism Letter Sent to MIT President Kornbluth and MIT Cor...
Uv spectroscopy
1. UV- Visible Spectroscopy
Presented by: Harpreet Kaur
M.Pharma 1st sem
Department of Pharmaceutical chemistry
A.S.B.A.S.J.S.M. College of Pharmacy, Bela
UV- Visible Spectroscopy
2. Introduction
Spectroscopy
Spectroscopy is the branch of science dealing the study of
interaction of electromagnetic radiation with matter.
OR
It is the measurement of electromagnetic radiation (EMR)
absorbed or emitted when molecule or ions or atoms of a sample
move from one energy state to another energy state.
Spectroscopy is the most powerful tool available for the study of
atomic & molecular structure and is used in the analysis of a wide
range of samples .
2
3. Principle of Spectroscopy
The principle is based on the measurement of spectrum of a
sample containing atoms /molecules.
Spectrum is a graph of intensity of absorbed or emitted radiation
by sample verses frequency (ν) or wavelength (λ).
Spectrometer is an instrument design to measure the spectrum of
a compound.
a. Absorption Spectroscopy: An analytical technique which
concerns with the measurement of absorption of electromagnetic
radiation. e.g. UV (185 - 400 nm) / Visible (400 – 800 nm)
Spectroscopy, IR Spectroscopy (0.76 - 15μm)
b. Emission Spectroscopy: An analytical technique in which
emission of a particle or radiation is dispersed according to
some property of the emission & the amount of dispersion is
measured. e.g. Mass Spectroscopy
3
4. Electromagnetic Radiation:
Electromagnetic radiation consist of discrete packets of energy
which are called as photons.
A photon consists of an oscillating electric field (E) & an
oscillating magnetic field (M) which are perpendicular to each
other.
4
5. Properties of Electromagnetic radiation:
(a) Wave length: It is the distance between two successive maxima
on an Electromagnetic wave. Units are:- m, cm, mm, nm and
micro meter.
(b) Frequency: Number of wavelength units pass through a given
point in unit time is called as frequency. It is denoted by “v” and
units are cycles per second, Hertz.
(c) Wave number: it is defined as the number of waves per cm in
vacuum.
(d) Velocity: it is the product of wavelength and frequency and is
equal to the velocity of the wave in the medium.
V = n ×λ
The relationship between wavelength & frequency can be written
as: c = ν λ
As photon is subjected to energy, so E = h ν = h c / λ 5
6. Interaction of EMR with matter
1.Electronic Energy Levels:
At room temperature the molecules are in the lowest energy levels E0.
When the molecules absorb UV-visible light from EMR, one of the
outermost bond / lone pair electron is promoted to higher energy state such
as E1, E2, …En, etc is called as electronic transition and the difference is
as:
ΔE = h ν = En - E0 where (n = 1, 2, 3, … etc)
ΔE = 35 to 71 kcal/mole
2.Vibrational Energy Levels:
These are less energy level than electronic energy levels.
The spacing between energy levels are relatively small i.e. 0.01 to 10
kcal/mole.
e.g. when IR radiation is absorbed, molecules are excited from one
vibrational level to another or it vibrates with higher amplitude.
6
7. 3. Rotational Energy Levels:
These energy levels are quantized & discrete.
The spacing between energy levels are even smaller than vibrational
energy levels.
ΔErotational < ΔEvibrational < ΔEelectronic
Electronic Transitions
1. σ→ σ* transition:
An electron in a bonding s-orbital is excited to the corresponding
anti-bonding orbital and observed with saturated compounds.
The energy required is large.
For example, methane (which has only C-H bonds, and can only
undergo σ→ σ* transition transitions) shows an absorbance
maximum at 125 nm.
Absorption maxima due to σ→ σ* transition are not seen in
typical UV-VIS spectra (200 - 700 nm) but in UV-region (125-
135nm) 7
8. 2. n → σ* transition:
Saturated compounds containing atoms with lone pairs (non-
bonding electrons) like O, N, S and halogens are capable of n→ σ*
transition.
These transitions usually need less energy than n → σ* transition.
They can be initiated by light whose wavelength is in the range 150
- 250 nm.
The number of organic functional groups with n → σ* peaks in the
UV region is small.
3. π→ π* transition:
π electron in a bonding orbital is excited to corresponding anti-
bonding orbital π* and observed in conjugated compounds.
Compounds containing multiple bonds like alkenes, alkynes,
carbonyl, nitriles, aromatic compounds, etc undergo π → π*
transitions.
e.g. Alkenes generally absorb in the region 170 to 205 nm.
8
9. 4. n → π* transition:
An electron from non-bonding orbital is promoted to anti-
bonding π* orbital and required lower energy.
Compounds containing double bond involving hetero atoms
(C=O, C≡N, N=O) undergo such transitions.
n → π* transitions require minimum energy and show
absorption at longer wavelength around 300 nm.
.
9
10. Terms used in UV / Visible Spectroscopy
Chromophore:
The part of a molecule responsible for imparting color, are called
as chromospheres. OR
The functional groups containing multiple bonds capable of
absorbing radiations above 200 nm due to n→ π* & π → π*
transitions. e.g. NO2, N=O, C=O, C=N, C≡N, C=C, C=S, etc
Auxochrome:
The functional groups attached to a chromophore which modifies
the ability of the chromophore to absorb light , altering the
wavelength or intensity of absorption. OR
The functional group with non-bonding electrons that does not
absorb radiation in near UV region but when attached to a
chromophore alters the wavelength & intensity of absorption. e.g.
Benzene λmax=255 nm, Phenol λmax=270 nm, Aniline λmax=280 nm
10
11. Absorption & Intensity Shifts
1. Bathochromic Shift (Red Shift): When
absorption maxima (λmax) of a compound
shifts to longer wavelength, it is known as
bathochromic shift or red shift.
2. Hypsochromic Shift (Blue Shift) When
absorption maxima (λmax) of a compound
shifts to shorter wavelength, it is known as
hypsochromic shift or blue shift.
3. Hyperchromic Effect: When absorption
intensity (ε) of a compound is increased, it is
known as hyperchromic shift.
4. Hypochromic Effect: When absorption
intensity (ε) of a compound is decreased, it
is known as hypochromic shift.
11
12. UV- Visible Spectroscopy
12
Theory Involved
When a beam of light falls on a solution or homogenous media ,a
portion of light is reflected ,from the surface of the media, a
portion is absorbed within the medium and remaining is
transmitted through the medium.
• Thus if I0 is the intensity of radiation falling on the media.
• Ir is the amount of radiations reflected,
• Ia is the amount of radiation absorbed &
• It the amount of radiation transmitted
• Then I0 = Ir + Ia + It
13. Laws involved
1. Beer’s law
2. Lambert’s law
3. Beer-lambert’s law
Beer’s Law: When a beam of monochromatic light is passed through a
homogenous absorbing medium, the rate of decrease of intensity of
radiation with increase in the concentration (c) of absorbing species is
directly proportional to the intensity (I) of the incident light (radiation) .
-dI/dc = k I
-dI/I = k d c
On integration of above equation
-ln I = k c + b ( b= integration constant) ……..(1)
When conc. = 0, then there is no absorbance. Here I = I0
Therefor substituting in equation (1)
-ln I = k × 0 + b
-ln I = b 13
14. Substituting the value of b in equation (1)
– ln I = k c – ln I0
ln I0 – ln I = kc
ln I0 / ln I = kc (Since log A – log B = log A/B)
I0 / I = e kc ( removing natural logarithm)
I /I0 = e–kc ( inverse both sides)
I = I0 e–kc …………(2)
Lambert’s law: When a beam of monochromatic light is passed
through a homogenous absorbing medium, the rate of decrease of
intensity of radiation with thickness of absorbing medium is directly
proportional to the intensity of the incident light (radiation) .
dI/dt = kI
I= intensity of incident light of wavelength λ & t= thickness of
medium
Since, I = I0 e–kt ……….(3) 14
15. Now combine the eq.(2) and eq.(3), we get;
I = I0 e–kct
Converting natural logarithm to base 10
I = I0 10–kct
Inverse on both sides
I0 / I = 10 kct
Taking log on both sides
log I0 / I = kct …………..(4)
Here, transmittance (T) = I/I0 and Absorbance (A) = log 1/T
Hence, A = log I0 / I ……………….(5)
Using eq.(4) and eq.(5),
A = kct
Instead of k we can use ɛ, the above equation will be as follow:
A = ɛct
This is mathematical equation for Beer’s- Lambert’s Law.
15
16. A = ɛ c t
Where A = Absorbance;
ɛ = Molecular extinction coefficient;
c = Concentration of sample;
t = Path length ( normally 10mm or 1cm)
ɛ can be expressed as follows:
ɛ = E1%
1cm ×
𝑀𝑜𝑙𝑒𝑐𝑢𝑙𝑎𝑟 𝑤𝑒𝑖𝑔ℎ𝑡
10
16
18. Source of radiation
Requirements of an ideal source
It should be stable and should not allow fluctuations.
It should emit light of continuous spectrum of high and uniform intensity
over the entire wavelength region in which it’s used.
It should provide incident light of sufficient intensity for the transmitted
energy to be detected at the end of optic path.
It should not show fatigue on continued use.
1. Tungsten Halogen Lamp:
Its construction is similar to a house hold lamp.
The bulb contains a filament of Tungsten fixed in evacuated condition and
then filled with inert gas.
The filament can be heated up to 3000 k, beyond this Tungsten starts
sublimating.
It is used when polychromatic light is required.
18
19. DEMERIT:
It emits the major portion of its radiant energy in near IR region of
the spectrum.
2. Hydrogen Discharge Lamp:
In Hydrogen discharge lamp pair of electrodes is enclosed in a
glass tube (provided with silica or quartz window for UV radiation
to pass trough) filled with hydrogen gas.
When current is passed trough these electrodes maintained at high
voltage, discharge of electrons occurs which excites hydrogen
molecules which in turn cause emission of UV radiations in near
UV region.
They are stable and widely used.
19
20. 3. Xenon Discharge Lamp:
It possesses two tungsten electrodes separated by some distance.
These are enclosed in a glass tube (with quartz or fused silica) and
xenon gas is filled under pressure.
An intense arc is formed between electrodes by applying high
voltage. This is a good source of continuous plus additional
intense radiation. Its intensity is higher than the hydrogen
discharge lamp.
DEMERIT:
The lamp since operates at high voltage becomes very hot during
operation and hence needs thermal insulation.
20
21. 4. Mercury arc Lamp:
In mercury arc lamp, mercury vapor is stored under high
pressure and excitation of mercury atoms is done by electric
discharge.
DEMERIT:
Not suitable for continuous spectral studies,(because it doesn’t
give continuous radiations). 21
22. Collimating System
The radiation emitted by the source is collimated (made parallel) by
lenses, mirrors and slits.
Lenses:
Materials used for the lenses must be transparent to the radiation
being used.
Ordinary silicate glass transmits between 350 to 3000nm and is
suitable for visible and near IR region.
Quartz or fused silica is used as a material for lenses to work below
300nm.
22
23. Mirrors
These are used to reflect, focus or collimate light beams in
spectrophotometer.
To minimize the light loss, mirrors are aluminized on their front
surfaces.
Slits:
Slit is an important device in resolving polychromatic radiation
into monochromatic radiation.
To achieve this, entrance slit and exit slit are used.
The width of slit plays an important role in resolution of
polychromatic radiation.
23
24. Momochromators
It is a device used to isolate the radiation of the desired wavelength
from wavelength of the continuous spectra.
The essential elements of monochromators are:
i. An entrance slit
ii. Dispersing element
iii. Exit slit
The entrance slit sharply define the incoming beam of heterochromatic
radiation. The dispersing element disperses the heterochromatic radiation
into its component wavelength. Exit slit allows the nominal wavelength
together with a bond of wavelength on either side of it.
Following types of monochromatic devices are used.
1. Filters
2. Prisms
3. Gratings
24
25. 1. Filters
Two types of filters are used, they are:
a. Absorption filters- works by selective absorption of
unwanted radiation and transmits the radiation which is
required.
Examples- Glass and Gelatin filters.
Selection of absorption filter is done according to the
following procedure:
Draw a filter wheel.
Write the color VIBGYOR in clockwise or anticlockwise
manner, omitting Indigo.
If solution to be analyzed is BLUE in color a filter having a
complimentary color ORANGE is used in the analysis.
Similarly, we can select the required filter in colorimeter,
based upon the color of the solution.
25
26. An Absorption glass filter is made of solid sheet of glass that has
been colored by pigments which is dissolved or dispersed in the
glass.
Merits:-
Simple in construction
Cheaper
Selection of the filter is easy
Demerits:-
Less accurate
Band pass (bandwidth) is more (±20-30nm) i.e. if we have to
measure at 400nm; we get radiation from 370-430nm. Hence less
accurate results are obtained.
26
27. b. Interference filter
Works on the interference phenomenon, causes rejection of
unwanted wavelength by selective reflection.
It is constructed by using two parallel glass plates, which are
silvered internally and separated by thin film of dielectric
material of different (CaF2, SiO, MgF2) refractive index.
These filters have a band pass of 10-15nm with peak
transmittance of 40-60%.
Merits –
Provide greater transmittance and narrower band pass (10-
15nm) as compare to absorption filter.
Inexpensive
Additional filters can be used to cut off undesired wavelength. 27
28. 2. Prism
Prism is made from glass, Quartz or fused silica.
Quartz or fused silica is the choice of material of UV spectrum.
When white light is passed through glass prism, dispersion of
polychromatic light in rainbow occurs. Now by rotation of the
prism different wavelengths of the spectrum can be made to pass
through in exit slit on the sample.
The effective wavelength depends on the dispersive power of
prism material and the optical angle of the prism.
28
29. There are two types of mounting in an instrument one is called
‘Cornu type’(refractive), which has an optical angle of 60o and
its adjusted such that on rotation the emerging light is allowed to
fall on exit slit. Show in fig. (a)
The other type is called “Littrow type”(reflective), which has
optical angle 30o and its one surface is aluminized with reflected
light back to pass through prism and to emerge on the same side
of the light source i.e. light doesn’t pass through the prism on
other side. Show in fig.(b)
29
30. 3. Gratings
o They are most efficient in converting a polychromatic light to
monochromatic light. As a resolution of +/- 0.1nm could be
achieved by using gratings. As the gratings are expensive, they are
commonly used in spectrophotometers.
o Gratings are of two types.
1. Diffraction grating.
2. Transmission gratings.
1. Diffraction grating:
More refined dispersion of light is obtained by means of diffraction
gratings.
These consist of large number of parallel lines (grooves) about
15000-30000/ inch is ruled on highly polished surface of aluminum.
To make the surface reflective, a deposit of aluminum is made on
the surface.
Diffraction produces reinforcement.
30
31. Mechaism:
The ray which is incident on grating gets reinforced with reflected
ray and hence resulting radiation has wavelength, which is
governed by equation:
mλ = b (sin i ± sin r)
Where λ = wavelength of light produced, b = grating spacing, i = angle
of incidence, r = angle of reflection, m = order (1,2,3……..)
31
32. 2. Transmission grating:
It is similar to diffraction grating but refraction takes place instead
of reflection.
Refraction produces reinforcement, this occurs when radiation
transmitted through grating reinforces with the partially refracted
radiation.
The wavelength of radiation produce by transmission grating can be
expressed by following equation:
λ = d sin θ/ m
Where λ = wavelength of light produced, d = 1/ lines per cm, θ = angle
at deflection or diffraction, m = order (1,2,3……..)
32
33. Advantages
Grating gives higher and linear dispersions compared to prism
monochromator.
Can be used over wide wavelength ranges.
Gratings can be constructed with materials like aluminium which is
resistant to atmospheric moisture.
Provide light of narrow wavelength.
No loss of energy due to absorption.
33
34. Sample holder or cuvettes
The cells or cuvettes are used for handling liquid samples.
The cell may either be rectangular or cylindrical in nature.
For study in UV region; the cells are prepared from quartz or fused
silica where as fused glass is used for visible region.
The surfaces of absorption cells must be kept clean. No
fingerprints should be present on cells.
Cleaning is carried out washing with distilled water or with dilute
alcohol, acetone.
The cell or cuvette that contain samples for analysis should fulfil 3
conditions:
a) They must be uniform in construction, the thickness must be
constant and surfaces facing the incident light must be optically
flat.
b) The materials of construction should be inert to solvents.
c) They must transmit light of the wavelength used. 34
35. Detectors
Device which converts light energy into electrical signals, that are
displayed on readout devices.
The transmitted radiation falls on the detector which determines the
intensity of radiation absorbed by sample.
The following types of detectors are employed in instrumentation of
absorption spectrophotometer
1. Barrier layer cell/Photovoltaic cell
2. Phototubes/ Photo emissive tube
3. Photomultiplier tube
35
36. Requirements of an ideal detector:-
a. It should give quantitative response.
b. It should have high sensitivity and low noise level.
c. It should have a short response time.
d. It should provide signal or response quantitative to wide spectrum
of radiation received.
1. Barrier layer cell/Photovoltaic cell:
The detector has a thin film metallic layer coated with silver or gold
and acts as an electrode.
It also has a metal base plate which acts as another electrode.
These two layers are separated by a semiconductor layer of
selenium.
36
37. When light radiation falls on selenium layer, electrons become
mobile and are taken up by transparent metal layer.
This creates a potential difference between two electrodes & causes
the flow of current.
When it is connected to galvanometer, a flow of current observed
which is proportional to the intensity and wavelength of light
falling on it.
37
38. 2. Phototubes/ Photo emissive tube:
Consists of a evacuated glass tube with a photocathode and a
collector anode.
The surface of photocathode is coated with a layer of elements like
cesium, silver oxide or mixture of them.
When radiant energy falls on photosensitive cathode, electrons are
emitted which are attracted to anode causing current to flow.
More sensitive compared to barrier layer cell and therefore widely
used.
38
39. 3. Photomultiplier tube:
The principle employed in this detector is that, multiplication of
photoelectrons by secondary emission of electrons.
In a vacuum tube, a primary photo-cathode is fixed which
receives radiation from the sample.
Some eight to ten dynodes are fixed each with increasing
potential of 75-100V higher than preceding one.
Near the last dynode is fixed an anode or electron collector
electrode.
Photo-multiplier is extremely sensitive to light and is best suited
where weaker or low radiation is received.
39
41. Read-out device
The signals from the detector after amplification are finally
received by the recoding system or read-out device.
The recording is done by recorder pen.
41
42. Single beam UV-Spectrophotometer
Light from the source is carried through lens and/or through aperture
to pass through a suitable filter.
The type of filter to be used is governed by the colour of the
solution.
The sample solution to be analysed is placed in cuvettes.
42
43. After passing through the solution, the light strikes the surface of
detector (barrier-layer cell or phototube) and produces electrical
current.
The output of current is measured by the deflection of needle of
light-spot galvanometer or micro ammeter. This meter is calibrated
in terms of transmittance as well as optical density.
The readings of solution of both standard and unknown are recorded
in optical density units after adjusting instrument to a reagent blank.
43
44. Double Beam UV-Spectrophotometer
Double beam instrument is the one in which two beams are formed in
the space by a U shaped mirror called as beam splitter or beam
chopper .
Chopper is a device consisting of a circular disc. One third of the disc
is opaque and one third is transparent, remaining one third is
mirrored. It splits the monochromatic beam of light into two beams of
equal intensities.
44
45. Advantages of single & double beam spectrophotometer:
Single beam-
o Simple in construction, Easy to use and economical
Double beam-
o It facilitates rapid scanning over wide λ region.
o Fluctuations due to radiation source are minimized.
o It doesn’t require adjustment of the transmittance at 0% and 100%
at each wavelength.
o It gives ratio of intensities of sample & reference beams
simultaneously.
45
46. Disadvantages of single & double beam
spectrophotometer:
Single beam
o Any fluctuation in the intensity of radiation sources affects the
absorbance.
o Continuous spectrum is not obtained.
Double beam
o Construction is complicated.
o Instrument is expensive.
46
47. Comparison
s.no Single beam Double beam
1. Calibration should be done with blank every
time, before measuring the absorbance or
transmittance of sample.
Calibration is done only in the
beginning.
2. Radiant energy intensity changes with
fluctuation of voltage.
It permits a large degree of inherent
compensation for fluctuations in the
intensity of the radiant energy.
3. It measure the total amount of transmitted
light reaching the detector
It measures the percentage of light
absorbed by the sample.
4. In single beam it’s not possible to compare
blank and sample together.
In double beam it’s possible to do
direct one step comparison of sample
in one path with a standard in the
other path.
5. In single beam radiant energy wavelength
has to be adjusted every time.
In this scanning can be done over a
wide wavelength region
6. Working on single beam is tedious and time
consuming.
Working on double beam is fast and
non tedious.
47
48. Applications for UV- Visible Spectroscopy
Qualitative & Quantitative Analysis: It is used for characterizing
aromatic compounds and conjugated olefins. It can be used to find
out molar concentration of the solute under study.
Detection of impurities: It is one of the important method to detect
impurities in organic solvents. Additional peaks can be observed
due to impurities in the sample and it can be compared with that of
standard raw material.
Structure elucidation of organic compounds: The presence or
absence of unsaturation, the presence of hetero atoms like S, N, O
or halogens can be determined.
Structural analysis of organic compounds:
Effect of conjugation: Extended conjugation shifts the λmax to
longer λ (Bathochromatic shift) and reduction of the compound or
saturation of double bonds leads to the opposite effect i.e.
hypsochromic shift.
48
49. Effect of geometric isomerism: Trans isomer absorbs at longer
wavelength than cic isomers. Cis to trans conversion is
bathochromic shift and hyper-chromic effect.
Alkyl substitution shifts the λmax to longer wave length
(bathochromic shift).
Number of rings: The addition of rings causes bathochromic shift.
49
50. Choice of Solvent
• The choice of the solvent to be used in ultraviolet spectroscopy is
quite important.
• The first criterion for a good solvent is that it should not absorb
ultraviolet radiation in the same region as the substance whose
spectrum is being determined. Usually, solvents that do not contain
conjugated systems are most suitable for this purpose, although they
vary regarding the shortest wavelength at which they remain
transparent to ultraviolet radiation.
• A second criterion for a good solvent is its effect on the fine structure
of an absorption band.
• A non- polar solvent does not hydrogen bond with the solute, and the
spectrum of the solute closely approximates the spectrum that would
be produced in the gaseous state, in which fine structure is often
observed.
• In a polar solvent, the hydrogen bonding forms a solute–solvent
complex, and the fine structure may disappear.
50
51. Table 1, lists some common ultraviolet spectroscopy solvents and their
cutoff points or minimum regions of transparency. Of the solvents listed
in Table 1, water, 95% ethanol, and hexane are most commonly used.
Each is transparent in the regions of the ultraviolet spectrum in which
interesting absorption peaks from sample molecules are likely to occur.
Table 1 Solvent used
Solvents Wavelength Solvent Wavelength
Acetonitrile 190 nm n-Hexane 201 nm
Chloroform 240nm methanol 205nm
Cyclohexane 195nm Iso-octane 195nm
1,4-Dioxane 215nm Water 190nm
95% Ethanol 205nm Trimrthyl phosphate 210nm
51
52. Woodward- Fieser Rule
Woodward (1941) predicted λmax values .
Woodward–Fieser rules for dienes is either homoannular with both double
bonds contained in one ring or heteroannular with two double bonds
distributed between two rings.
52
Structural feature
λmax effect
(in nanometers)
Base value for heteroannular diene 214
Base value for homoannular diene 253
Increments
Double bond extending conjugation + 30
Alkyl substituent or ring residue + 5
Exocyclic double bond + 5
acetate group + 0
Ether group + 6
Thioether group + 30
bromine, chlorine + 5
secondary amine group + 60
53. With the aid of these rules the UV absorption maximum can be
predicted, for example in these two compounds:
In the compound on the left, the base value is 214 nm (a
heteroannular diene). This diene group has 4 alkyl substituents
(labeled 1,2,3,4) and the double bond in one ring is exocyclic to
the other (adding 5 nm for an exocyclic double bond). In the
compound on the right, the diene is homoannular with 4 alkyl
substituents. Both double bonds in the central B ring are exocyclic
with respect to rings A and C.
53