Downloaded 1,121 times


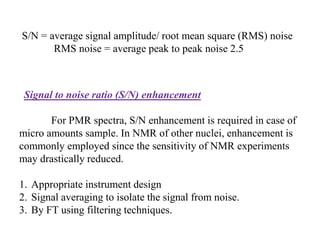
![4) Signal to Noise ratio (S/N)
Measures the efficiency of an instrument to distinguish between the
signals and electronic noise
S/N = mean / standard deviation
It is a function of variables such as instrumental and nature of the
sample.
S/N ratio depends on
The strength of the applied magnetic field
S/N α [ H0 ]3/2
The more intense the magnetic field, the better will be S/N](https://image.slidesharecdn.com/ftnmr2-131206075301-phpapp01/85/FT-NMR-21-320.jpg)


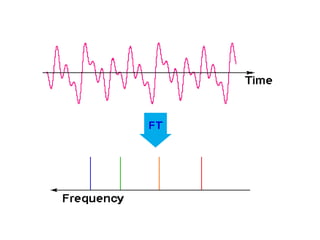
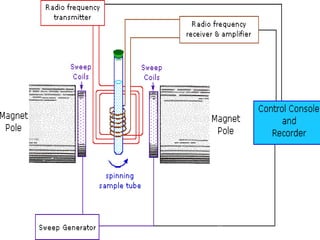
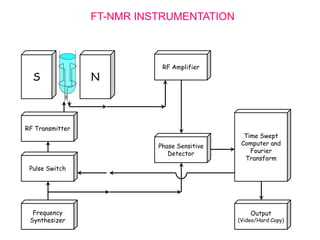
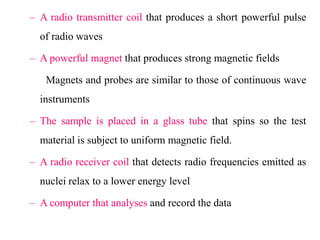
The document discusses Fourier-transform nuclear magnetic resonance (FT-NMR) spectroscopy. It provides an introduction to Fourier transforms and their use in converting time domain NMR spectra to frequency domain spectra. It describes the components of an FT-NMR instrument, including an RF transmitter coil, magnet, receiver coil, and computer. Key advantages of FT-NMR are its dramatic increase in sensitivity over continuous wave NMR, allowing detection of samples under 5 mg, and its ability to rapidly provide high signal-to-noise ratio spectra.