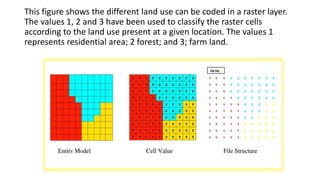
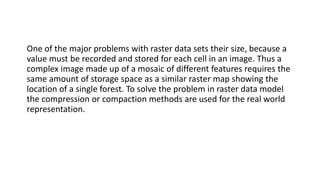
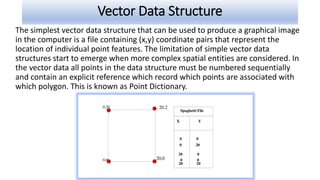
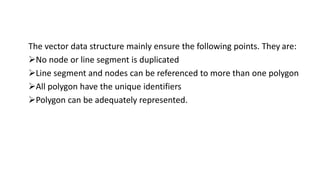
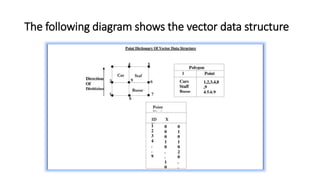
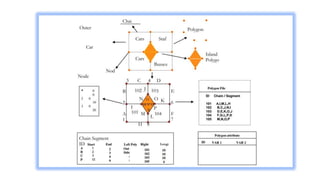
Spatial data can be represented using either a raster or vector data model. The raster model divides space into a grid of cells, with each cell storing an attribute value. The vector model represents features as points, lines, and polygons made up of x,y coordinates. Common spatial data structures include raster grids for storing raster data and point dictionaries and topological networks for vector data. The two models have different strengths, with raster better for overlays and modeling surfaces, and vector more accurate for features and cartography.
4. Spatial Definition:
Spatial data describes the location and shape of geographic features,
and their spatial relationship to the features. The information
contained in the spatial database is held in the form of digital
coordinates which describe the spatial features it mainly depends on
the latitude and longitude of the feature.
5. Spatial Data Model
The GIS model can be split into two parts
A Model of spatial form and
A model of Spatial Process.
The model of spatial form represents the structure and distribution of features in
geographical space.
In order to model spatial process, the interaction between these features must be
considered. Computers require unambiguous instructions on how to turn data
about spatial entities into graphical representations. This process is the second
stage in designing and implanting a data model. At present there are two main
ways in which computers can be display spatial entities. There are two method of
spatial data model. They are-
1. Raster Data Model
2. Vector Data Model
6. The Raster Data Model:
The Raster data model is one of the important spatial data model described
as tessellation. In the raster world individual cells are used as the building
block for creating images of point, line, area, and network and surface
entities.
In the raster data model the basic building block is the individual grid cell,
and the shape and character of an entity is created by the grouping of cells.
The size of the grid cell is very important as it Raster is a method for the
storage, Processing and display of spatial data.
Each area is divided into rows and columns, which form a regular grid
structure. Each cell must be rectangular in shape, but not necessarily square.
Each cell within this matrix contains location co-ordinates as well as an
attribute value. The origin of rows and column is at the upper left corner of
the grid.
Rows function as the “y” coordinate and column as ”x” coordinate in a two
dimensional system. A cell is defined by its location in terms of rows and
columns.
7. The Vector Data Model:
A vector spatial data model uses two dimensional Cartesian [x, y] co-ordinates
to store the shape of spatial entity. In the vector spatial data can be
represented by using point. It is the basic building blocks from which all spatial
entities are constructed. The simplest spatial entity, the point is represented
by a single co-ordinate pair. Line and area entities are constructed by
connecting a series of points into chains and polygons. The more complex the
shape of a line or area feature the greater the number of points required
representing it.
8. Spatial Data Structure:
Data structures provide the information that the computer requires to
reconstruct the spatial data model in digital form. There are many
different data structure in use in GIS. Based on that the spatial data
structures can be classified according to whether they are used to
structure raster or vector data.
9. Raster Data Structures
In the raster data model, each location is represented as a cell. The matrix of
cells, organized into rows and columns, is called a grid. Each row contains a
group of cells with values representing a geographic phenomenon. Cell
values are numbers, which represent nominal data such as land- use classes,
measures of light intensity or relative measures. The cells in each line of the
image are mirrored by an equivalent row of numbers in the file structure.
10. In a simple raster data structure, such as different spatial features must
be stored as a separate data layers. However, if the entities do not
occupy the same geographical location then it is possible to store them
all in a single layer, with an entity code given to each cell.
11. This figure shows the different land use can be coded in a raster layer.
The values 1, 2 and 3 have been used to classify the raster cells
according to the land use present at a given location. The values 1
represents residential area; 2 forest; and 3; farm land.
12. One of the major problems with raster data sets their size, because a
value must be recorded and stored for each cell in an image. Thus a
complex image made up of a mosaic of different features requires the
same amount of storage space as a similar raster map showing the
location of a single forest. To solve the problem in raster data model
the compression or compaction methods are used for the real world
representation.
13. Vector Data Structure
The simplest vector data structure that can be used to produce a graphical image
in the computer is a file containing (x,y) coordinate pairs that represent the
location of individual point features. The limitation of simple vector data
structures start to emerge when more complex spatial entities are considered. In
the vector data all points in the data structure must be numbered sequentially
and contain an explicit reference which record which points are associated with
which polygon. This is known as Point Dictionary.
14. The vector data structure mainly ensure the following points. They are:
No node or line segment is duplicated
Line segment and nodes can be referenced to more than one polygon
All polygon have the unique identifiers
Polygon can be adequately represented.
16. In vector structure topology is concerned with connectivity between
entities and not their physical shape
Boundaries are identified through network of arcs, checking polygons
for closure, and linking arcs into polygons.
The area of polygon can calculated and unique identification
numbers are attached.
This identifier would allow non spatial information to be linked to a
specific polygon.
17.
18. Comparison of raster and vector data models
• The vector data model defines boundaries. There are no boundaries
defined in the raster data model.
• The vector model represents location as x-y coordinates in a Cartesian
coordinate system. The raster model represents location as cells, also in
a Cartesian coordinate system. Data store rows and columns of cell
values.
• The vector model represents features with well-defined boundaries; the
raster model represents a more generalized view. The raster model can
also represent gradual transition between features and surfaces, such as
soil classification and elevation.
• The primary focus of the vector data model is the geographic feature;
the primary focus of the raster data model is location.
19. • The vector model represents feature shape accurately; the raster
model represents rectangular areas and thus is more generalized and
less accurate.
• The vector model is used for high-quality cartography and where
accuracy and precision are important, such as for cadastral (property)
applications. The raster data model is useful for image/picture storage
and is well suited to many spatial modeling operations such as
modeling surface storm runoff and forest fire spread.
• The overlay operation examines two datasets to determine what
geographic features exist at the same location. Overlaying vectors is a
complex operation; the nature of the raster data model allows simple
and fast overlays.