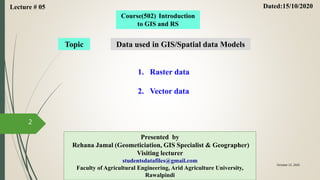
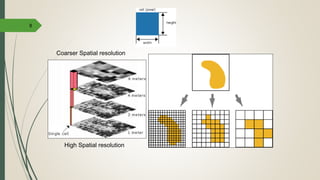
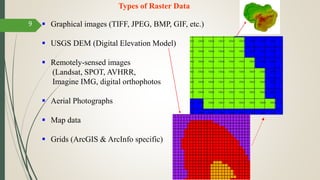
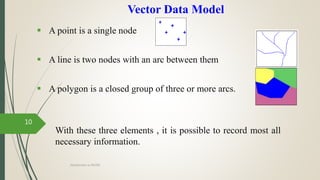
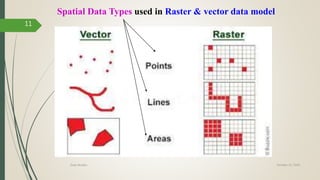
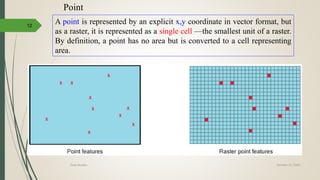
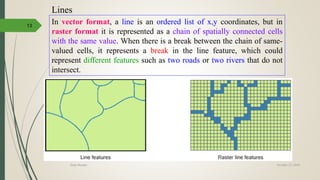
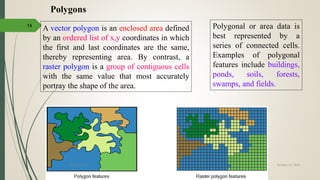
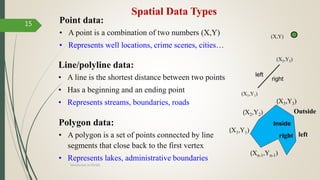
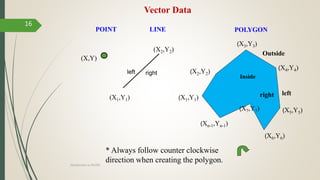
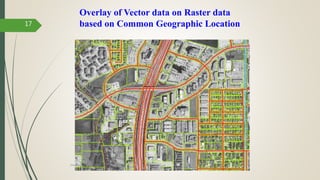
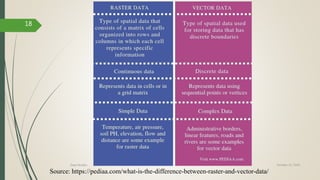
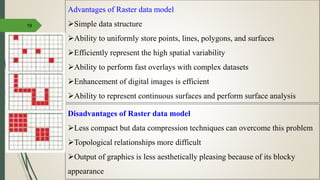
This document discusses raster and vector data models used in GIS. Raster data models use a grid structure of cells organized by rows and columns, with each cell containing a numeric value. Vector data models represent spatial features as points, lines, and polygons using x,y coordinates. The key spatial data types—points, lines, and polygons—are explained for both raster and vector formats. Advantages and disadvantages of each model are provided. The document is a lecture on GIS data models presented by Rehana Jamal to students at Arid Agriculture University.
What is GIS ?
Dimensions Modeling in GIS ?
GIS Models real word(Raster, Vector)
GIS Challenges ? Data and Tech.
GIS Functionality
Building information modeling (BIM) ?
GIS Components
Spatial Data
Spatial analysis and Analysis Tools ( GIS )designQube
This is an academic presentation made to understand the role of spatial analysis in real urban designing. It also explores several analysis tools in GIS
This presentation is about the raster and vector data in GIS which is important and costly as well, through the presentation we will learn about both type of data.
An introduction to GIS Data Types. Strengths and weaknesses of raster and vector data are discussed. Also covered is the importance of topology. Concludes with a discussion of the vector-based format of OpenStreetMap data.
ePOM - Intro to Ocean Data Science - Raster and Vector Data FormatsGiuseppe Masetti
E-learning Python for Ocean Mapping (ePOM) project.
Complementary slides to the Raster and Vector Data Formats module (part of the Introduction to Ocean Data Science training).
More details at https://www.hydroffice.org/epom
Attribute data input and data display :
Attribute data in GIS, Relational model, Data entry, Manipulation of fields
and attribute data, cartographic symbolization, types of maps, typography,
map design, map production
Big Data and Geospatial with HPCC SystemsHPCC Systems
This presentation covers one topic that we have mastered after several years : Geospatial.
We will reveal how we deal with very specific spatial challenges in our day to day use cases :
• Answer questions combining the best of BigData and geospatial analysis.
• Ingestion and use of raster and vector data with our Massive Parallel Processing platform (Thor).
• Store and query spatial information with sub-second queries, using our data refinery (Roxie)
And much more under the umbrella of LexisNexis HPCC Systems (High Performance Computing Cluster), an open source platform for Big Data processing and analytics.
DEFINITION :
GIS is a powerful set of tools for collecting, storing , retrieving at will, transforming and displaying spatial data from the real world for a particular set of purposes
APPLICATION AREAS OF GIS
Agriculture
Business
Electric/Gas utilities
Environment
Forestry
Geology
Hydrology
Land-use planning
Local government
Mapping
11. Military
12. Risk management
13. Site planning
14. Transportation
15. Water / Waste water industry
COMPONENTS OF GIS
DATA INPUT
SPATIAL DATA MODEL
Data Model:
It describes in an abstract way how the data is represented in an information system or in DBMS
Spatial Data Model :
The models or abstractions of reality that are intended to have some similarity with selected aspects of the real world
Creation of analogue and digital spatial data sets involves seven levels of model development and abstraction
SPATIAL DATA MODEL
Conceptual model : A view of reality
Analog model : Human conceptualization leads to analogue abstraction
Spatial data models : Formalization of analogue abstractions without any conventions
Database model : How the data are recorded in the computer
Physical computational model : Particular representation of the data structures in computer memory
Data manipulation model : Accepted axioms and rules for handling the data
SPATIAL DATA MODEL
SPATIAL DATA MODEL
Objects on the earth surface are shown as continuous and discrete objects in spatial data models
Types of data models
Raster data model
vector data models
RASTER DATA MODEL
Basic Elements :
Extent
Rows
Columns
Origin
Orientation
Resolution: pixel = grain = grid cell
Ex: Bit Map Image (BMP),Joint Photographic Expert Group (JPEG), Portable Network Graphics(PNG) etc
RASTER DATA MODEL
VECTOR DATA MODEL
Basic Elements:
Location (x,y) or (x,y,z)
Explicit, i.e. pegged to a coordinate system
Different coordinate system (and precision) require different values
o e.g. UTM as integer (but large)
o Lat, long as two floating point numbers +/-
Points are used to build more complex features
Ex: Auto CAD Drawing File(DWG), Data Interchange(exchange) File(DXF), Vector Product Format (VPF) etc
VECTOR DATA MODEL
RASTER vs VECTORRaster is faster but Vector is corrector
TESSELLATIONS OF CONTINUOUS FIELDS
Triangular Irregular Network: (TIN)
TIN is a vector data structure for representing geographical information that is continuous
Digital elevation model
TIN is generally used to create Digital Elevation Model (DEM)
DIGITAL ELEVATION MODEL
DATA STRUCTURES
Data structure tells about how the data is stored
Data organization in raster data structures
Each cell is referenced directly
Each overlay Is referenced directly
Each mapping unit is referenced directly
Each overlay is separate file with general header
Data models are a set of rules and/or constructs used to describe and represent aspects of the real world in a computer. GIS can handle four data models for various applications. This module explains those four.
basic concept of geographic data,GIS and its component,data acquisition ,raster, vector formats,spatial data,topology and data model data output ,GIS applications
A spatial database, or geodatabase is a database that is optimized to store and query data
that represents objects defined in a geometric space. Most spatial databases allow representing simple geometric objects such as points, lines and polygons.
Topics:
1. Introduction to GIS
2. Components of GIS
3. Types of Data
4. Spatial Data
5. Non-Spatial Data
6. GIS Operations
7. Coordinate Systems
8. Datum
9. Map Projections
10. Raster Data Compression Techniques
11. GIS Software
12. Free GIS Data Resources
Artificial Reefs by Kuddle Life Foundation - May 2024punit537210
Situated in Pondicherry, India, Kuddle Life Foundation is a charitable, non-profit and non-governmental organization (NGO) dedicated to improving the living standards of coastal communities and simultaneously placing a strong emphasis on the protection of marine ecosystems.
One of the key areas we work in is Artificial Reefs. This presentation captures our journey so far and our learnings. We hope you get as excited about marine conservation and artificial reefs as we are.
Please visit our website: https://kuddlelife.org
Our Instagram channel:
@kuddlelifefoundation
Our Linkedin Page:
https://www.linkedin.com/company/kuddlelifefoundation/
and write to us if you have any questions:
info@kuddlelife.org
"Understanding the Carbon Cycle: Processes, Human Impacts, and Strategies for...MMariSelvam4
The carbon cycle is a critical component of Earth's environmental system, governing the movement and transformation of carbon through various reservoirs, including the atmosphere, oceans, soil, and living organisms. This complex cycle involves several key processes such as photosynthesis, respiration, decomposition, and carbon sequestration, each contributing to the regulation of carbon levels on the planet.
Human activities, particularly fossil fuel combustion and deforestation, have significantly altered the natural carbon cycle, leading to increased atmospheric carbon dioxide concentrations and driving climate change. Understanding the intricacies of the carbon cycle is essential for assessing the impacts of these changes and developing effective mitigation strategies.
By studying the carbon cycle, scientists can identify carbon sources and sinks, measure carbon fluxes, and predict future trends. This knowledge is crucial for crafting policies aimed at reducing carbon emissions, enhancing carbon storage, and promoting sustainable practices. The carbon cycle's interplay with climate systems, ecosystems, and human activities underscores its importance in maintaining a stable and healthy planet.
In-depth exploration of the carbon cycle reveals the delicate balance required to sustain life and the urgent need to address anthropogenic influences. Through research, education, and policy, we can work towards restoring equilibrium in the carbon cycle and ensuring a sustainable future for generations to come.
Characterization and the Kinetics of drying at the drying oven and with micro...Open Access Research Paper
The objective of this work is to contribute to valorization de Nephelium lappaceum by the characterization of kinetics of drying of seeds of Nephelium lappaceum. The seeds were dehydrated until a constant mass respectively in a drying oven and a microwawe oven. The temperatures and the powers of drying are respectively: 50, 60 and 70°C and 140, 280 and 420 W. The results show that the curves of drying of seeds of Nephelium lappaceum do not present a phase of constant kinetics. The coefficients of diffusion vary between 2.09.10-8 to 2.98. 10-8m-2/s in the interval of 50°C at 70°C and between 4.83×10-07 at 9.04×10-07 m-8/s for the powers going of 140 W with 420 W the relation between Arrhenius and a value of energy of activation of 16.49 kJ. mol-1 expressed the effect of the temperature on effective diffusivity.
Willie Nelson Net Worth: A Journey Through Music, Movies, and Business Venturesgreendigital
Willie Nelson is a name that resonates within the world of music and entertainment. Known for his unique voice, and masterful guitar skills. and an extraordinary career spanning several decades. Nelson has become a legend in the country music scene. But, his influence extends far beyond the realm of music. with ventures in acting, writing, activism, and business. This comprehensive article delves into Willie Nelson net worth. exploring the various facets of his career that have contributed to his large fortune.
Follow us on: Pinterest
Introduction
Willie Nelson net worth is a testament to his enduring influence and success in many fields. Born on April 29, 1933, in Abbott, Texas. Nelson's journey from a humble beginning to becoming one of the most iconic figures in American music is nothing short of inspirational. His net worth, which estimated to be around $25 million as of 2024. reflects a career that is as diverse as it is prolific.
Early Life and Musical Beginnings
Humble Origins
Willie Hugh Nelson was born during the Great Depression. a time of significant economic hardship in the United States. Raised by his grandparents. Nelson found solace and inspiration in music from an early age. His grandmother taught him to play the guitar. setting the stage for what would become an illustrious career.
First Steps in Music
Nelson's initial foray into the music industry was fraught with challenges. He moved to Nashville, Tennessee, to pursue his dreams, but success did not come . Working as a songwriter, Nelson penned hits for other artists. which helped him gain a foothold in the competitive music scene. His songwriting skills contributed to his early earnings. laying the foundation for his net worth.
Rise to Stardom
Breakthrough Albums
The 1970s marked a turning point in Willie Nelson's career. His albums "Shotgun Willie" (1973), "Red Headed Stranger" (1975). and "Stardust" (1978) received critical acclaim and commercial success. These albums not only solidified his position in the country music genre. but also introduced his music to a broader audience. The success of these albums played a crucial role in boosting Willie Nelson net worth.
Iconic Songs
Willie Nelson net worth is also attributed to his extensive catalog of hit songs. Tracks like "Blue Eyes Crying in the Rain," "On the Road Again," and "Always on My Mind" have become timeless classics. These songs have not only earned Nelson large royalties but have also ensured his continued relevance in the music industry.
Acting and Film Career
Hollywood Ventures
In addition to his music career, Willie Nelson has also made a mark in Hollywood. His distinctive personality and on-screen presence have landed him roles in several films and television shows. Notable appearances include roles in "The Electric Horseman" (1979), "Honeysuckle Rose" (1980), and "Barbarosa" (1982). These acting gigs have added a significant amount to Willie Nelson net worth.
Television Appearances
Nelson's char
WRI’s brand new “Food Service Playbook for Promoting Sustainable Food Choices” gives food service operators the very latest strategies for creating dining environments that empower consumers to choose sustainable, plant-rich dishes. This research builds off our first guide for food service, now with industry experience and insights from nearly 350 academic trials.
2. Lecture # 05 Dated:15/10/2020
Course(502) Introduction
to GIS and RS
Data used in GIS/Spatial data Models
Topic
Presented by
Rehana Jamal (Geometiciation, GIS Specialist & Geographer)
Visiting lecturer
studentsdatafiles@gmail.com
Faculty of Agricultural Engineering, Arid Agriculture University,
Rawalpindi
2
October 15, 2020
1. Raster data
2. Vector data
3. 3
What is Model?
Introduction:
The real world is too
complex for our direct
understanding so we
create “Models” of
reality having similarity
with selected aspects of
the real world.
Source:https://mp-mas.uni-
hohenheim.de/uploads/pics/Spatial.jpg
GIS organize spatial set as a
set of layers
Databases organize dataset as
a collection of tables
5. 5
What is Spatial data Model?
Traditionally spatial data has been stored and presented in the form
of a map. Two basic types of spatial data models have evolved for
storing geographic data digitally. These are referred to as:
Spatial data are the “life blood” of any GIS
(Source: Wetland and Environmental Applications of GIS Edited by John G.Lyon and Jack Mclarthy)
Raster data
Vector data
6. 6
Raster data models & structure incorporate
the use of a grid-cell data structure (aerial
imagery).
In Raster data the geographic area(space) is
divided into cells identified by row and
column.
It comprises of discrete pixels(picture
element) with numeric value.
This data structure is commonly called raster.
Raster data Model The term
raster implies a regularly
spaced grid other tessellated
data structures do exist in
grid based GIS systems.
October 15, 2020
Data Models
Raster data Model
7. 7
Spatial resolution refers to the dimension of the cell size representing the area
covered on the ground OR spatial resolution refers to the cell size (the area
covered on the ground and represented by a single cell). Therefore, if the area
covered by a cell is 5 x 5 meters, the resolution is 5 meters. The higher the
resolution of a raster, the smaller the cell size and, thus, the greater the detail.
9. Graphical images (TIFF, JPEG, BMP, GIF, etc.)
USGS DEM (Digital Elevation Model)
Remotely-sensed images
(Landsat, SPOT, AVHRR,
Imagine IMG, digital orthophotos
Aerial Photographs
Map data
Grids (ArcGIS & ArcInfo specific)
Types of Raster Data
9
10. A point is a single node
A line is two nodes with an arc between them
A polygon is a closed group of three or more arcs.
Vector Data Model
With these three elements , it is possible to record most all
necessary information.
Introduction to RS/GIS
10
11. October 15, 2020
Data Models
11
Spatial Data Types used in Raster & vector data model
12. 12
A point is represented by an explicit x,y coordinate in vector format, but
as a raster, it is represented as a single cell —the smallest unit of a raster.
By definition, a point has no area but is converted to a cell representing
area.
Point
October 15, 2020
Data Models
13. 13
In vector format, a line is an ordered list of x,y coordinates, but in
raster format it is represented as a chain of spatially connected cells
with the same value. When there is a break between the chain of same-
valued cells, it represents a break in the line feature, which could
represent different features such as two roads or two rivers that do not
intersect.
Lines
October 15, 2020
Data Models
14. 14
A vector polygon is an enclosed area defined
by an ordered list of x,y coordinates in which
the first and last coordinates are the same,
thereby representing area. By contrast, a
raster polygon is a group of contiguous cells
with the same value that most accurately
portray the shape of the area.
Polygons
October 15, 2020
Data Models
Polygonal or area data is
best represented by a
series of connected cells.
Examples of polygonal
features include buildings,
ponds, soils, forests,
swamps, and fields.
15. Point data:
• A point is a combination of two numbers (X,Y)
• Represents well locations, crime scenes, cities…
Line/polyline data:
• A line is the shortest distance between two points
• Has a beginning and an ending point
• Represents streams, boundaries, roads
Polygon data:
• A polygon is a set of points connected by line
segments that close back to the first vertex
• Represents lakes, administrative boundaries
Spatial Data Types
(X,Y)
(X1,Y1)
(X2,Y2)
left
right
(X1,Y1)
(Xn-1,Yn-1)
(X2,Y2)
Inside
Outside
left
right
(X3,Y3)
Introduction to RS/GIS
15
17. Overlay of Vector data on Raster data
based on Common Geographic Location
Introduction to RS/GIS
17
18. October 15, 2020
Data Models
18
Source: https://pediaa.com/what-is-the-difference-between-raster-and-vector-data/
19. 19
Advantages of Raster data model
Simple data structure
Ability to uniformly store points, lines, polygons, and surfaces
Efficiently represent the high spatial variability
Ability to perform fast overlays with complex datasets
Enhancement of digital images is efficient
Ability to represent continuous surfaces and perform surface analysis
Disadvantages of Raster data model
Less compact but data compression techniques can overcome this problem
Topological relationships more difficult
Output of graphics is less aesthetically pleasing because of its blocky
appearance
20. 20
Advantages of Vector data model
More compact data structure
Efficiently encoding of topology
Efficient topological operations j.e. network analysis
Disadvantages of Vector data model
More complex data structure
Difficult overlay operations
Representation of high spatial variability is inefficient
Enhancement of digital images cannot be effectively done
21. 21
Summary
Data used in GIS/Spatial data Models
(Raster &Vector data)
Spatial data types:
Point, Line, Polygon
22. References:
www.google.com----------------(Maps)
www.yahoo.com
www.esri.com
(http://www.olemiss.edu/depts/geology/courses/ge4
70/RasterDataModel.htm#8b.1)
Book: An Introduction to geographical information system
by Hay Wood I, Carnelius, S & Carver, S
Book: Geographic Information System: A Management Perspective
by Stan Aronoff
Book: Principles of Geographic Information Systems
By Otto Huisman and Rolf A.de By
Introduction to RS/GIS
22