Downloaded 139 times


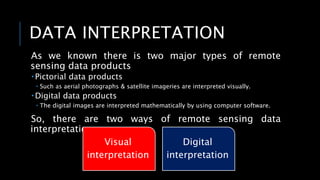


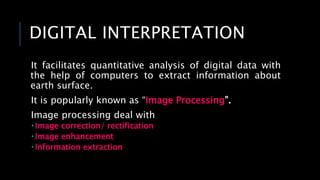
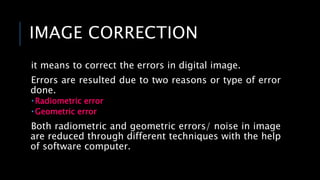
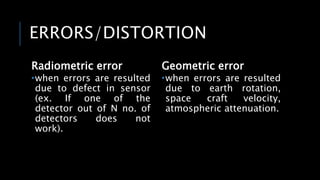


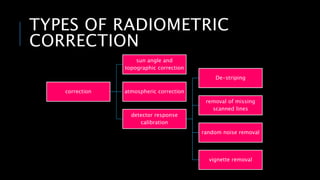

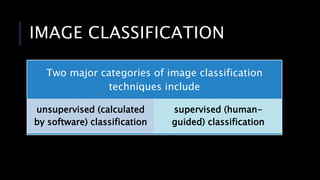


The document discusses various aspects of digital image processing, detailing types of data products, including digital and pictorial data, and their interpretation methods. It covers technical concepts such as image correction, enhancement, classification, and the processes of visual and digital interpretation. Furthermore, it explains unsupervised and supervised classification techniques for extracting information from images.


![Getting Started with Apache Spark: Big Data Made Simple [Free Meetup]](https://cdn.slidesharecdn.com/ss_thumbnails/apachesparkgettingstarted-260203175547-8361bcc3-thumbnail.jpg?width=640&height=640&fit=bounds)


