
Recommended
More Related Content
What's hot
What's hot (20)
Viewers also liked
Viewers also liked (12)
Similar to Currency high lights 15.07.16
Similar to Currency high lights 15.07.16 (17)
Recently uploaded
Recently uploaded (20)
Currency high lights 15.07.16
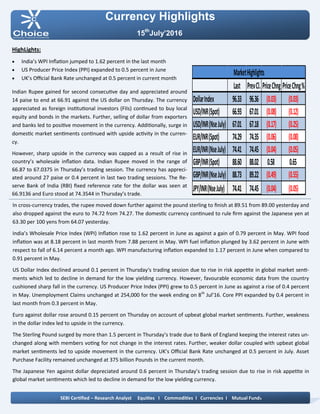
- 1. Currency Highlights 15th July’2016 HighLights: India’s WPI Inflation jumped to 1.62 percent in the last month US Producer Price Index (PPI) expanded to 0.5 percent in June UK’s Official Bank Rate unchanged at 0.5 percent in current month Indian Rupee gained for second consecutive day and appreciated around 14 paise to end at 66.91 against the US dollar on Thursday. The currency appreciated as foreign institutional investors (FIIs) continued to buy local equity and bonds in the markets. Further, selling of dollar from exporters and banks led to positive movement in the currency. Additionally, surge in domestic market sentiments continued with upside activity in the curren- cy. However, sharp upside in the currency was capped as a result of rise in country’s wholesale inflation data. Indian Rupee moved in the range of 66.87 to 67.0375 in Thursday’s trading session. The currency has appreci- ated around 27 paise or 0.4 percent in last two trading sessions. The Re- serve Bank of India (RBI) fixed reference rate for the dollar was seen at 66.9136 and Euro stood at 74.3544 in Thursday’s trade. In cross-currency trades, the rupee moved down further against the pound sterling to finish at 89.51 from 89.00 yesterday and also dropped against the euro to 74.72 from 74.27. The domestic currency continued to rule firm against the Japanese yen at 63.30 per 100 yens from 64.07 yesterday. India’s Wholesale Price Index (WPI) Inflation rose to 1.62 percent in June as against a gain of 0.79 percent in May. WPI food inflation was at 8.18 percent in last month from 7.88 percent in May. WPI fuel inflation plunged by 3.62 percent in June with respect to fall of 6.14 percent a month ago. WPI manufacturing inflation expanded to 1.17 percent in June when compared to 0.91 percent in May. US Dollar Index declined around 0.1 percent in Thursday‘s trading session due to rise in risk appetite in global market senti- ments which led to decline in demand for the low yielding currency. However, favourable economic data from the country cushioned sharp fall in the currency. US Producer Price Index (PPI) grew to 0.5 percent in June as against a rise of 0.4 percent in May. Unemployment Claims unchanged at 254,000 for the week ending on 8th Jul’16. Core PPI expanded by 0.4 percent in last month from 0.3 percent in May. Euro against dollar rose around 0.15 percent on Thursday on account of upbeat global market sentiments. Further, weakness in the dollar index led to upside in the currency. The Sterling Pound surged by more than 1.5 percent in Thursday’s trade due to Bank of England keeping the interest rates un- changed along with members voting for not change in the interest rates. Further, weaker dollar coupled with upbeat global market sentiments led to upside movement in the currency. UK’s Official Bank Rate unchanged at 0.5 percent in July. Asset Purchase Facility remained unchanged at 375 billion Pounds in the current month. The Japanese Yen against dollar depreciated around 0.6 percent in Thursday’s trading session due to rise in risk appetite in global market sentiments which led to decline in demand for the low yielding currency. SEBI Certified – Research Analyst Equities I Commodities I Currencies I Mutual Funds Last PrevCl. PriceChng PriceChng% DollarIndex 96.33 96.36 (0.03) (0.03) USD/INR(Spot) 66.93 67.01 (0.08) (0.12) USD/INR(NseJuly) 67.01 67.18 (0.17) (0.25) EUR/INR(Spot) 74.29 74.35 (0.06) (0.08) EUR/INR(NseJuly) 74.41 74.45 (0.04) (0.05) GBP/INR(Spot) 88.60 88.02 0.58 0.65 GBP/INR(NseJuly) 88.73 89.22 (0.49) (0.55) JPY/INR(NseJuly) 74.41 74.45 (0.04) (0.05) MarketHighlights
- 2. Technical View: The pair have been trading in rising channel pattern and pric- es have been facing resistance of its upper band of channel pattern 67.60 levels on daily chart. In addition, on daily chart prices have been trading below its 15 hourly exponential moving average which gives the nega- tive confirmation to the prices. On daily chart, momentum oscillator RSI has remained above its overbought zone 70 levels, which gives negative confirma- tion to the prices. A momentum indicator MACD has shown negative sign on daily chart, which indicates short term trend remains bearish. For now we expect prices to move lower towards 63 levels in few trading sessions. Pivot levels for the Day Technical View: The price has been trading in its rising channel formation from past few months and price has faced resistance of its upper band at 68.10 levels on daily chart. Price has faced re- sistance of its horizontal trend line at 68 levels on daily. Moreover, price have been trading below its 50 daily expo- nential moving average which suggest near term remains down. So any rally in the prices towards 67.20 level, used as selling opportunity. A momentum indicator RSI has moved below 60 levels on daily chart, which suggest bearishness in the prices. A momentum indictor MACD has given negative crossover on daily chart, which gives negative confirmation to the prices. For now we expect prices to move lower towards 66.60 lev- els in few trading sessions. Currency Highlights 15th July’2016 USDINR JPYINR SEBI Certified – Research Analyst Equities I Commodities I Currencies I Mutual Funds S3 S2 S1 Pivot R1 R2 R3 USDINR 66.58 66.82 66.91 67.06 67.15 67.30 67.54 JPYINR 61.77 62.70 63.09 63.63 64.02 64.56 65.49
- 3. Pivot levels for the Day Currency Highlights 15th July’2016 GBPINR EURINR Technical View: The price has shown breakout of its symmetrical triangle patter at 75.50 levels on daily chart. The price has shown breakdown of its rising channel pattern at 75.50 levels on daily chart. On the other hand, Pair has been trading below its 21 daily exponential moving average which indicates that trend is remains down. A momentum oscillator RSI have been trading below 45 lev- els on daily chart which gives the signs of bearishness to the prices. Moreover, momentum indicator MACD has shown negative crossover on daily chart which support our bearish view on the pair. For now we expect prices should move lower towards 73.90 levels in the coming trading sessions. Technical View: The price has formed bullish hammer candle stick pattern on daily which is bullish pattern. The price has completed bullish AB=CD harmonic pattern on daily chart 87.20 levels the coor- dinates of which are as follows: Technical Parameter: AB of the leg from 106 to 92,BC of the leg completed 101 at (i.e.50% of AB leg.) CD of the leg com- pleted to 87.20 levels (i.e. near 200% Fibonacci Projection of BC leg). So any dips in the prices towards 87.50 level, used as buying opportunity. The price has taken support of its falling trend line at 87.30 levels on daily chart. A momentum indicator RSI has moved in oversold zone at 27 levels on daily chart, which suggest bullishness in the prices. Moreover, momentum indicator MACD has shown positive sign on daily chart which support our bullish view on the pair. SEBI Certified – Research Analyst Equities I Commodities I Currencies I Mutual Funds S3 S2 S1 Pivot R1 R2 R3 GBPINR 87.65 88.18 88.47 88.71 89.00 89.24 89.77 EURINR 73.42 73.98 74.20 74.54 74.76 75.10 75.66
- 4. Currency Highlights SEBI Certified – Research Analyst Equities I Commodities I Currencies I Mutual Funds Economic Indicators Date Time Data Prior Expected Impact 15.07.16 7:30am GDP q/y 6.7% 6.6% Actual > Forecast = Good for currency; Yuan 15.07.16 7:30am Industrial Production y/y 6.0% 5.9% Actual > Forecast = Good for currency; Yuan 15.07.16 7:30am Fixed Asset Investment ytd/y 9.6% 9.4% Actual > Forecast = Good for currency; Yuan 15.07.16 7:30am NBS Press Conference 15.07.16 2:30pm Final CPI y/y 0.1% 0.1% Actual > Forecast = Good for currency; EURINR 15.07.16 5:30pm BOE Gov Carney Speaks 15.07.16 6:00pm CPI m/m 0.2% 0.2% Actual > Forecast = Good for currency; USDINR 15.07.16 6:00pm Core CPI m/m 0.2% 0.2% Actual > Forecast = Good for currency; USDINR 15.07.16 6:00pm Core Retail Sales m/m 0.4% 0.4% Actual > Forecast = Good for currency; USDINR 15.07.16 6:00pm Retail Sales m/m 0.5% 0.1% Actual > Forecast = Good for currency; USDINR 15.07.16 6:00pm Empire State Manufacturing Index 6.0 5.1 Actual > Forecast = Good for currency; USDINR 15.07.16 6:00pm Capacity Utilization Rate 74.9% 75.2% Actual > Forecast = Good for currency; USDINR 15.07.16 6:00pm Industrial Production m/m -0.4% 0.2% Actual > Forecast = Good for currency; USDINR 15.07.16 7:30pm Prelim UoM Consumer Senti- ment 93.5 93.7 Actual > Forecast = Good for currency; USDINR 15th July’2016
- 5. Currency Highlights 15th July’2016 SEBI Certified – Research Analyst Equities I Commodities I Currencies I Mutual Funds Amit Pathania Digitally signed by Amit Pathania DN: cn=Amit Pathania, o=Choice Equity Broking Pvt. ltd, ou=Research Department, email=amit.pathania@choiceindia.com, c=IN Date: 2016.07.15 08:38:39 +05'30'