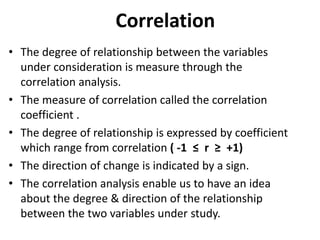
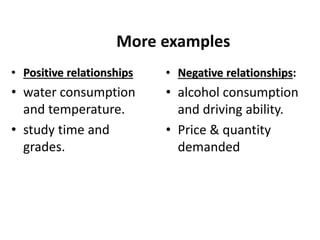
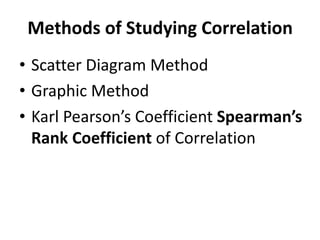
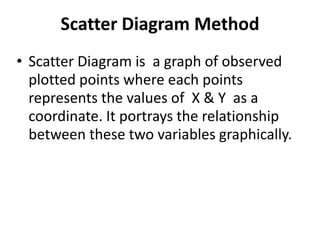
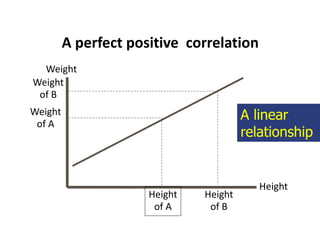
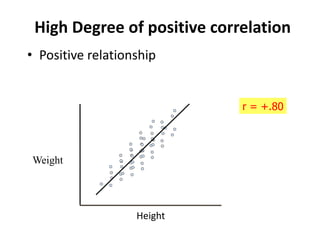
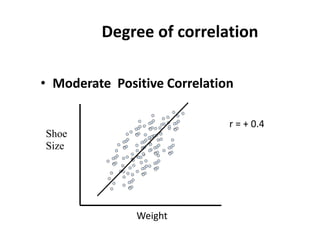
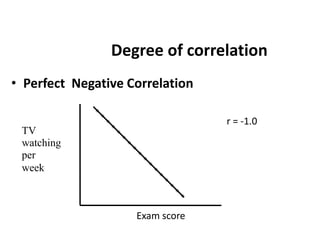
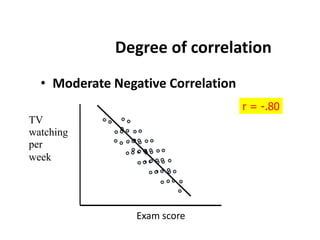
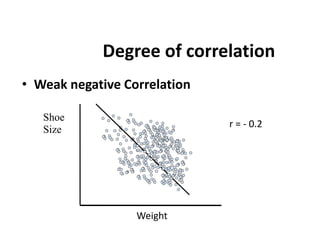
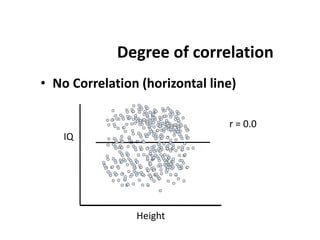
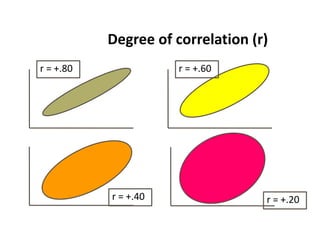
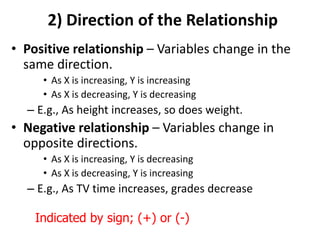
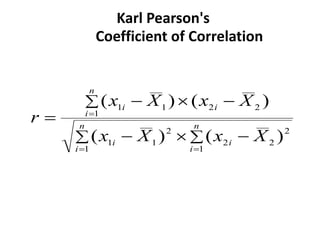
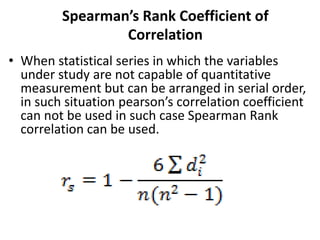
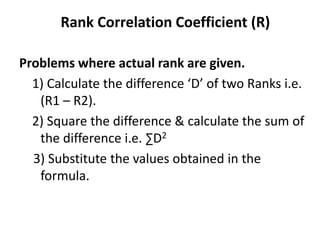
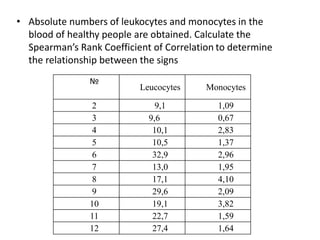
SlideShare a Scribd company logo
1 of 21
Correlation and Regression
Analysis
• Basic concepts and tasks of correlation analysis
• Pearson correlation coefficient and its properties
• Spearman's rank correlation coefficient
• The relationship of regression and correlation
• Coefficient of determination
• The statistical significance of correlation.
• Regression equations
• Estimation of the parameters of the regression
equation for the sample
• Testing the hypothesis of the significance of the
regression coefficient
CORRELATION
Correlation
• The degree of relationship between the variables
under consideration is measure through the
correlation analysis.
• The measure of correlation called the correlation
coefficient .
• The degree of relationship is expressed by coefficient
which range from correlation ( -1 ≤ r ≥ +1)
• The direction of change is indicated by a sign.
• The correlation analysis enable us to have an idea
about the degree & direction of the relationship
between the two variables under study.
More examples
• Positive relationships
• water consumption
and temperature.
• study time and
grades.
• Negative relationships:
• alcohol consumption
and driving ability.
• Price & quantity
demanded
Methods of Studying Correlation
• Scatter Diagram Method
• Graphic Method
• Karl Pearson’s Coefficient Spearman’s
Rank Coefficient of Correlation
Scatter Diagram Method
• Scatter Diagram is a graph of observed
plotted points where each points
represents the values of X & Y as a
coordinate. It portrays the relationship
between these two variables graphically.
A perfect positive correlation
Height
Weight
Height
of A
Weight
of A
Height
of B
Weight
of B
A linear
relationship
High Degree of positive correlation
• Positive relationship
Height
Weight
r = +.80
Degree of correlation
• Moderate Positive Correlation
Weight
Shoe
Size
r = + 0.4
Degree of correlation
• Perfect Negative Correlation
Exam score
TV
watching
per
week
r = -1.0
Degree of correlation
• Moderate Negative Correlation
Exam score
TV
watching
per
week
r = -.80
Degree of correlation
• Weak negative Correlation
Weight
Shoe
Size
r = - 0.2
Degree of correlation
• No Correlation (horizontal line)
Height
IQ
r = 0.0
Degree of correlation (r)
r = +.80 r = +.60
r = +.40 r = +.20
2) Direction of the Relationship
• Positive relationship – Variables change in the
same direction.
• As X is increasing, Y is increasing
• As X is decreasing, Y is decreasing
– E.g., As height increases, so does weight.
• Negative relationship – Variables change in
opposite directions.
• As X is increasing, Y is decreasing
• As X is decreasing, Y is increasing
– E.g., As TV time increases, grades decrease
Indicated by sign; (+) or (-)
Karl Pearson's
Coefficient of Correlation
 

 







 n
i
n
i
i
i
n
i
i
i
X
x
X
x
X
x
X
x
r
1 1
2
2
2
2
1
1
1
2
2
1
1
)
(
)
(
)
(
)
(
Spearman’s Rank Coefficient of
Correlation
• When statistical series in which the variables
under study are not capable of quantitative
measurement but can be arranged in serial order,
in such situation pearson’s correlation coefficient
can not be used in such case Spearman Rank
correlation can be used.
Rank Correlation Coefficient (R)
Problems where actual rank are given.
1) Calculate the difference ‘D’ of two Ranks i.e.
(R1 – R2).
2) Square the difference & calculate the sum of
the difference i.e. ∑D2
3) Substitute the values obtained in the
formula.
• Absolute numbers of leukocytes and monocytes in the
blood of healthy people are obtained. Calculate the
Spearman’s Rank Coefficient of Correlation to determine
the relationship between the signs
№
Leucocytes Monocytes
2 9,1 1,09
3 9,6 0,67
4 10,1 2,83
5 10,5 1,37
6 32,9 2,96
7 13,0 1,95
8 17,1 4,10
9 29,6 2,09
10 19,1 3,82
11 22,7 1,59
12 27,4 1,64
The regression model is a statistical procedure that allows a
researcher to estimate the linear, or straight line,
relationship that relates two or more variables. This linear
relationship summarizes the amount of change in one
variable that is associated with change in another variable
or variables.
The model can also be tested for statistical significance, to
test whether the observed linear relationship could have
emerged by chance or not.
the two variable linear regression model is follow
Regression
• The straight line connecting any two variables
X and Y can be stated algebraically as
0
1 b
x
b
y 

x
b
y
n
x
b
y
b
n
i
n
i
i
i
1
1 1
1
0 



 
 





 2
1
)
(
)
)(
(
x
x
y
y
x
x
b
i
i
i

More Related Content

Similar to Correlation and Regression Analysis.pptx

Similar to Correlation and Regression Analysis.pptx (20)

Correlation.pdf
Correlation.pdfCorrelation.pdf
Correlation.pdf
 
Correlationanalysis
CorrelationanalysisCorrelationanalysis
Correlationanalysis
 
Correlation and Regression.pptx
Correlation and Regression.pptxCorrelation and Regression.pptx
Correlation and Regression.pptx
 
PEARSON'CORRELATION
PEARSON'CORRELATION PEARSON'CORRELATION
PEARSON'CORRELATION
 
12943625.ppt
12943625.ppt12943625.ppt
12943625.ppt
 
Biostatistics - Correlation explanation.pptx
Biostatistics - Correlation explanation.pptxBiostatistics - Correlation explanation.pptx
Biostatistics - Correlation explanation.pptx
 
13943056.ppt
13943056.ppt13943056.ppt
13943056.ppt
 
Correlation
CorrelationCorrelation
Correlation
 
correlation and regression.pptx
correlation and regression.pptxcorrelation and regression.pptx
correlation and regression.pptx
 
Regression & correlation coefficient
Regression & correlation coefficientRegression & correlation coefficient
Regression & correlation coefficient
 
Correlation
CorrelationCorrelation
Correlation
 
Study of Correlation
Study of Correlation Study of Correlation
Study of Correlation
 
12 rhl gta
12 rhl gta12 rhl gta
12 rhl gta
 
Educ eval ppt correlation
Educ eval ppt correlationEduc eval ppt correlation
Educ eval ppt correlation
 
P G STAT 531 Lecture 9 Correlation
P G STAT 531 Lecture 9 CorrelationP G STAT 531 Lecture 9 Correlation
P G STAT 531 Lecture 9 Correlation
 
Correlation analysis
Correlation analysisCorrelation analysis
Correlation analysis
 
Pearson's correlation coefficient 
Pearson's correlation coefficient Pearson's correlation coefficient 
Pearson's correlation coefficient 
 
Topic 5 Covariance & Correlation.pptx
Topic 5  Covariance & Correlation.pptxTopic 5  Covariance & Correlation.pptx
Topic 5 Covariance & Correlation.pptx
 
Topic 5 Covariance & Correlation.pptx
Topic 5  Covariance & Correlation.pptxTopic 5  Covariance & Correlation.pptx
Topic 5 Covariance & Correlation.pptx
 
Correlationanalysis
CorrelationanalysisCorrelationanalysis
Correlationanalysis
 

Recently uploaded

Capitol Tech U Doctoral Presentation - April 2024.pptx
Capitol Tech U Doctoral Presentation - April 2024.pptxCapitol Tech U Doctoral Presentation - April 2024.pptx
Capitol Tech U Doctoral Presentation - April 2024.pptxCapitolTechU
 
ECONOMIC CONTEXT - LONG FORM TV DRAMA - PPT
ECONOMIC CONTEXT - LONG FORM TV DRAMA - PPTECONOMIC CONTEXT - LONG FORM TV DRAMA - PPT
ECONOMIC CONTEXT - LONG FORM TV DRAMA - PPTiammrhaywood
 
Enzyme, Pharmaceutical Aids, Miscellaneous Last Part of Chapter no 5th.pdf
Enzyme, Pharmaceutical Aids, Miscellaneous Last Part of Chapter no 5th.pdfEnzyme, Pharmaceutical Aids, Miscellaneous Last Part of Chapter no 5th.pdf
Enzyme, Pharmaceutical Aids, Miscellaneous Last Part of Chapter no 5th.pdfSumit Tiwari
 
Final demo Grade 9 for demo Plan dessert.pptx
Final demo Grade 9 for demo Plan dessert.pptxFinal demo Grade 9 for demo Plan dessert.pptx
Final demo Grade 9 for demo Plan dessert.pptxAvyJaneVismanos
 
KSHARA STURA .pptx---KSHARA KARMA THERAPY (CAUSTIC THERAPY)————IMP.OF KSHARA ...
KSHARA STURA .pptx---KSHARA KARMA THERAPY (CAUSTIC THERAPY)————IMP.OF KSHARA ...KSHARA STURA .pptx---KSHARA KARMA THERAPY (CAUSTIC THERAPY)————IMP.OF KSHARA ...
KSHARA STURA .pptx---KSHARA KARMA THERAPY (CAUSTIC THERAPY)————IMP.OF KSHARA ...M56BOOKSTORE PRODUCT/SERVICE
 
Types of Journalistic Writing Grade 8.pptx
Types of Journalistic Writing Grade 8.pptxTypes of Journalistic Writing Grade 8.pptx
Types of Journalistic Writing Grade 8.pptxEyham Joco
 
Biting mechanism of poisonous snakes.pdf
Biting mechanism of poisonous snakes.pdfBiting mechanism of poisonous snakes.pdf
Biting mechanism of poisonous snakes.pdfadityarao40181
 
Full Stack Web Development Course for Beginners
Full Stack Web Development Course  for BeginnersFull Stack Web Development Course  for Beginners
Full Stack Web Development Course for BeginnersSabitha Banu
 
Software Engineering Methodologies (overview)
Software Engineering Methodologies (overview)Software Engineering Methodologies (overview)
Software Engineering Methodologies (overview)eniolaolutunde
 
Pharmacognosy Flower 3. Compositae 2023.pdf
Pharmacognosy Flower 3. Compositae 2023.pdfPharmacognosy Flower 3. Compositae 2023.pdf
Pharmacognosy Flower 3. Compositae 2023.pdfMahmoud M. Sallam
 
How to Configure Email Server in Odoo 17
How to Configure Email Server in Odoo 17How to Configure Email Server in Odoo 17
How to Configure Email Server in Odoo 17Celine George
 
History Class XII Ch. 3 Kinship, Caste and Class (1).pptx
History Class XII Ch. 3 Kinship, Caste and Class (1).pptxHistory Class XII Ch. 3 Kinship, Caste and Class (1).pptx
History Class XII Ch. 3 Kinship, Caste and Class (1).pptxsocialsciencegdgrohi
 
MARGINALIZATION (Different learners in Marginalized Group
MARGINALIZATION (Different learners in Marginalized GroupMARGINALIZATION (Different learners in Marginalized Group
MARGINALIZATION (Different learners in Marginalized GroupJonathanParaisoCruz
 
Presiding Officer Training module 2024 lok sabha elections
Presiding Officer Training module 2024 lok sabha electionsPresiding Officer Training module 2024 lok sabha elections
Presiding Officer Training module 2024 lok sabha electionsanshu789521
 
Framing an Appropriate Research Question 6b9b26d93da94caf993c038d9efcdedb.pdf
Framing an Appropriate Research Question 6b9b26d93da94caf993c038d9efcdedb.pdfFraming an Appropriate Research Question 6b9b26d93da94caf993c038d9efcdedb.pdf
Framing an Appropriate Research Question 6b9b26d93da94caf993c038d9efcdedb.pdfUjwalaBharambe
 
Historical philosophical, theoretical, and legal foundations of special and i...
Historical philosophical, theoretical, and legal foundations of special and i...Historical philosophical, theoretical, and legal foundations of special and i...
Historical philosophical, theoretical, and legal foundations of special and i...jaredbarbolino94
 
Solving Puzzles Benefits Everyone (English).pptx
Solving Puzzles Benefits Everyone (English).pptxSolving Puzzles Benefits Everyone (English).pptx
Solving Puzzles Benefits Everyone (English).pptxOH TEIK BIN
 

Recently uploaded (20)

Capitol Tech U Doctoral Presentation - April 2024.pptx
Capitol Tech U Doctoral Presentation - April 2024.pptxCapitol Tech U Doctoral Presentation - April 2024.pptx
Capitol Tech U Doctoral Presentation - April 2024.pptx
 
ECONOMIC CONTEXT - LONG FORM TV DRAMA - PPT
ECONOMIC CONTEXT - LONG FORM TV DRAMA - PPTECONOMIC CONTEXT - LONG FORM TV DRAMA - PPT
ECONOMIC CONTEXT - LONG FORM TV DRAMA - PPT
 
Enzyme, Pharmaceutical Aids, Miscellaneous Last Part of Chapter no 5th.pdf
Enzyme, Pharmaceutical Aids, Miscellaneous Last Part of Chapter no 5th.pdfEnzyme, Pharmaceutical Aids, Miscellaneous Last Part of Chapter no 5th.pdf
Enzyme, Pharmaceutical Aids, Miscellaneous Last Part of Chapter no 5th.pdf
 
Final demo Grade 9 for demo Plan dessert.pptx
Final demo Grade 9 for demo Plan dessert.pptxFinal demo Grade 9 for demo Plan dessert.pptx
Final demo Grade 9 for demo Plan dessert.pptx
 
KSHARA STURA .pptx---KSHARA KARMA THERAPY (CAUSTIC THERAPY)————IMP.OF KSHARA ...
KSHARA STURA .pptx---KSHARA KARMA THERAPY (CAUSTIC THERAPY)————IMP.OF KSHARA ...KSHARA STURA .pptx---KSHARA KARMA THERAPY (CAUSTIC THERAPY)————IMP.OF KSHARA ...
KSHARA STURA .pptx---KSHARA KARMA THERAPY (CAUSTIC THERAPY)————IMP.OF KSHARA ...
 
Types of Journalistic Writing Grade 8.pptx
Types of Journalistic Writing Grade 8.pptxTypes of Journalistic Writing Grade 8.pptx
Types of Journalistic Writing Grade 8.pptx
 
Biting mechanism of poisonous snakes.pdf
Biting mechanism of poisonous snakes.pdfBiting mechanism of poisonous snakes.pdf
Biting mechanism of poisonous snakes.pdf
 
Full Stack Web Development Course for Beginners
Full Stack Web Development Course  for BeginnersFull Stack Web Development Course  for Beginners
Full Stack Web Development Course for Beginners
 
Software Engineering Methodologies (overview)
Software Engineering Methodologies (overview)Software Engineering Methodologies (overview)
Software Engineering Methodologies (overview)
 
Pharmacognosy Flower 3. Compositae 2023.pdf
Pharmacognosy Flower 3. Compositae 2023.pdfPharmacognosy Flower 3. Compositae 2023.pdf
Pharmacognosy Flower 3. Compositae 2023.pdf
 
TataKelola dan KamSiber Kecerdasan Buatan v022.pdf
TataKelola dan KamSiber Kecerdasan Buatan v022.pdfTataKelola dan KamSiber Kecerdasan Buatan v022.pdf
TataKelola dan KamSiber Kecerdasan Buatan v022.pdf
 
9953330565 Low Rate Call Girls In Rohini Delhi NCR
9953330565 Low Rate Call Girls In Rohini  Delhi NCR9953330565 Low Rate Call Girls In Rohini  Delhi NCR
9953330565 Low Rate Call Girls In Rohini Delhi NCR
 
How to Configure Email Server in Odoo 17
How to Configure Email Server in Odoo 17How to Configure Email Server in Odoo 17
How to Configure Email Server in Odoo 17
 
History Class XII Ch. 3 Kinship, Caste and Class (1).pptx
History Class XII Ch. 3 Kinship, Caste and Class (1).pptxHistory Class XII Ch. 3 Kinship, Caste and Class (1).pptx
History Class XII Ch. 3 Kinship, Caste and Class (1).pptx
 
Model Call Girl in Bikash Puri Delhi reach out to us at 🔝9953056974🔝
Model Call Girl in Bikash Puri  Delhi reach out to us at 🔝9953056974🔝Model Call Girl in Bikash Puri  Delhi reach out to us at 🔝9953056974🔝
Model Call Girl in Bikash Puri Delhi reach out to us at 🔝9953056974🔝
 
MARGINALIZATION (Different learners in Marginalized Group
MARGINALIZATION (Different learners in Marginalized GroupMARGINALIZATION (Different learners in Marginalized Group
MARGINALIZATION (Different learners in Marginalized Group
 
Presiding Officer Training module 2024 lok sabha elections
Presiding Officer Training module 2024 lok sabha electionsPresiding Officer Training module 2024 lok sabha elections
Presiding Officer Training module 2024 lok sabha elections
 
Framing an Appropriate Research Question 6b9b26d93da94caf993c038d9efcdedb.pdf
Framing an Appropriate Research Question 6b9b26d93da94caf993c038d9efcdedb.pdfFraming an Appropriate Research Question 6b9b26d93da94caf993c038d9efcdedb.pdf
Framing an Appropriate Research Question 6b9b26d93da94caf993c038d9efcdedb.pdf
 
Historical philosophical, theoretical, and legal foundations of special and i...
Historical philosophical, theoretical, and legal foundations of special and i...Historical philosophical, theoretical, and legal foundations of special and i...
Historical philosophical, theoretical, and legal foundations of special and i...
 
Solving Puzzles Benefits Everyone (English).pptx
Solving Puzzles Benefits Everyone (English).pptxSolving Puzzles Benefits Everyone (English).pptx
Solving Puzzles Benefits Everyone (English).pptx
 

Correlation and Regression Analysis.pptx

  • 1. Correlation and Regression Analysis • Basic concepts and tasks of correlation analysis • Pearson correlation coefficient and its properties • Spearman's rank correlation coefficient • The relationship of regression and correlation • Coefficient of determination • The statistical significance of correlation. • Regression equations • Estimation of the parameters of the regression equation for the sample • Testing the hypothesis of the significance of the regression coefficient
  • 3. Correlation • The degree of relationship between the variables under consideration is measure through the correlation analysis. • The measure of correlation called the correlation coefficient . • The degree of relationship is expressed by coefficient which range from correlation ( -1 ≤ r ≥ +1) • The direction of change is indicated by a sign. • The correlation analysis enable us to have an idea about the degree & direction of the relationship between the two variables under study.
  • 4. More examples • Positive relationships • water consumption and temperature. • study time and grades. • Negative relationships: • alcohol consumption and driving ability. • Price & quantity demanded
  • 5. Methods of Studying Correlation • Scatter Diagram Method • Graphic Method • Karl Pearson’s Coefficient Spearman’s Rank Coefficient of Correlation
  • 6. Scatter Diagram Method • Scatter Diagram is a graph of observed plotted points where each points represents the values of X & Y as a coordinate. It portrays the relationship between these two variables graphically.
  • 7. A perfect positive correlation Height Weight Height of A Weight of A Height of B Weight of B A linear relationship
  • 8. High Degree of positive correlation • Positive relationship Height Weight r = +.80
  • 9. Degree of correlation • Moderate Positive Correlation Weight Shoe Size r = + 0.4
  • 10. Degree of correlation • Perfect Negative Correlation Exam score TV watching per week r = -1.0
  • 11. Degree of correlation • Moderate Negative Correlation Exam score TV watching per week r = -.80
  • 12. Degree of correlation • Weak negative Correlation Weight Shoe Size r = - 0.2
  • 13. Degree of correlation • No Correlation (horizontal line) Height IQ r = 0.0
  • 14. Degree of correlation (r) r = +.80 r = +.60 r = +.40 r = +.20
  • 15. 2) Direction of the Relationship • Positive relationship – Variables change in the same direction. • As X is increasing, Y is increasing • As X is decreasing, Y is decreasing – E.g., As height increases, so does weight. • Negative relationship – Variables change in opposite directions. • As X is increasing, Y is decreasing • As X is decreasing, Y is increasing – E.g., As TV time increases, grades decrease Indicated by sign; (+) or (-)
  • 16. Karl Pearson's Coefficient of Correlation              n i n i i i n i i i X x X x X x X x r 1 1 2 2 2 2 1 1 1 2 2 1 1 ) ( ) ( ) ( ) (
  • 17. Spearman’s Rank Coefficient of Correlation • When statistical series in which the variables under study are not capable of quantitative measurement but can be arranged in serial order, in such situation pearson’s correlation coefficient can not be used in such case Spearman Rank correlation can be used.
  • 18. Rank Correlation Coefficient (R) Problems where actual rank are given. 1) Calculate the difference ‘D’ of two Ranks i.e. (R1 – R2). 2) Square the difference & calculate the sum of the difference i.e. ∑D2 3) Substitute the values obtained in the formula.
  • 19. • Absolute numbers of leukocytes and monocytes in the blood of healthy people are obtained. Calculate the Spearman’s Rank Coefficient of Correlation to determine the relationship between the signs № Leucocytes Monocytes 2 9,1 1,09 3 9,6 0,67 4 10,1 2,83 5 10,5 1,37 6 32,9 2,96 7 13,0 1,95 8 17,1 4,10 9 29,6 2,09 10 19,1 3,82 11 22,7 1,59 12 27,4 1,64
  • 20. The regression model is a statistical procedure that allows a researcher to estimate the linear, or straight line, relationship that relates two or more variables. This linear relationship summarizes the amount of change in one variable that is associated with change in another variable or variables. The model can also be tested for statistical significance, to test whether the observed linear relationship could have emerged by chance or not. the two variable linear regression model is follow Regression
  • 21. • The straight line connecting any two variables X and Y can be stated algebraically as 0 1 b x b y   x b y n x b y b n i n i i i 1 1 1 1 0               2 1 ) ( ) )( ( x x y y x x b i i i