Download to read offline

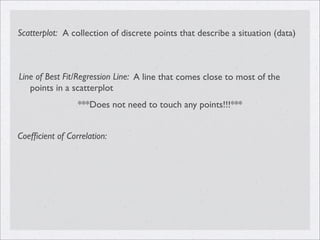
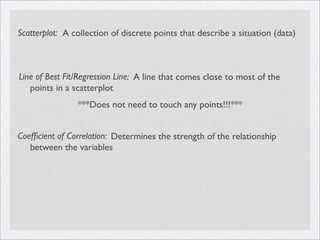
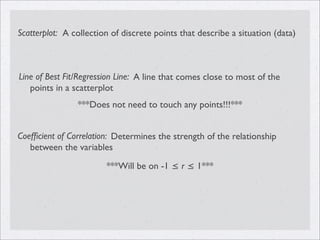
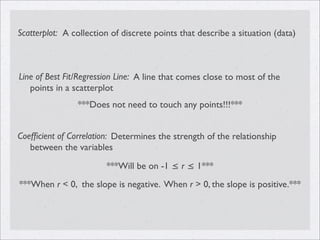
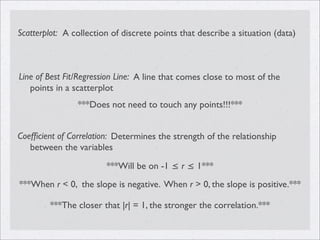
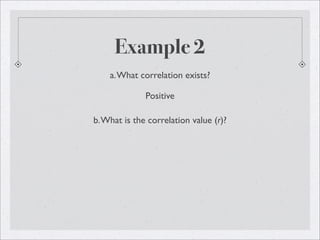
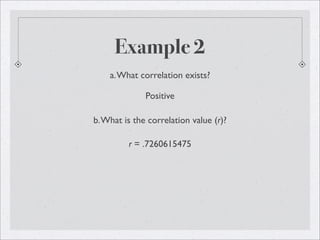
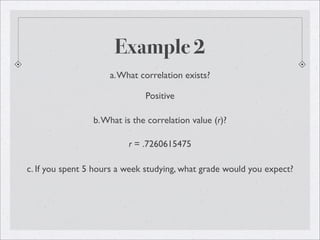
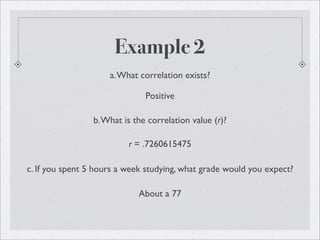
This document discusses key concepts for fitting a line to scatterplot data including: - A scatterplot is a collection of discrete data points that describe a situation. - A line of best fit/regression line is a line that comes close to most of the points in a scatterplot but does not need to touch any points. - The coefficient of correlation determines the strength of the relationship between variables on a scale of -1 to 1, where values closer to 1 or -1 indicate a stronger correlation and the sign of the value indicates the slope of the line of best fit. - Two examples are provided to demonstrate positive correlation, calculating the correlation value r, and using the line of best fit to predict expected values