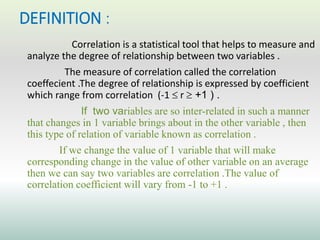
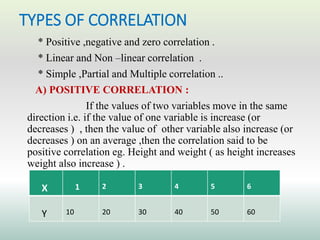
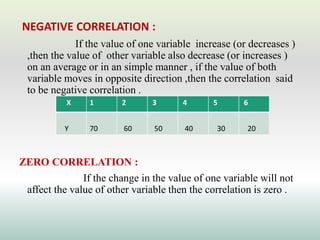
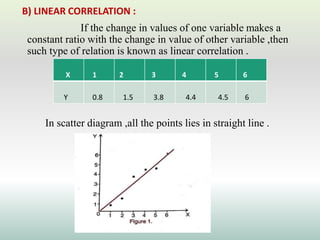
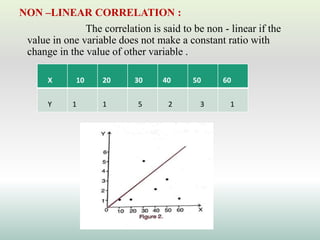
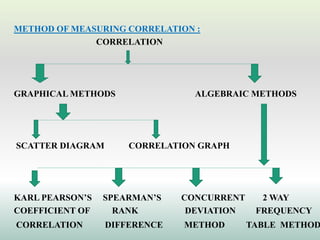
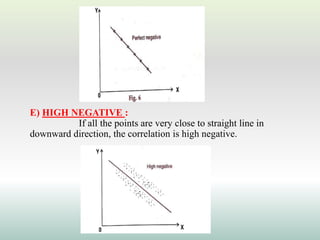
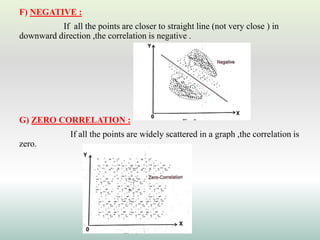
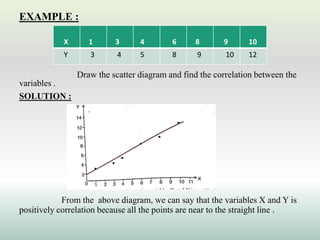
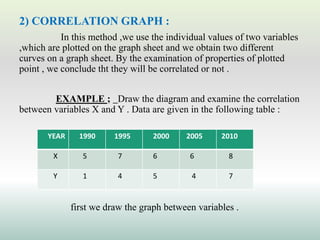
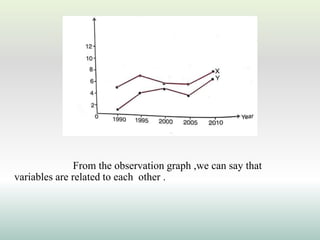
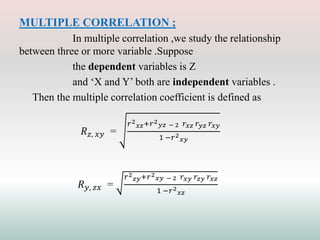
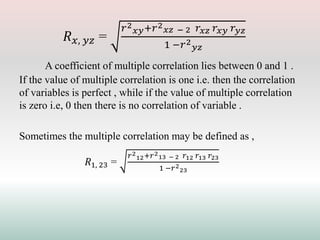
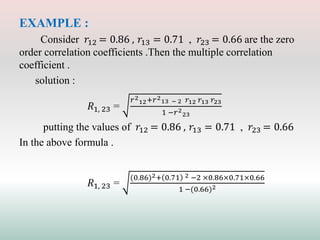
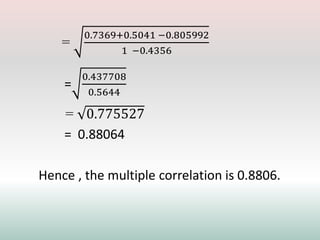
RESEARCH METHODOLOGY
AND BIOSTATISTICS
CORRELATION
SUBMITTED BY
S.KAVIYA
M.PHARM – 2nd YEAR
DEPT.OF PHARMACOLOGY
DEFINITION :
Correlation is a statistical tool that helps to measure and
analyze the degree of relationship between two variables .
The measure of correlation called the correlation
coeffecient .The degree of relationship is expressed by coefficient
which range from correlation (-1  r  +1 ) .
If two variables are so inter-related in such a manner
that changes in 1 variable brings about in the other variable , then
this type of relation of variable known as correlation .
If we change the value of 1 variable that will make
corresponding change in the value of other variable on an average
then we can say two variables are correlation .The value of
correlation coefficient will vary from -1 to +1 .
TYPES OF CORRELATION
* Positive ,negative and zero correlation .
* Linear and Non –linear correlation .
* Simple ,Partial and Multiple correlation ..
A) POSITIVE CORRELATION :
If the values of two variables move in the same
direction i.e. if the value of one variable is increase (or
decreases ) , then the value of other variable also increase (or
decreases ) on an average ,then the correlation said to be
positive correlation eg. Height and weight ( as height increases
weight also increase ) .
X 1 2 3 4 5 6
Y 10 20 30 40 50 60
NEGATIVE CORRELATION :
If the value of one variable increase (or decreases )
,then the value of other variable also decrease (or increases )
on an average or in an simple manner , if the value of both
variable moves in opposite direction ,then the correlation said
to be negative correlation .
ZERO CORRELATION :
If the change in the value of one variable will not
affect the value of other variable then the correlation is zero .
X 1 2 3 4 5 6
Y 70 60 50 40 30 20
B) LINEAR CORRELATION :
If the change in values of one variable makes a
constant ratio with the change in value of other variable ,then
such type of relation is known as linear correlation .
In scatter diagram ,all the points lies in straight line .
X 1 2 3 4 5 6
Y 0.8 1.5 3.8 4.4 4.5 6
NON –LINEAR CORRELATION :
The correlation is said to be non - linear if the
value in one variable does not make a constant ratio with
change in the value of other variable .
X 10 20 30 40 50 60
Y 1 1 5 2 3 1
C) SIMPLE CORRELATION :
If we study the relationship between two variables X and Y
,then it is called simple correlation .
e.g, Height and Weight
PARTIAL CORRELATION :
If we study the relationship between two variables ,keeping all
the other variable as constant ,it is called as partial correlation .
MULTIPLE CORRELATION :
If we study the relationship between more than two
variables ,it is called as multiple correlation . In multiple
correlation we measure the degree of relationship between
one variable on 1 side and combined effect of all other variable
on the other side .
NOTE :
Since the value of correlation lies between -1 and +1 ( i.e. -1
 r  + 1 ) .
Then ,
* If r > 0 , we say that a positive correlation between
variables .
* If r < 0 , we say that a negative correlation between
variables .
* If r = 0 , we say that a no correlation between
variables .
METHOD OF MEASURING CORRELATION :
CORRELATION
GRAPHICAL METHODS ALGEBRAIC METHODS
SCATTER DIAGRAM CORRELATION GRAPH
KARL PEARSON’S SPEARMAN’S CONCURRENT 2 WAY
COEFFICIENT OF RANK DEVIATION FREQUENCY
CORRELATION DIFFERENCE METHOD TABLE METHOD
I. GRAPHICAL METHODS :
1) SCATTERED DIAGRAM : In the study of correlation between
two variables ,by using graphical method .first we draw scatter diagram
,for which we take the value of one variable on X-axis and the value of
other variable on Y-axis . The resulting graph is scattered point or dot in a
graph sheet known as scattered diagram.
TYPES OF SCATTERED DIAGRAM :
A) PERFECT POSITIVE CORRELATION :
All the points are in correlation . The straight line in upward
direction (left bottom to right up ), the correlation scatter diagram showing
positive correlation is a perfect positive
B) HIGHLY POSITIVE :
All the points are very near to straight line in
upward direction then we say it as a highly positive correlation.
C)POSITIVE CORRELATION :
If all the points on near to the straight line (but
not very near) the correlation is possible.
D)PERFECT NEGATIVE :
If all the points in a scattered diagram lies in a straight line
in downward direction (left top to right bottom ) ,the correlation is
perfect negative (r= -1) .
E) HIGH NEGATIVE :
If all the points are very close to straight line in
downward direction, the correlation is high negative.
F) NEGATIVE :
If all the points are closer to straight line (not very close ) in
downward direction ,the correlation is negative .
G) ZERO CORRELATION :
If all the points are widely scattered in a graph ,the correlation is
zero.
EXAMPLE :
Draw the scatter diagram and find the correlation between the
variables .
SOLUTION :
From the above diagram, we can say that the variables X and Y is
positively correlation because all the points are near to the straight line .
X 1 3 4 6 8 9 10
Y 3 4 5 8 9 10 12
2) CORRELATION GRAPH :
In this method ,we use the individual values of two variables
,which are plotted on the graph sheet and we obtain two different
curves on a graph sheet. By the examination of properties of plotted
point , we conclude tht they will be correlated or not .
EXAMPLE ; Draw the diagram and examine the correlation
between variables X and Y . Data are given in the following table :
first we draw the graph between variables .
YEAR 1990 1995 2000 2005 2010
X 5 7 6 6 8
Y 1 4 5 4 7
From the observation graph ,we can say that
variables are related to each other .
MERITS AND DEMERITS OF GRAPHICAL
METHOD :
MERITS :
* It is popular method of measuring the relationship between
2 variables .
* It is very easiest method , without involving any
mathematical calculation .
* Everyone can easily understood and examine it .
DEMERITS :
* We cannot obtain the degree of correlation .
* Graphical method is suitable only for small number of
data .
II. ALGEBRAIC METHODS :
A) KARL PEARSON’S COEFFICIENT OF
CORRELATION :
Karl Pearson’s coefficient of correlation is used to measure the
degree of linear relationship between two variables . It is also called moment
correlation coefficient . It is denoted and defined as
r =
∑𝑿𝒀
𝑵 𝝈𝑿 𝝈𝒀
B) SPEARMAN’S RANK COEFFICIENT OF CORRELATION :
It is a method of finding the correlation between two variables
by taking their ranks .
ρ = 1 -
𝟔 ∑𝒅𝟐
𝒏(𝒏𝟐 −𝟏)
or 1 -
𝟔 ∑𝒅𝟐
𝒏(𝒏𝟐 −𝒏)
where , n = the numbers of pairs of observations
∑𝑑2
= sum of squares of differences of corresponding ranks
EXAMPLE 1:
Find the rank correlation of following data of marks in 2
subjects in 7 students .
• Research methodology
•
• 90
solution :
Let the subject “Research methodology” be denoted by X
and quantitative Techniques denoted by Y .
Research
methodology 90 82 81 71 63 49 38
Quantitative
techniques 75 71 72 70 40 50 43
No. X Rx Y Ry d = Rx - Ry 𝑑2
1
2
3
4
5
6
7
90
82
81
71
63
49
38
1
2
3
4
5
6
7
75
71
72
70
40
50
43
1
3
2
4
7
5
6
0
-1
1
0
-2
1
1
0
1
1
0
4
1
1
∑𝑑2= 8
Now, use the rank correlation formula ,
ρ = 1 -
6 ∑𝑑2
𝑛(𝑛2 −1))
= 1 -
6 ×8
7 (72−1 )
= 1 -
48
7× 48
= 1 -
1
7
=
6
7
= 0.86
-1 ≤ ρ = 0.86 ≤ 1 ,therefore the marks in 2 subjects are
correlation .
EXAMPLE 2 :
Two teachers rank five medical students based on their intelligence
and the data are given below .
Do you agree that two teachers A and B have same degree of
agreement on judging the students based on their intelligence ?
solution :
here , the ranks of intelligence is given . so re – ranking the
values is not required , i.e rank given by teacher A is considered as series ( 𝑅𝑥)
and rank is given by the teacher B is considered as Y series ( 𝑅𝑦 ) .
First, find the correlation factor
C.F = 𝑹𝒆
𝑹𝒆𝟐 − 1
𝟏𝟏
Students 1 2 3 4 5
Teacher A 5 4 2.5 1 2.5
Teacher B 5 4 2 3 1
= 2 ×
(22 −1 )
11
=
2 ×3
11
=
6
11
= O.55
NO. 𝑹𝑿 𝑹𝒀 d 𝑑2
1
2
3
4
5
5
4
2.5
1
2.5
5
4
2
3
1
0
0
0.5
-2
1.5
0
0
0.25
4
2.25
∑𝑑2= 6.5
ρ = 1 -
6 (∑𝑑2+𝐶.𝐹)
𝑛(𝑛2 −1))
= 1 -
6 (6.5+0.55 )
7 (52−1 )
= 1 -
6 ×7.05
5×24
= 1 - 0.3523
= 0.647
Since , ρ = 0.65 ,we can say that both teacher have different
agreement on assessment of IQ .
C) CONCURRENT DEVIATION METHOD :
This method is based on the direction of change in the
two paired variations . The coefficient of concurrent deviation
between two series X and Y of direction of the change is called
the coefficient of concurrent deviation . It is denoted by 𝑟𝑒 and
calculated by the following formula .
𝑟𝑒 = ± ±
2𝑐 −𝑛
𝑛
Where , c = numbers of positive sign after multiplying the
changing direction of X series and Y series .
n = numbers of pairs of observations .
EXAMPLE :
Calculate the coefficient of concurrent deviation from the following
data .
SOLUTION : To calculate 𝑟𝑒2 𝑐𝑜𝑛𝑠𝑡𝑟𝑢𝑐𝑡 the table of change of direction .
X 10 5 16 14 13 14
Y 2 6 8 10 9 11
X
Direction of change
of X (𝑫𝑿) Y
Direction of change of Y
(𝑫𝒀) 𝑫𝑿 . 𝑫𝒀
10
15
16
14
13
14
_______
+
+
-
-
+
2
6
8
10
9
11
____
+
+
+
-
+
____
+
+
-
+
+
n = 5 c = 4
𝑟𝑒 = ± ±
2𝑐 −𝑛
𝑛
= ±
8 −5
5
= 1 -
3
5
= 0.771
D) TWO – WAY TABLE METHOD :
This method is used to examine the relationship between
two categorical variables .
The entries in the cells of a two way table can be displayed as
frequency counts or as relative frequencies or they can be displayed graphically
as a segmented bar chart .
MULTIPLE CORRELATION ;
In multiple correlation ,we study the relationship
between three or more variable .Suppose
the dependent variables is Z
and ‘X and Y’ both are independent variables .
Then the multiple correlation coefficient is defined as
𝑅𝑧, 𝑥𝑦 =
𝑟2
𝑥𝑧+𝑟2
𝑦𝑧 − 2 𝑟𝑥𝑧 𝑟𝑦𝑧 𝑟𝑥𝑦
1 −𝑟2
𝑥𝑦
𝑅𝑦, 𝑧𝑥 =
𝑟2
𝑧𝑦+𝑟2
𝑥𝑦 − 2 𝑟𝑥𝑦 𝑟𝑧𝑦 𝑟𝑥𝑧
1 −𝑟2
𝑥𝑧
𝑅𝑥, 𝑦𝑧 =
𝑟2
𝑥𝑦+𝑟2
𝑥𝑧 − 2 𝑟𝑥𝑧 𝑟𝑥𝑦 𝑟𝑦𝑧
1 −𝑟2
𝑦𝑧
A coefficient of multiple correlation lies between 0 and 1 .
If the value of multiple correlation is one i.e. then the correlation
of variables is perfect , while if the value of multiple correlation
is zero i.e, 0 then there is no correlation of variable .
Sometimes the multiple correlation may be defined as ,
𝑅1, 23 =
𝑟2
12+𝑟2
13 − 2 𝑟12 𝑟13 𝑟23
1 −𝑟2
23
EXAMPLE :
Consider 𝑟12 = 0.86 , 𝑟13 = 0.71 , 𝑟23 = 0.66 are the zero
order correlation coefficients .Then the multiple correlation
coefficient .
solution :
𝑅1, 23 =
𝑟2
12+𝑟2
13 − 2 𝑟12 𝑟13 𝑟23
1 −𝑟2
23
putting the values of 𝑟12 = 0.86 , 𝑟13 = 0.71 , 𝑟23 = 0.66
In the above formula .
𝑅1, 23 =
(0.86)2+ 0.71 2 −2 ×0.86×0.71×0.66
1 −(0.66)2
=
0.7369+0.5041 −0.805992
1 −0.4356
=
0.437708
0.5644
= 0.775527
= 0.88064
Hence , the multiple correlation is 0.8806.
THANK YOU

RMBS - CORRELATION.pptx

  • 1.
    RESEARCH METHODOLOGY AND BIOSTATISTICS CORRELATION SUBMITTEDBY S.KAVIYA M.PHARM – 2nd YEAR DEPT.OF PHARMACOLOGY
  • 2.
    DEFINITION : Correlation isa statistical tool that helps to measure and analyze the degree of relationship between two variables . The measure of correlation called the correlation coeffecient .The degree of relationship is expressed by coefficient which range from correlation (-1  r  +1 ) . If two variables are so inter-related in such a manner that changes in 1 variable brings about in the other variable , then this type of relation of variable known as correlation . If we change the value of 1 variable that will make corresponding change in the value of other variable on an average then we can say two variables are correlation .The value of correlation coefficient will vary from -1 to +1 .
  • 3.
    TYPES OF CORRELATION *Positive ,negative and zero correlation . * Linear and Non –linear correlation . * Simple ,Partial and Multiple correlation .. A) POSITIVE CORRELATION : If the values of two variables move in the same direction i.e. if the value of one variable is increase (or decreases ) , then the value of other variable also increase (or decreases ) on an average ,then the correlation said to be positive correlation eg. Height and weight ( as height increases weight also increase ) . X 1 2 3 4 5 6 Y 10 20 30 40 50 60
  • 4.
    NEGATIVE CORRELATION : Ifthe value of one variable increase (or decreases ) ,then the value of other variable also decrease (or increases ) on an average or in an simple manner , if the value of both variable moves in opposite direction ,then the correlation said to be negative correlation . ZERO CORRELATION : If the change in the value of one variable will not affect the value of other variable then the correlation is zero . X 1 2 3 4 5 6 Y 70 60 50 40 30 20
  • 5.
    B) LINEAR CORRELATION: If the change in values of one variable makes a constant ratio with the change in value of other variable ,then such type of relation is known as linear correlation . In scatter diagram ,all the points lies in straight line . X 1 2 3 4 5 6 Y 0.8 1.5 3.8 4.4 4.5 6
  • 6.
    NON –LINEAR CORRELATION: The correlation is said to be non - linear if the value in one variable does not make a constant ratio with change in the value of other variable . X 10 20 30 40 50 60 Y 1 1 5 2 3 1
  • 7.
    C) SIMPLE CORRELATION: If we study the relationship between two variables X and Y ,then it is called simple correlation . e.g, Height and Weight PARTIAL CORRELATION : If we study the relationship between two variables ,keeping all the other variable as constant ,it is called as partial correlation . MULTIPLE CORRELATION : If we study the relationship between more than two variables ,it is called as multiple correlation . In multiple correlation we measure the degree of relationship between one variable on 1 side and combined effect of all other variable on the other side .
  • 8.
    NOTE : Since thevalue of correlation lies between -1 and +1 ( i.e. -1  r  + 1 ) . Then , * If r > 0 , we say that a positive correlation between variables . * If r < 0 , we say that a negative correlation between variables . * If r = 0 , we say that a no correlation between variables .
  • 9.
    METHOD OF MEASURINGCORRELATION : CORRELATION GRAPHICAL METHODS ALGEBRAIC METHODS SCATTER DIAGRAM CORRELATION GRAPH KARL PEARSON’S SPEARMAN’S CONCURRENT 2 WAY COEFFICIENT OF RANK DEVIATION FREQUENCY CORRELATION DIFFERENCE METHOD TABLE METHOD
  • 10.
    I. GRAPHICAL METHODS: 1) SCATTERED DIAGRAM : In the study of correlation between two variables ,by using graphical method .first we draw scatter diagram ,for which we take the value of one variable on X-axis and the value of other variable on Y-axis . The resulting graph is scattered point or dot in a graph sheet known as scattered diagram. TYPES OF SCATTERED DIAGRAM : A) PERFECT POSITIVE CORRELATION : All the points are in correlation . The straight line in upward direction (left bottom to right up ), the correlation scatter diagram showing positive correlation is a perfect positive
  • 11.
    B) HIGHLY POSITIVE: All the points are very near to straight line in upward direction then we say it as a highly positive correlation. C)POSITIVE CORRELATION : If all the points on near to the straight line (but not very near) the correlation is possible.
  • 12.
    D)PERFECT NEGATIVE : Ifall the points in a scattered diagram lies in a straight line in downward direction (left top to right bottom ) ,the correlation is perfect negative (r= -1) .
  • 13.
    E) HIGH NEGATIVE: If all the points are very close to straight line in downward direction, the correlation is high negative.
  • 14.
    F) NEGATIVE : Ifall the points are closer to straight line (not very close ) in downward direction ,the correlation is negative . G) ZERO CORRELATION : If all the points are widely scattered in a graph ,the correlation is zero.
  • 15.
    EXAMPLE : Draw thescatter diagram and find the correlation between the variables . SOLUTION : From the above diagram, we can say that the variables X and Y is positively correlation because all the points are near to the straight line . X 1 3 4 6 8 9 10 Y 3 4 5 8 9 10 12
  • 16.
    2) CORRELATION GRAPH: In this method ,we use the individual values of two variables ,which are plotted on the graph sheet and we obtain two different curves on a graph sheet. By the examination of properties of plotted point , we conclude tht they will be correlated or not . EXAMPLE ; Draw the diagram and examine the correlation between variables X and Y . Data are given in the following table : first we draw the graph between variables . YEAR 1990 1995 2000 2005 2010 X 5 7 6 6 8 Y 1 4 5 4 7
  • 17.
    From the observationgraph ,we can say that variables are related to each other .
  • 18.
    MERITS AND DEMERITSOF GRAPHICAL METHOD : MERITS : * It is popular method of measuring the relationship between 2 variables . * It is very easiest method , without involving any mathematical calculation . * Everyone can easily understood and examine it . DEMERITS : * We cannot obtain the degree of correlation . * Graphical method is suitable only for small number of data .
  • 19.
    II. ALGEBRAIC METHODS: A) KARL PEARSON’S COEFFICIENT OF CORRELATION : Karl Pearson’s coefficient of correlation is used to measure the degree of linear relationship between two variables . It is also called moment correlation coefficient . It is denoted and defined as r = ∑𝑿𝒀 𝑵 𝝈𝑿 𝝈𝒀 B) SPEARMAN’S RANK COEFFICIENT OF CORRELATION : It is a method of finding the correlation between two variables by taking their ranks . ρ = 1 - 𝟔 ∑𝒅𝟐 𝒏(𝒏𝟐 −𝟏) or 1 - 𝟔 ∑𝒅𝟐 𝒏(𝒏𝟐 −𝒏) where , n = the numbers of pairs of observations ∑𝑑2 = sum of squares of differences of corresponding ranks
  • 20.
    EXAMPLE 1: Find therank correlation of following data of marks in 2 subjects in 7 students . • Research methodology • • 90 solution : Let the subject “Research methodology” be denoted by X and quantitative Techniques denoted by Y . Research methodology 90 82 81 71 63 49 38 Quantitative techniques 75 71 72 70 40 50 43
  • 21.
    No. X RxY Ry d = Rx - Ry 𝑑2 1 2 3 4 5 6 7 90 82 81 71 63 49 38 1 2 3 4 5 6 7 75 71 72 70 40 50 43 1 3 2 4 7 5 6 0 -1 1 0 -2 1 1 0 1 1 0 4 1 1 ∑𝑑2= 8
  • 22.
    Now, use therank correlation formula , ρ = 1 - 6 ∑𝑑2 𝑛(𝑛2 −1)) = 1 - 6 ×8 7 (72−1 ) = 1 - 48 7× 48 = 1 - 1 7 = 6 7 = 0.86 -1 ≤ ρ = 0.86 ≤ 1 ,therefore the marks in 2 subjects are correlation .
  • 23.
    EXAMPLE 2 : Twoteachers rank five medical students based on their intelligence and the data are given below . Do you agree that two teachers A and B have same degree of agreement on judging the students based on their intelligence ? solution : here , the ranks of intelligence is given . so re – ranking the values is not required , i.e rank given by teacher A is considered as series ( 𝑅𝑥) and rank is given by the teacher B is considered as Y series ( 𝑅𝑦 ) . First, find the correlation factor C.F = 𝑹𝒆 𝑹𝒆𝟐 − 1 𝟏𝟏 Students 1 2 3 4 5 Teacher A 5 4 2.5 1 2.5 Teacher B 5 4 2 3 1
  • 24.
    = 2 × (22−1 ) 11 = 2 ×3 11 = 6 11 = O.55 NO. 𝑹𝑿 𝑹𝒀 d 𝑑2 1 2 3 4 5 5 4 2.5 1 2.5 5 4 2 3 1 0 0 0.5 -2 1.5 0 0 0.25 4 2.25 ∑𝑑2= 6.5
  • 25.
    ρ = 1- 6 (∑𝑑2+𝐶.𝐹) 𝑛(𝑛2 −1)) = 1 - 6 (6.5+0.55 ) 7 (52−1 ) = 1 - 6 ×7.05 5×24 = 1 - 0.3523 = 0.647 Since , ρ = 0.65 ,we can say that both teacher have different agreement on assessment of IQ .
  • 26.
    C) CONCURRENT DEVIATIONMETHOD : This method is based on the direction of change in the two paired variations . The coefficient of concurrent deviation between two series X and Y of direction of the change is called the coefficient of concurrent deviation . It is denoted by 𝑟𝑒 and calculated by the following formula . 𝑟𝑒 = ± ± 2𝑐 −𝑛 𝑛 Where , c = numbers of positive sign after multiplying the changing direction of X series and Y series . n = numbers of pairs of observations .
  • 27.
    EXAMPLE : Calculate thecoefficient of concurrent deviation from the following data . SOLUTION : To calculate 𝑟𝑒2 𝑐𝑜𝑛𝑠𝑡𝑟𝑢𝑐𝑡 the table of change of direction . X 10 5 16 14 13 14 Y 2 6 8 10 9 11 X Direction of change of X (𝑫𝑿) Y Direction of change of Y (𝑫𝒀) 𝑫𝑿 . 𝑫𝒀 10 15 16 14 13 14 _______ + + - - + 2 6 8 10 9 11 ____ + + + - + ____ + + - + + n = 5 c = 4
  • 28.
    𝑟𝑒 = ±± 2𝑐 −𝑛 𝑛 = ± 8 −5 5 = 1 - 3 5 = 0.771 D) TWO – WAY TABLE METHOD : This method is used to examine the relationship between two categorical variables . The entries in the cells of a two way table can be displayed as frequency counts or as relative frequencies or they can be displayed graphically as a segmented bar chart .
  • 29.
    MULTIPLE CORRELATION ; Inmultiple correlation ,we study the relationship between three or more variable .Suppose the dependent variables is Z and ‘X and Y’ both are independent variables . Then the multiple correlation coefficient is defined as 𝑅𝑧, 𝑥𝑦 = 𝑟2 𝑥𝑧+𝑟2 𝑦𝑧 − 2 𝑟𝑥𝑧 𝑟𝑦𝑧 𝑟𝑥𝑦 1 −𝑟2 𝑥𝑦 𝑅𝑦, 𝑧𝑥 = 𝑟2 𝑧𝑦+𝑟2 𝑥𝑦 − 2 𝑟𝑥𝑦 𝑟𝑧𝑦 𝑟𝑥𝑧 1 −𝑟2 𝑥𝑧
  • 30.
    𝑅𝑥, 𝑦𝑧 = 𝑟2 𝑥𝑦+𝑟2 𝑥𝑧− 2 𝑟𝑥𝑧 𝑟𝑥𝑦 𝑟𝑦𝑧 1 −𝑟2 𝑦𝑧 A coefficient of multiple correlation lies between 0 and 1 . If the value of multiple correlation is one i.e. then the correlation of variables is perfect , while if the value of multiple correlation is zero i.e, 0 then there is no correlation of variable . Sometimes the multiple correlation may be defined as , 𝑅1, 23 = 𝑟2 12+𝑟2 13 − 2 𝑟12 𝑟13 𝑟23 1 −𝑟2 23
  • 31.
    EXAMPLE : Consider 𝑟12= 0.86 , 𝑟13 = 0.71 , 𝑟23 = 0.66 are the zero order correlation coefficients .Then the multiple correlation coefficient . solution : 𝑅1, 23 = 𝑟2 12+𝑟2 13 − 2 𝑟12 𝑟13 𝑟23 1 −𝑟2 23 putting the values of 𝑟12 = 0.86 , 𝑟13 = 0.71 , 𝑟23 = 0.66 In the above formula . 𝑅1, 23 = (0.86)2+ 0.71 2 −2 ×0.86×0.71×0.66 1 −(0.66)2
  • 32.
    = 0.7369+0.5041 −0.805992 1 −0.4356 = 0.437708 0.5644 =0.775527 = 0.88064 Hence , the multiple correlation is 0.8806.
  • 33.