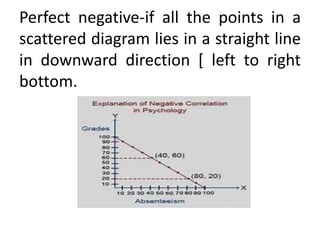
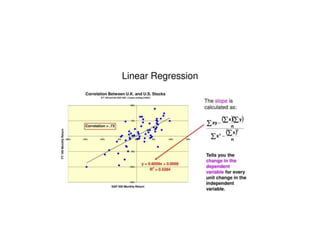
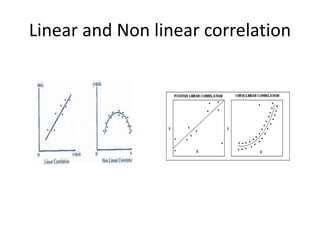
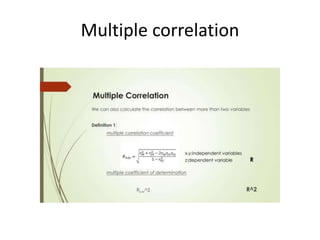
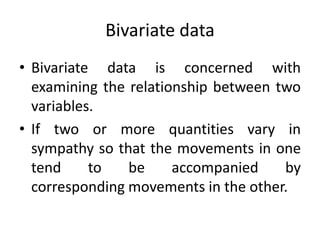
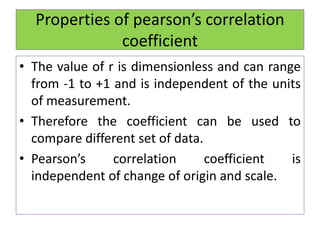
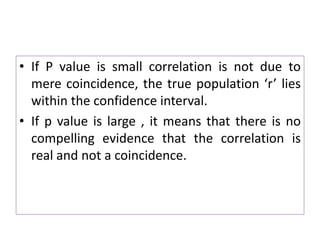
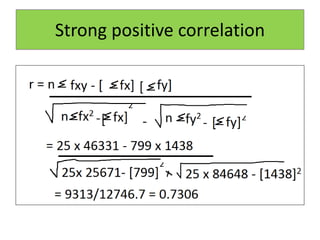
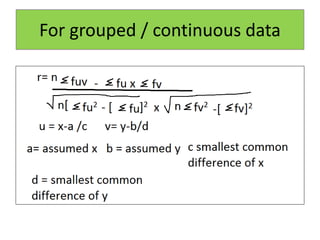
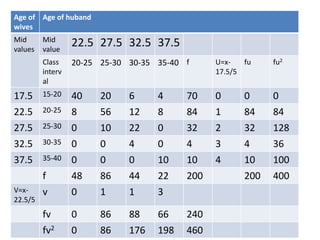
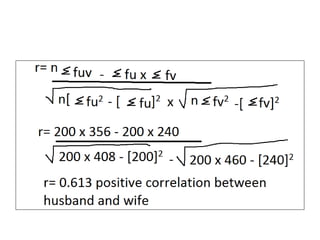
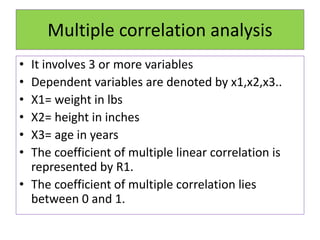
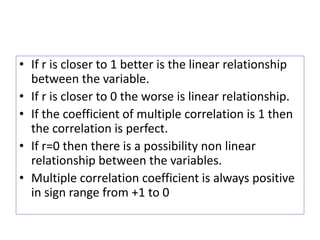
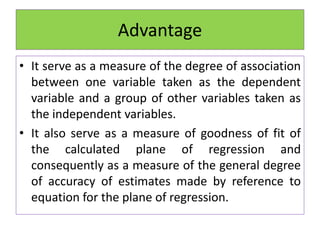
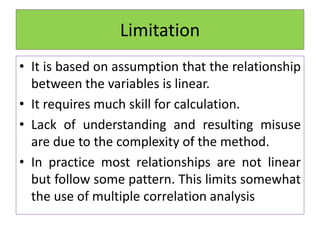
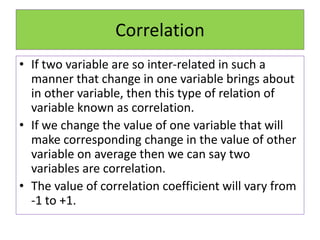
Correlation analysis examines the relationship between two or more variables. Positive correlation means the variables increase together, while negative correlation means they change in opposite directions. The Pearson correlation coefficient, r, quantifies the strength of linear correlation between -1 and 1. Multiple correlation analysis extends this to measure the correlation between one dependent variable and multiple independent variables. It is useful but assumes linear relationships and can be complex to calculate.
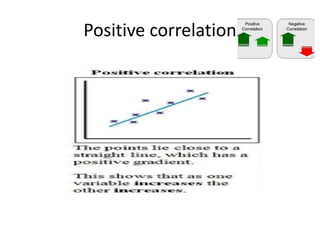
![All points in correlation. The straight
line in upward direction [ left bottom
to right up]](https://image.slidesharecdn.com/correlationanalysis-210329095146/85/Correlation-analysis-8-320.jpg)
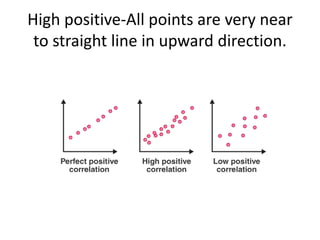
![Positive correlation-all points are near
to the straight line [ but not very near ]
correlation is positive.](https://image.slidesharecdn.com/correlationanalysis-210329095146/85/Correlation-analysis-10-320.jpg)