Downloaded 204 times
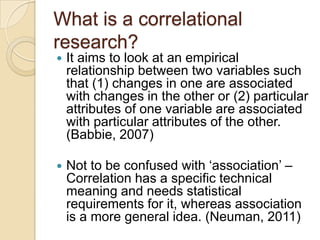


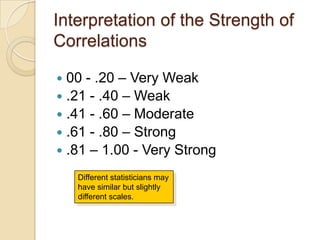
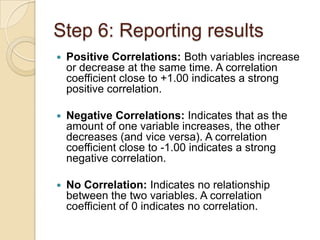


The document discusses correlational research, which examines the relationship between two variables but cannot prove that one causes changes in the other. It explains that correlational studies involve identifying variables, stating questions or hypotheses, collecting data from a sample, calculating correlation coefficients to measure the strength of relationships between variables, and reporting the results. Researchers must be cautious not to assume that correlation necessarily implies causation.


