Downloaded 175 times
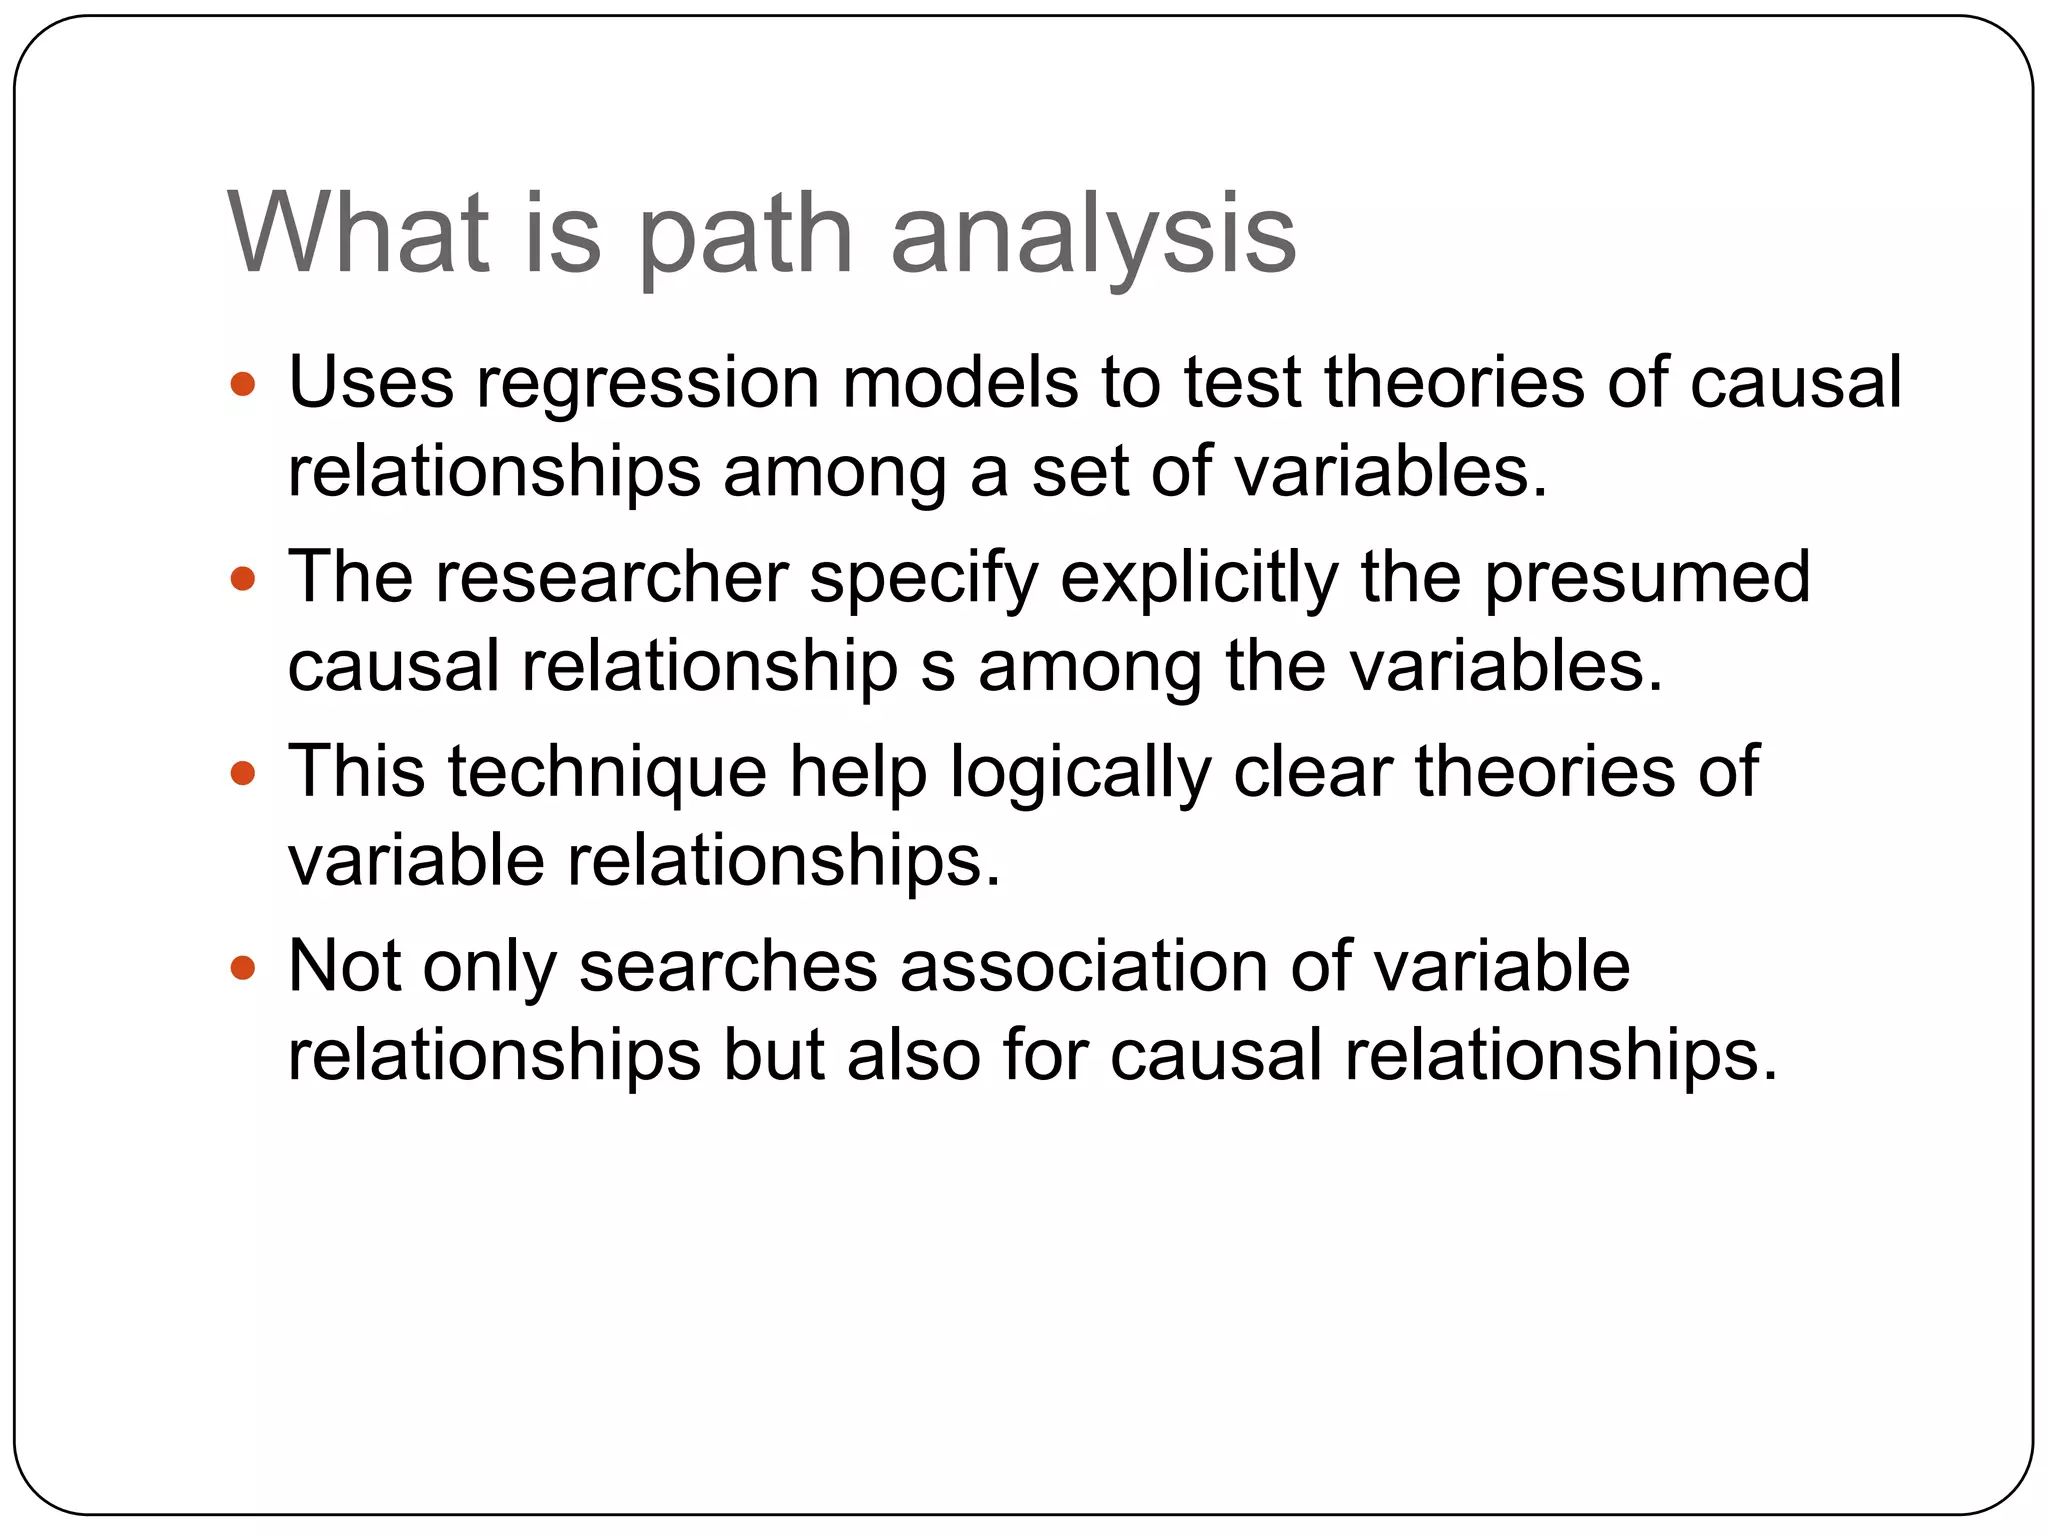
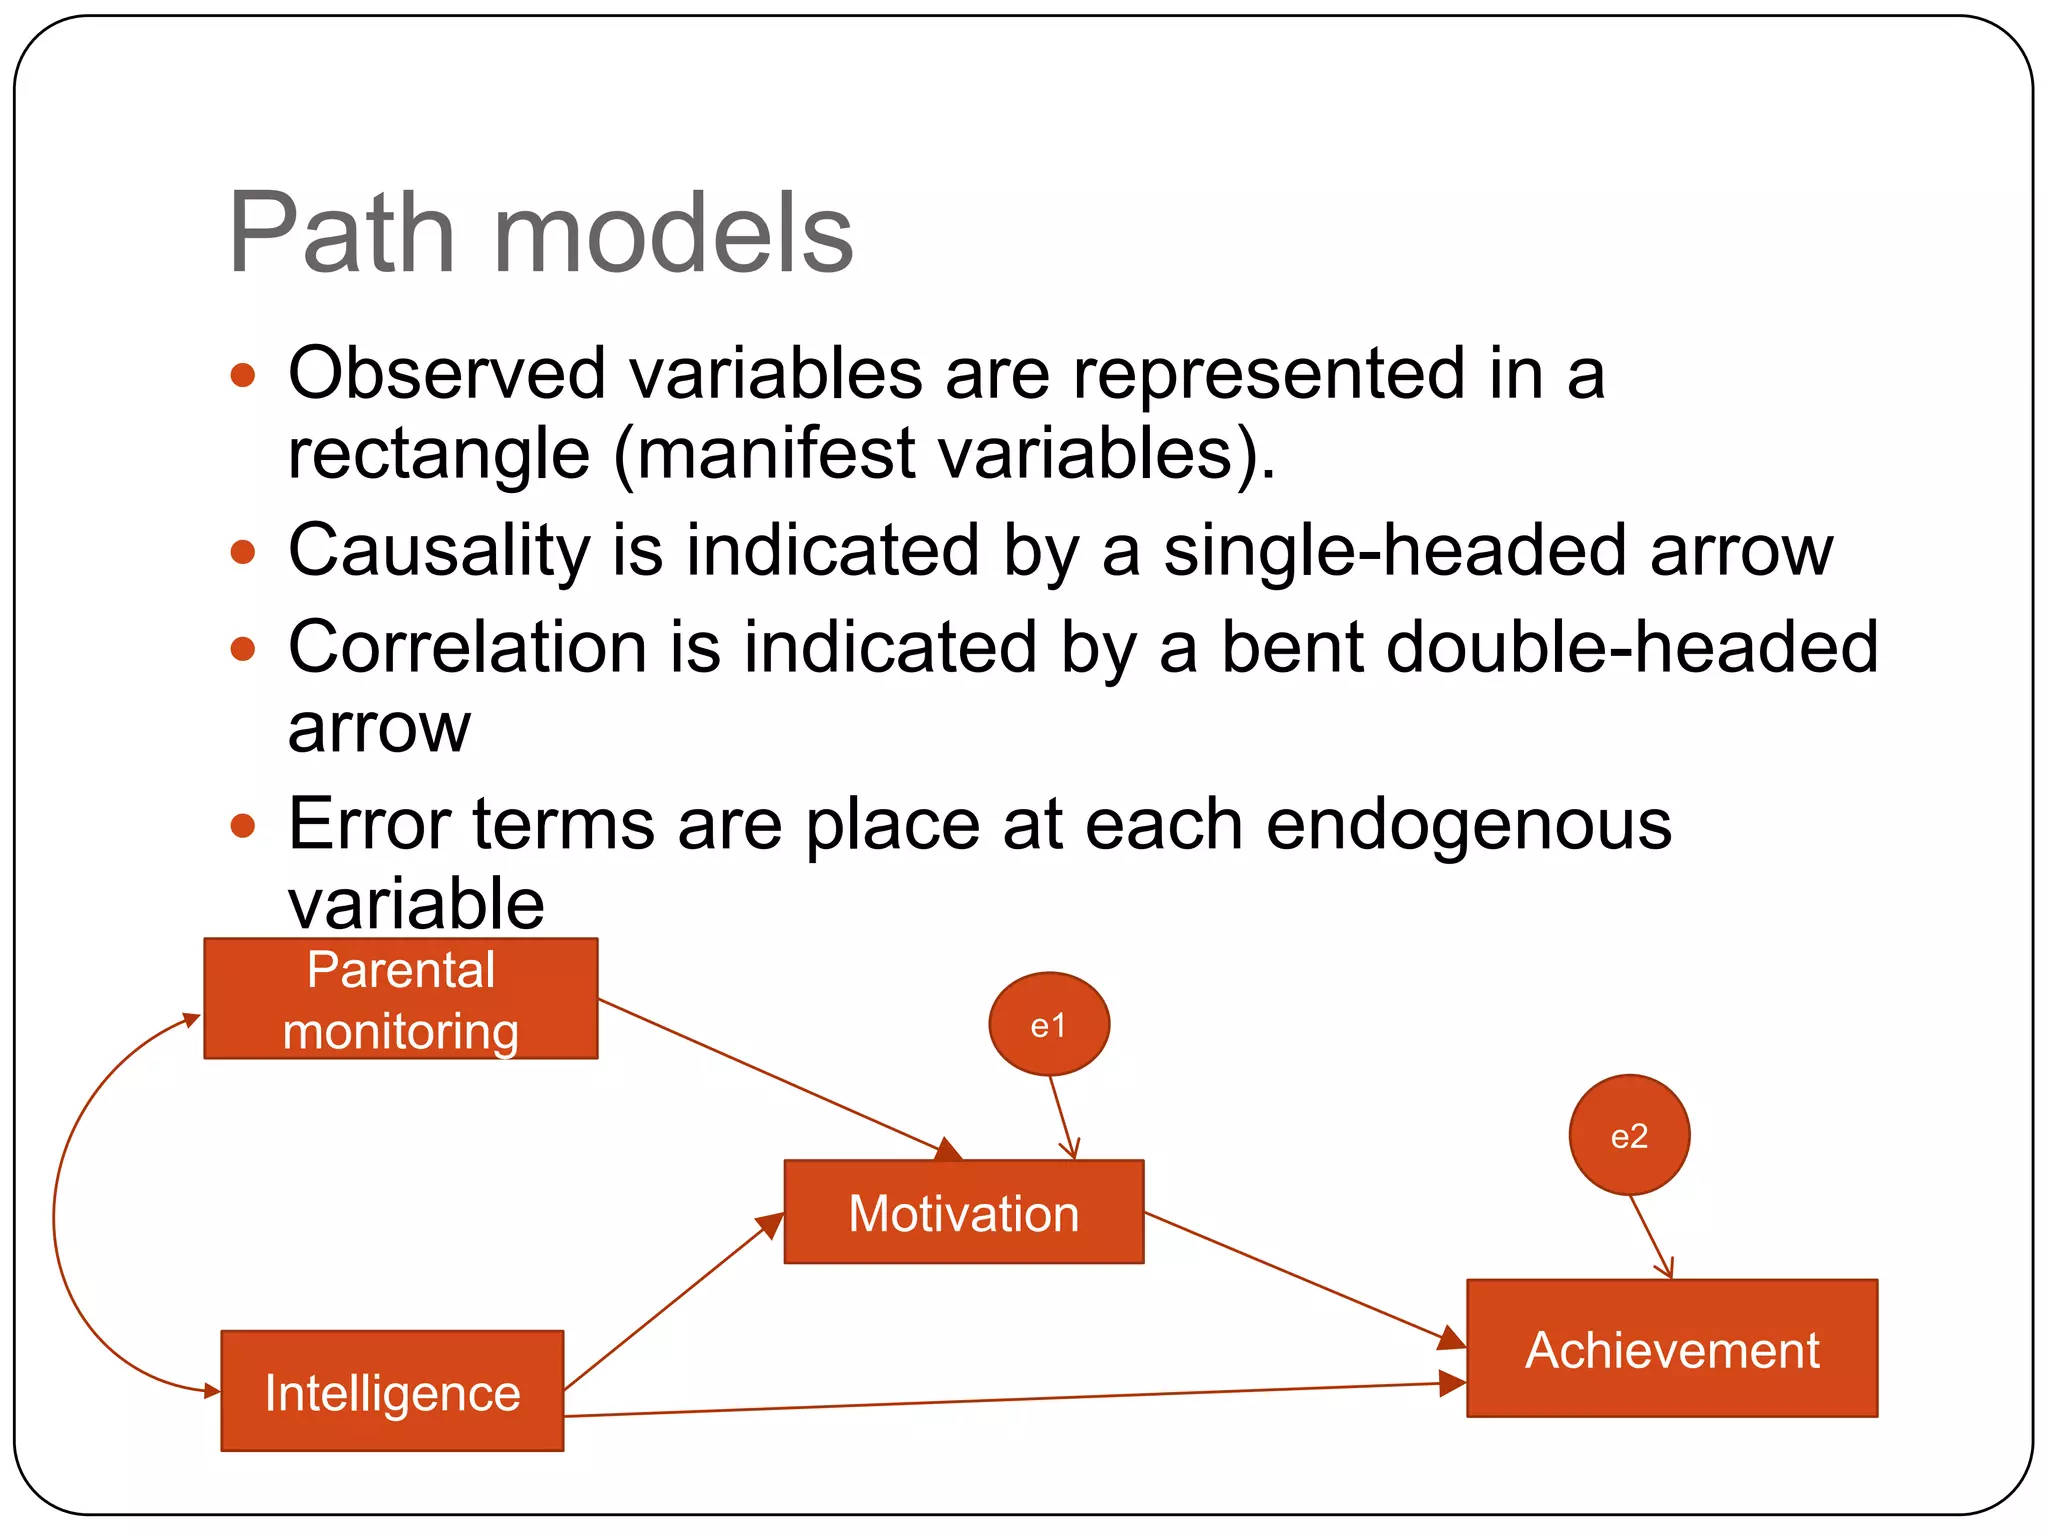
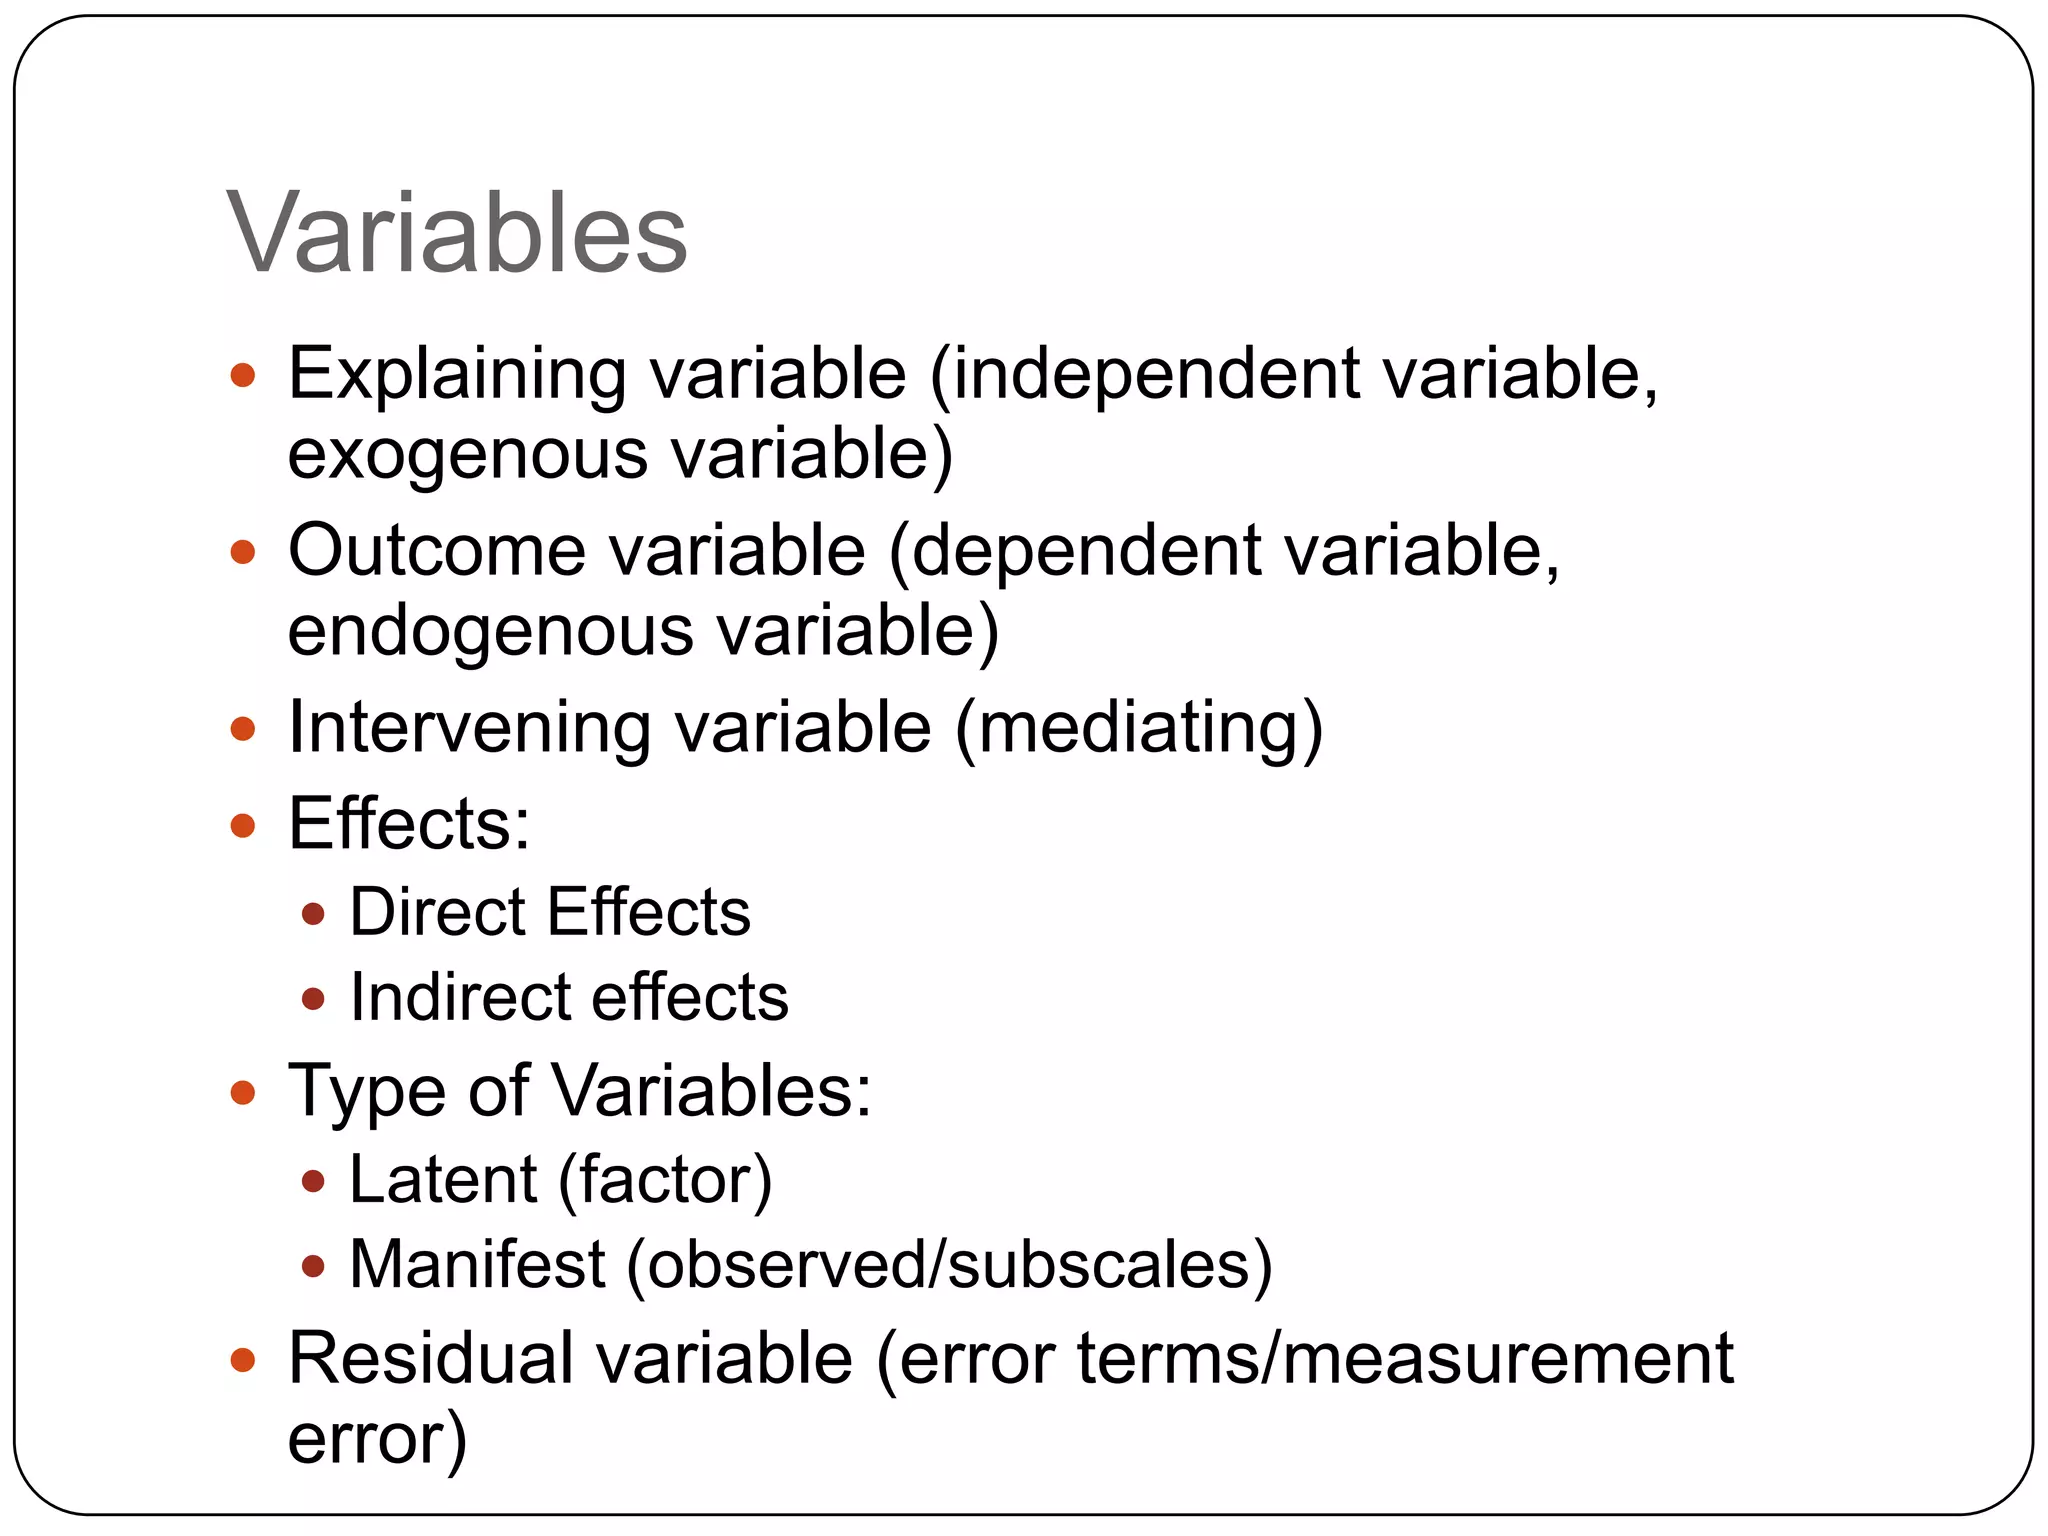
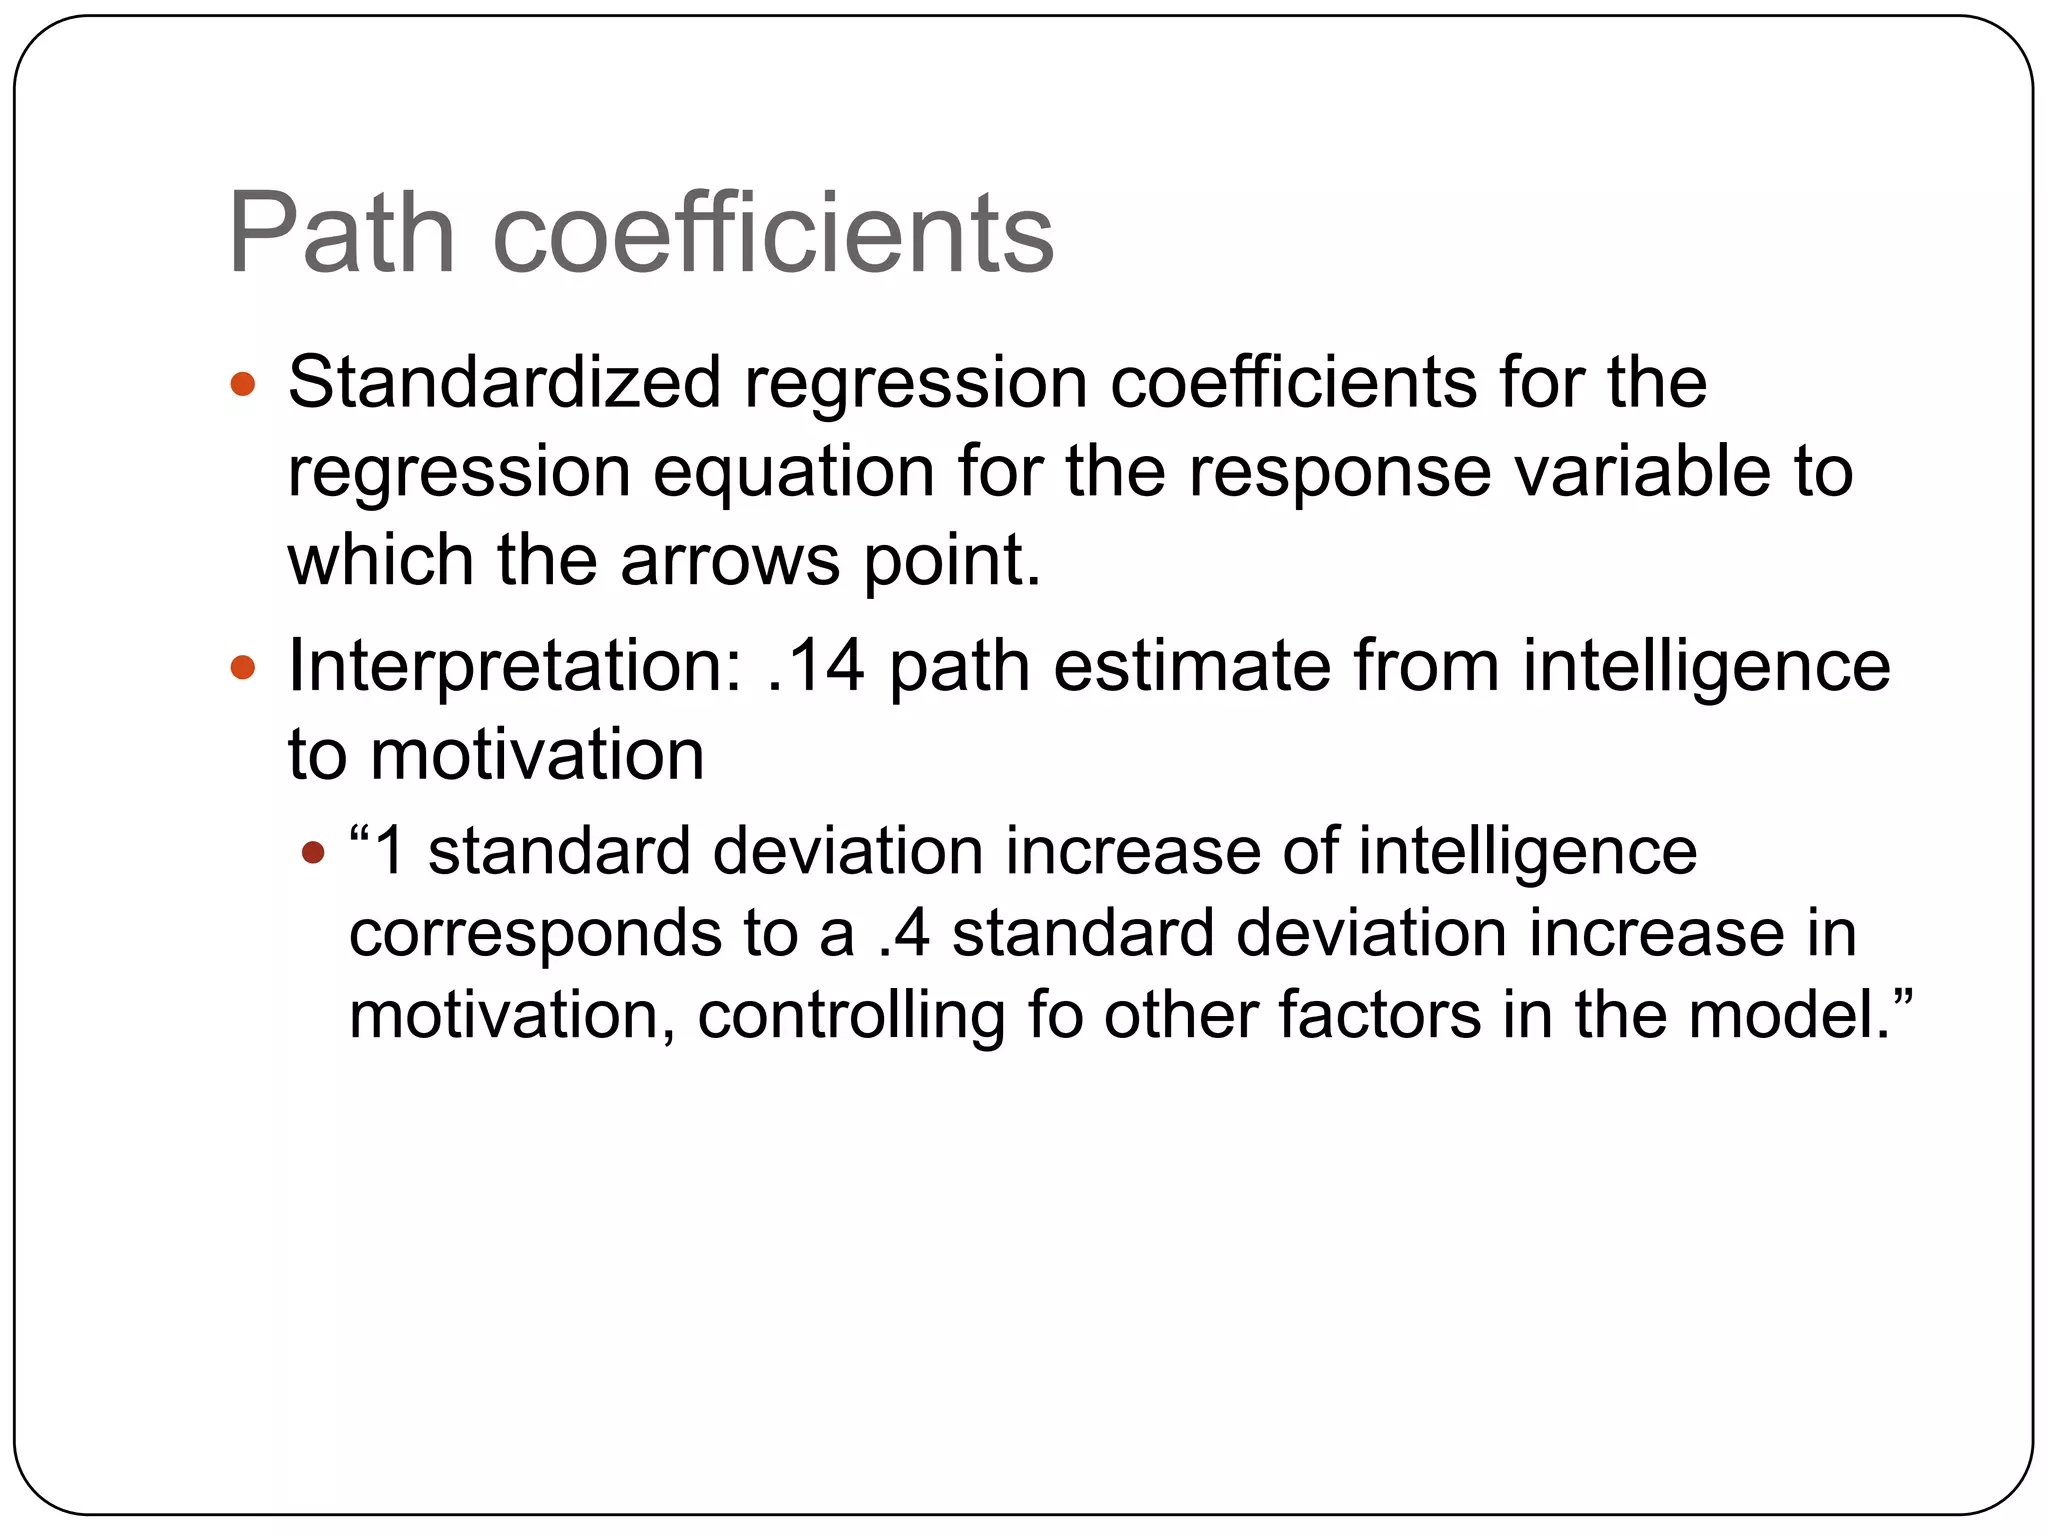

Path analysis is a technique that uses regression models to test theories of causal relationships among variables. It allows researchers to explicitly specify presumed causal relationships and determine not just associations but also potential causal relationships between variables. Path models represent variables as rectangles or ovals, with causality indicated by single-headed arrows and correlation by double-headed arrows. Path coefficients represent standardized regression weights and can be interpreted as the change in the response variable corresponding to a change in the explanatory variable while controlling for other factors.