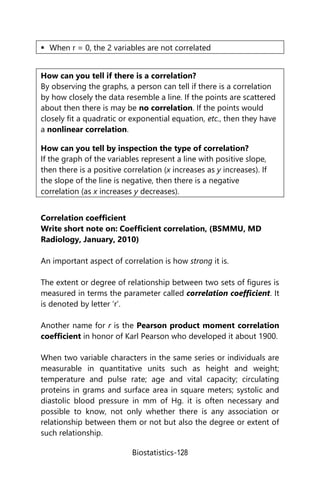
Correlation measures the strength and direction of association between two variables. Positive correlation means both variables increase or decrease together, while negative correlation means one variable increases as the other decreases. Correlation does not imply causation. The correlation coefficient r ranges from -1 to 1, where -1 is total negative correlation, 0 is no correlation, and 1 is total positive correlation. Common types of correlation coefficients include Pearson's correlation coefficient, used with normally distributed interval or ratio data, and Spearman's rank correlation coefficient, used with ordinal or non-normally distributed data. Regression analysis can be used to predict the value of a dependent variable from the value of an independent variable when they are linearly correlated.
![13
Correlation co-efficient (r test)
CORRELATION
[Q:
Define correlation. (BSMMU, MD Radiology, January 2010,
July 2009)
Short note: Correlation & regression (BSMMU, MD
Radiology, January, 2009)]
In statistics, the word correlation refers to the relationship between
two variables. If the change in one variable effects a change in the
other variable, the variables are said to be correlated.
Sometimes two continuous characters are measured in the same
person, such as weight and cholesterol, weight and height etc. At
other times, the same character is measured in two related groups
such as tallness in parents and tallness in children, study of
intelligent quotient (IQ) in brothers and in corresponding sisters
(siblings) and so on. The relationship or association between two
quantitatively measured or continuous variables is called
correlation.
Remember, correlation does not imply causation.
The relationship between two random variables is known as a
bivariate relationship. The known variable (or variables) is called
the independent variable(s). The variable we are trying to predict
is the dependent variable.
Example: A medical researcher may be interested in the bivariate
relationship between a patient’s blood pressure x and heart rate y.
Here x is independent variable and y is dependent variable.
Type of correlation
[Q:](https://image.slidesharecdn.com/ch13correlationandregression-231215043227-a8df42b2/85/ch-13-Correlation-and-regression-doc-1-320.jpg)
![13
Correlation co-efficient (r test)
CORRELATION
[Q:
Define correlation. (BSMMU, MD Radiology, January 2010,
July 2009)
Short note: Correlation & regression (BSMMU, MD
Radiology, January, 2009)]
In statistics, the word correlation refers to the relationship between
two variables. If the change in one variable effects a change in the
other variable, the variables are said to be correlated.
Sometimes two continuous characters are measured in the same
person, such as weight and cholesterol, weight and height etc. At
other times, the same character is measured in two related groups
such as tallness in parents and tallness in children, study of
intelligent quotient (IQ) in brothers and in corresponding sisters
(siblings) and so on. The relationship or association between two
quantitatively measured or continuous variables is called
correlation.
Remember, correlation does not imply causation.
The relationship between two random variables is known as a
bivariate relationship. The known variable (or variables) is called
the independent variable(s). The variable we are trying to predict
is the dependent variable.
Example: A medical researcher may be interested in the bivariate
relationship between a patient’s blood pressure x and heart rate y.
Here x is independent variable and y is dependent variable.
Type of correlation
[Q:](https://image.slidesharecdn.com/ch13correlationandregression-231215043227-a8df42b2/75/ch-13-Correlation-and-regression-doc-1-2048.jpg)
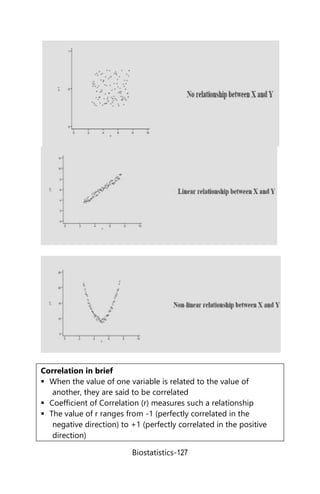
![Biostatistics-126
Discuss different types of correlation with figures.
(BSMMU, MD Radiology, January, 2010)
Classify correlation with figures of each. (BSMMU, MD
Radiology, July, 2009)]
1. Positive correlation:
If the movements of the variables are in the same direction,
the correlation is called positive correlation.
In positive correlation, the two variables react in the same
way, increasing or decreasing together.
Example:
a. Height and weight of a group of people are positively
correlated
b. Temperatures in Celsius and Fahrenheit have a positive
correlation.
In perfect positive correlation, coefficient of Correlation (r) =
+1, and in moderately positive correlation 0 < r <1.
2. Negative correlation:
If the movements of the variables are in the opposite
direction, the correlation is called negative correlation.
In negative correlation, as one variable increases, the other
decreases.
Example: One variable might be the number of hunters in a
region and the other variable could be the deer population.
Perhaps as the number of hunters increases, the deer
population decreases. This is an example of a negative
correlation
In perfect negative correlation, coefficient of correlation (r)
= -1, and in moderately negative correlation -1 < r < 0.
3. Zero correlation:
If the movements of the one variable do not effect the
movement of the other variable, the variables are not
correlated and defined as zero correlation.
In zero correlation, coefficient of correlation (r) = 0.](https://image.slidesharecdn.com/ch13correlationandregression-231215043227-a8df42b2/85/ch-13-Correlation-and-regression-doc-2-320.jpg)
![Biostatistics-131
Serial Number of experiment
1 2 3 4 5
Dose of
drug
0.3 0.4 0.6 0.8 0.9
Response to
drug
54.0. 59.0 60.0 65.0 70.0
From the above data calculate correlation coefficient and its
significance.
[Answer: r =0.9633 p <0.01]
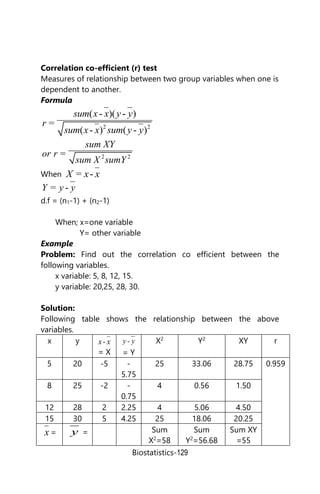
[Q:
Calculate the person's correlation coefficient between X
and Y variables are given below :
X = 5, 7, 10, 12 Y = 4, 6, 9, 11
(BSMMU, MD Radiology, January, 2010)
Find-out the correlation coefficient between the following
2 variable. (BSMMU, MD Radiology, January, 2009)
Variable - I (X-
variable)
10, 15, 20, 25
(n=4)
Variable-II (Y-
variable)
30, 35, 40, 45
(n=4)
The length & weight of 7 mouse are given below.
Compute 'r' and test for its significance.
Length = 2, 5, 8, 12, 14, 19, 22.
Weight = 1, 4, 3, 4, 8, 9, 8
(BSMMU, MD Radiology, January, 2010)
What Is Rank Correlation?](https://image.slidesharecdn.com/ch13correlationandregression-231215043227-a8df42b2/85/ch-13-Correlation-and-regression-doc-7-320.jpg)
![Biostatistics-136
3. Cox proportional hazards regression, a type of survival
analysis.
Linear regression: Here the dependent variable is a continuous
measure (such as body weight) with its frequency distribution
being the normal distribution. and the independent variables may
be both continuous and categorical.
Logistic regression: the dependent variable is derived from the
presence or absence of a characteristic,
Cox proportional hazards: the dependent variable represents the
time from a baseline of some type to the occurrence of an event of
interest.
[Reference: Bonita R, Beaglehole R, Kjellström T 2006. Basic
epidemiology, 2nd
edition, WHO.]
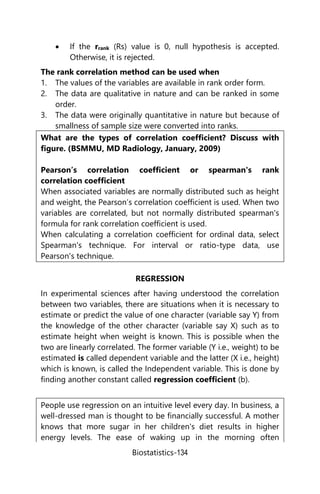
Difference between correlation and regression analysis
There are two important points of differences between correlation
and regression analysis.
1. Whereas correlation coefficient is a measure of degree of
relationship between x and y, the objective of regression
analysis is to study the nature of relationship between the
variables.
2. The cause and effect relation is clearly indicated through
regression analysis than by correlation. Correlation is merely a
tool of ascertaining the degree of relationship between two
variables and, therefore, we can not say that one variable is the
cause and the other the effect.
Scatter diagram
The graphical representation of bivariate data is called scatter
diagram. The graph of the data obtained by the values of the
variables x and y along the x-axis and y-axis respectively in the x-y
plane gives the scatter diagram.](https://image.slidesharecdn.com/ch13correlationandregression-231215043227-a8df42b2/85/ch-13-Correlation-and-regression-doc-12-320.jpg)