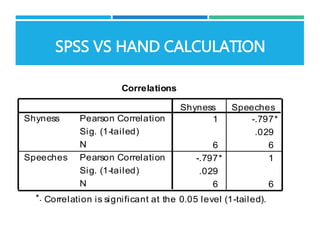
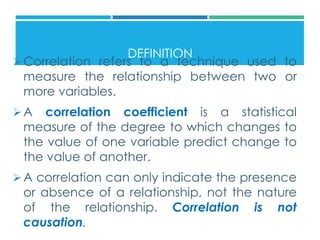
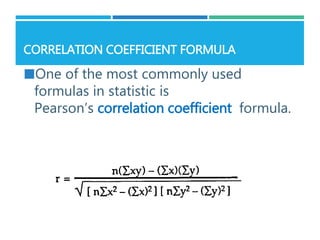
PRESENTATION ON
COEFFICIENT CORRELATION
BY
IRSHAD NAREJO
STATISTICSS FOR EDUCATION
DEFINITION
Correlation refers to a technique used to
measure the relationship between two or
more variables.
A correlation coefficient is a statistical
measure of the degree to which changes to
the value of one variable predict change to
the value of another.
A correlation can only indicate the presence
or absence of a relationship, not the nature
of the relationship. Correlation is not
causation.
CORRELATION COEFFICIENT FORMULA:
OVERVIEW.
Correlation coefficient formulas are used to
find how strong a relationship is between
data. The formulas return a value between
-1 and 1, where:
1 indicates a strong positive relationship.
-1 indicates a strong negative
relationship.
A result of zero indicates no relationship
at all.
POSITIVE CORRELATION
 Association between variables such that high scores
on one variable tend to have high scores on the other
variable
 A direct relation between the variables
NEGATIVE CORRELATION
Association between variables such that high scores on
one variable tend to have low scores on the other
variable.
An inverse relation between the variables
CORRELATION COEFFICIENT FORMULA
One of the most commonly used
formulas in statistic is
Pearson’s correlation coefficient formula.
SPSS VS HAND CALCULATION
X Y XY X2 Y2
0 8 0 0 64
2 10 20 4 100
3 4 12 9 16
6 6 36 36 36
9 1 9 81 1
10 3 30 100 9
30 32 107 230 226
N ∑XY - ∑X ∑Y
r =
[ N ∑X2 – (∑X)2] [N ∑Y2 – (∑Y)2]
(6 X 10⁷) – 30 (32)
[6 (230) – 302] [6 (226) – 322 ]
r = -.797 (note cross
products term in the
numerator is negative)
and R-square = .635
SPSS VS HAND CALCULATION
Correlations
1 -.797*
.029
6 6
-.797* 1
.029
6 6
Pearson Correlation
Sig. (1-tailed)
N
Pearson Correlation
Sig. (1-tailed)
N
Shyness
Speeches
Shyness Speeches
Correlation is significant at the 0.05 level (1-tailed).*.
*Thank you*

coefficient correlation

  • 1.
    PRESENTATION ON COEFFICIENT CORRELATION BY IRSHADNAREJO STATISTICSS FOR EDUCATION
  • 2.
    DEFINITION Correlation refers toa technique used to measure the relationship between two or more variables. A correlation coefficient is a statistical measure of the degree to which changes to the value of one variable predict change to the value of another. A correlation can only indicate the presence or absence of a relationship, not the nature of the relationship. Correlation is not causation.
  • 3.
    CORRELATION COEFFICIENT FORMULA: OVERVIEW. Correlationcoefficient formulas are used to find how strong a relationship is between data. The formulas return a value between -1 and 1, where: 1 indicates a strong positive relationship. -1 indicates a strong negative relationship. A result of zero indicates no relationship at all.
  • 5.
    POSITIVE CORRELATION  Associationbetween variables such that high scores on one variable tend to have high scores on the other variable  A direct relation between the variables
  • 6.
    NEGATIVE CORRELATION Association betweenvariables such that high scores on one variable tend to have low scores on the other variable. An inverse relation between the variables
  • 7.
    CORRELATION COEFFICIENT FORMULA Oneof the most commonly used formulas in statistic is Pearson’s correlation coefficient formula.
  • 8.
    SPSS VS HANDCALCULATION X Y XY X2 Y2 0 8 0 0 64 2 10 20 4 100 3 4 12 9 16 6 6 36 36 36 9 1 9 81 1 10 3 30 100 9 30 32 107 230 226 N ∑XY - ∑X ∑Y r = [ N ∑X2 – (∑X)2] [N ∑Y2 – (∑Y)2] (6 X 10⁷) – 30 (32) [6 (230) – 302] [6 (226) – 322 ] r = -.797 (note cross products term in the numerator is negative) and R-square = .635
  • 9.
    SPSS VS HANDCALCULATION Correlations 1 -.797* .029 6 6 -.797* 1 .029 6 6 Pearson Correlation Sig. (1-tailed) N Pearson Correlation Sig. (1-tailed) N Shyness Speeches Shyness Speeches Correlation is significant at the 0.05 level (1-tailed).*.
  • 10.