Download as PDF, PPTX
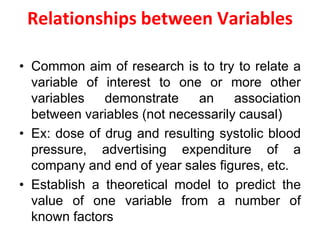


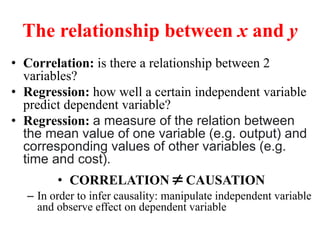


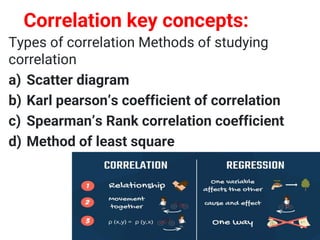


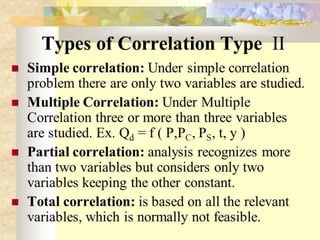


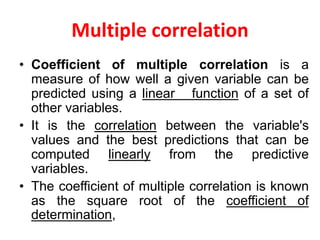


The document presents an overview of correlation methods, including definitions and applications of Karl Pearson's coefficient of correlation and multiple correlation. It emphasizes the distinction between correlation and causation, detailing how correlation measures the strength and direction of relationships between variables. Additionally, the document includes examples and methods for calculating correlation coefficients, as well as an explanation of scatter plots and visual representations of data.