This document provides an overview of quantitative analysis techniques for assessing relationships between variables. It discusses concepts related to relationships including presence, nature, direction, and strength of association. It also defines statistical techniques such as ANOVA, cluster analysis, conjoint analysis, discriminant analysis, factor analysis, logistic regression, and multiple regression. Examples are provided to demonstrate calculating explained and unexplained variance in regression, interpreting regression coefficients, and using dummy variables. Steps for conducting regression analysis are outlined including checking assumptions and interpreting residuals plots.
This document provides an overview of statistical concepts used for risk assessment. It discusses descriptive statistics such as measures of central tendency (mean, median, mode) and dispersion (variance, standard deviation) used to describe data. Inferential statistics use random sampling to make conclusions about unknown populations. Regression analysis is used to construct risk models and measure relationships between variables by finding the regression line equation that best fits the data with the highest R2 value.
The document discusses different types of correlation including positive, negative, simple, partial and multiple correlation. It describes methods for studying correlation such as scatter diagrams, correlation graphs, and Karl Pearson's coefficient of correlation. The key aspects of Pearson's correlation coefficient are also summarized such as its properties, limitations, and how to test for the significance of the correlation coefficient.
Multiple regression allows researchers to use several independent variables simultaneously to predict a continuous dependent variable. It fits a mathematical equation to the data that describes the overall relationship between the dependent variable and independent variables. The equation can be used to predict the dependent variable value based on the values of the independent variables. The technique is useful for social science research where phenomena are influenced by multiple causal factors.
This document provides information about various statistical concepts including variables, probability, distributions, hypothesis testing, and Python libraries for statistical analysis. It defines different types of variables, such as continuous, discrete, categorical, and their examples. It also explains concepts like population, sample, central tendency, dispersion, probability, distributions, hypothesis testing, t-test, z-test, ANOVA. Finally, it mentions commonly used Python libraries like SciPy for conducting statistical tests and analysis.
The document discusses using linear regression analysis in SPSS to analyze the relationship between household size (independent variable) and monthly per capita household expenditure (dependent variable). It outlines the steps to perform the regression analysis in SPSS, including selecting variables, interpreting output tables like the model summary, ANOVA table, and coefficients table. The analysis finds that household size significantly influences monthly expenditure, with expenditure increasing by about 862 taka for each additional household member.
A regression analysis determines the functional relationship between two variables, where one variable is dependent on the other independent variable. Simple linear regression describes this relationship using a straight line equation when there is one independent variable. The regression coefficient represents the slope of the line and predicts the dependent variable value based on the independent variable. The R-squared value indicates how well the regression line represents the true relationship between the variables, with a higher R-squared value indicating a better fit.
PG STAT 531 Lecture 6 Test of Significance, z TestAashish Patel
The document summarizes key concepts related to tests of significance. It discusses:
1) The difference between population parameters and sample statistics. Parameters describe the population while statistics describe samples.
2) The goal of tests of significance is to determine if an observed difference between a sample and population statistic is statistically significant or likely due to chance. Common tests include z-tests, t-tests, chi-square tests, and F-tests.
3) All tests of significance involve a null hypothesis (H0), which is tested against an alternative hypothesis (Ha). The outcome is either rejecting or failing to reject the null hypothesis based on a significance level like alpha=0.05.
4) Type I
1) The document discusses estimation and sample size determination for finite populations, specifically for estimating the mean and proportion. It describes how to calculate confidence intervals and determine sample sizes when sampling without replacement using the finite population correction factor.
2) Formulas are provided for confidence intervals for the mean and proportion when sampling from a finite population without replacement. The finite population correction factor adjusts the standard error and sample size calculations.
3) Examples are given to illustrate how to set up confidence intervals for the mean and proportion and how to determine the necessary sample size using the finite population correction factor.
Get to know more about Directional and Non-Directional Hypothesis tests like one-tail, two-tailed along with 2 sample tests, paired difference T-test, if you are interested to implement the same in python check out my other blogs. Ping me @ google #bobrupakroy Happy Data Science Talk soon!
PG STAT 531 Lecture 2 Descriptive statisticsAashish Patel
This document provides an overview of descriptive statistics. It discusses that descriptive statistics are used to describe basic features of data through simple summaries, without drawing inferences. The document outlines various measures of central tendency like mean, median and mode. It also discusses measures of dispersion such as range, variance and standard deviation that describe how spread out the data is. The key purpose of descriptive statistics is to present quantitative data in a simplified and manageable form.
The document provides information on the Chi-Square test, a non-parametric test used to analyze categorical data. It discusses two main applications of the Chi-Square test: 1) testing goodness-of-fit of observed data to expected frequencies and 2) testing independence of attributes. Several examples are provided to demonstrate how to calculate the Chi-Square statistic and determine if the result is statistically significant based on the degrees of freedom and selected significance level.
This document provides an overview of a data analysis course covering various statistical techniques including correlation, regression, hypothesis testing, clustering, and time series analysis. The course covers descriptive statistics, data exploration, probability distributions, simple and multiple linear regression analysis, logistic regression analysis, and model building for credit risk analysis. Notes are provided on correlation calculation and its properties. Assumptions and interpretations of linear regression are also summarized. The document is intended as a high-level overview of topics covered in the course rather than an in-depth treatment.
The document discusses various statistical and data analysis techniques in Microsoft Excel including:
- Measures of central tendency (mean, median, mode) and variation (standard deviation, variance, range)
- Skewness and kurtosis
- Calculating probabilities and percentiles using the normal distribution
- Creating charts and graphs like histograms, bar charts, and pie charts to organize and visualize data
This document discusses structural equation modeling (SEM) and its applications. SEM allows analyzing relationships between independent and dependent variables that can be continuous or discrete. It involves two main components: a measurement model using confirmatory factor analysis to represent unobserved latent variables, and a structural model to represent paths between variables. Model examination involves assessing fit indices, factor loadings, errors, and regression coefficients. Mediation can be examined using SEM by analyzing indirect paths from an independent variable to a dependent variable through a mediator variable. Bootstrapping provides a more accurate method than the Sobel test for estimating standard errors and confidence intervals in mediation models.
11. simple regression and correlation analysisYohanes Kevin
This document discusses simple regression and correlation analysis. It defines key terms like dependent and independent variables. Regression analysis finds the linear relationship between two variables, while correlation determines the strength of their relationship. The document explains the objectives of regression analysis, describing population and sample regression lines. It provides formulas to calculate coefficients, the standard error, and the coefficient of determination. Sample problems and their interpretations are presented to illustrate the concepts. Hypothesis tests for the regression coefficient and overall model are also introduced.
This document provides an overview of nonparametric statistical methods for analyzing ranked data. It discusses the Wilcoxon rank-sum test and sign test, which are nonparametric alternatives to the t-test that do not assume a normal distribution. The document explains how to rank data values and handle ties. It also provides examples of using the sign test to compare a sample mean to a hypothesized value and interpreting the results.
The document discusses sample size determination and adjusting for non-response in marketing research. It provides definitions of key terms like population, parameter, statistic, and confidence interval. It presents methods for determining sample sizes needed to estimate means, proportions, and multiple characteristics based on desired precision levels and population variability. The document also reviews techniques for adjusting sample sizes based on incidence rates and improving response rates, as well as methods for adjusting estimates for non-response bias, like weighting and imputation. Finally, it provides an example of a company that bases its opinions on online surveys of 1,000 respondents.
An introduction to logistic regression for physicians, public health students and other health workers. Logistic regression is a way to look at effect of a numeric independent variable on a binary (yes-no) dependent variable. For example, you can analyze or model the effect of birth weight on survival.
This presentation discusses the application of logistic model in sports research. One can understand the model and the procedure involved in developing it if the assumptions for this analysis is satisfied.
PG STAT 531 Lecture 5 Probability DistributionAashish Patel
This document provides an overview of probability distributions including binomial, Poisson, and normal distributions. It discusses key concepts such as:
- Binomial distributions describe experiments with two possible outcomes and fixed number of trials.
- Poisson distributions model rare events with sample sizes so large one outcome is much more common.
- Normal distributions produce bell-shaped curves defined by the mean and standard deviation. They are widely used in statistics.
This document discusses normal distributions and how to calculate probabilities and confidence intervals related to normal distributions using Minitab software. Key topics covered include the standard normal distribution, using Minitab to calculate normal distribution probabilities, examples of finding z-scores and areas under the normal curve, confidence intervals for means and proportions, and interpreting confidence intervals.
Intro to Quant Trading Strategies (Lecture 10 of 10)Adrian Aley
This document provides an overview of risk management strategies for algorithmic trading. It discusses various risk measurement techniques including Value at Risk (VaR), Extreme Value Theory (EVT), and the generalized extreme value distribution. Specific risks for different asset classes like bonds, stocks, derivatives and currencies are outlined. Monte Carlo simulation is presented as a technique for modeling rare events and fat tails in return distributions. The document emphasizes that risk is multifaceted and not fully captured by any single measure.
This document defines correlation and discusses the relationship between two variables or events. It introduces the Pearson correlation coefficient r, which ranges from -1 to 1 and measures the strength and direction of association between two variables. Strong positive correlations near 1 indicate that as one variable increases, so does the other. The document also discusses how correlation does not necessarily imply causation and provides examples of calculating r from sample data.
Intro to Quant Trading Strategies (Lecture 6 of 10)Adrian Aley
This document provides an outline and overview of using Kalman filter methods for pairs trading strategies based on modeling the spread between two assets as a mean-reverting process. It discusses modeling the spread as an Ornstein-Uhlenbeck process, computing the expected state from observations using the Kalman filter, and how to predict state estimates and minimize posterior variance in the Kalman filter updating process. References on stochastic spread methods and the application of Kalman filters to pairs trading are also provided.
PG STAT 531 Lecture 3 Graphical and Diagrammatic Representation of DataAashish Patel
The document discusses various methods of graphically and diagrammatically representing statistical data, including:
1) Bar diagrams, pie charts, and line graphs that use bars, circles, or lines to show relationships between data points;
2) Histograms that use rectangles to show frequency distributions; and
3) Frequency polygons and curves that smooth data points to reveal trends, and ogives that show cumulative frequencies. Graphical representations make trends and relationships easier for experts and non-experts to understand versus numerical representations alone.
The document discusses several topics in European history including the United Kingdom, France, World War II, the Cold War, and the European Union/economics. It provides factual information about each topic in a question and answer format. Key details include the capital and government of the UK and France, the sides in WWII and how Germany was divided after, how the Cold War was between the US and Soviet Union without direct conflict, and reasons for forming the European Union related to increasing trade.
This document contains instructions for classroom activities related to reviewing concepts about Europe. It includes directions for power practice questions, bellringers, a review circuit, think dots, and studying for a test. The learning goals are to review Europe concepts and show respectful classroom behavior.
Since Windows 7 and Windows Server 2008 R2, Windows PowerShell has been a part of the core operating system, meaning we will see the next version of PowerShell in Windows 8. In this session we will look at what`s new in Windows PowerShell 3.0, based on the Windows Developer Preview released at the BUILD conference in September. You will get to see new features in PowerShell itself, as well as new modules for managing Windows 8 and Windows Server 8.
Alyson Humphrey graduated from the University of Kentucky with a bachelor's degree in human nutrition. She is passionate about helping others and has worked in plant biotechnology research for one year and animal nutrition research for three years. Her interests include cooking, yoga, running, music and her pets. In the future, she aims to attend graduate school and work in a job related to food and nutrition where she can teach others about healthy lifestyles.
Presentation
Database description (very short version)
Background
LeadDesk is the industry-leading platform for call center, inside sales and telemarketing operations. More than 1 million calls handled each week. LeadDesk platform includes (A) All-in-one software for call centers and telesales team, (B) Control & communication solution for product owners with outsourced call centers, (C) Database of B2B and B2C contact information.Contact sales@leaddesk.com
LeadDesk basic background info and system descriptionLeadDesk
Presentation
Basic background info & system description
Background
LeadDesk is the industry-leading platform for call center, inside sales and telemarketing operations. More than 1 million calls handled each week. LeadDesk platform includes (A) All-in-one software for call centers and telesales team, (B) Control & communication solution for product owners with outsourced call centers, (C) Database of B2B and B2C contact information.Contact www.leaddesk.com or sales@leaddesk.com
The document provides brief instructions for classroom activities on different dates, including gluing a bellringer on page 84, analyzing social justice issues in Africa by completing a chart, defining topics, and writing two questions about topics discussed that day. It also notes the teacher's thoughts about the activities relating to real life and an upcoming year-end project and transition to 1:1 learning.
Quantitative techniques are increasingly used in competition policy to delineate markets, analyze market structure and competition, and evaluate efficiencies. The lecture introduces various quantitative techniques used in different applications including elasticity estimation, concentration indices, price correlation analysis, and simulation models. While market power can encourage innovation, it also reduces allocative and productive efficiency. There is a need to balance ex-ante innovation incentives with ex-post availability of innovations.
This document discusses opportunities for companies to partner with LeadDesk, a leading call center software platform. It outlines different partnership models such as creating apps for the LeadDesk platform, integrating software, distributing leads, and reselling LeadDesk. The document also provides information on LeadDesk's customers, features, hosting infrastructure, and opportunities for customization and integration with other systems like CRM. Partnering with LeadDesk could help companies boost their business through access to LeadDesk's software and large customer base.
The document provides information about the ancient Mayan civilization, including:
1) Where the Mayans lived (parts of Mexico and Central America), their peak period of 250-900 AD, and their advanced culture.
2) Aspects of Mayan society such as their 365-day calendar based on the sun's movement, a 260-day ritual calendar, mathematics concepts including zero, and a sophisticated hieroglyphic written language.
3) Details on their agricultural techniques like slash-and-burn farming and ridge construction, as well as their decline starting around 900 AD though the specific reasons are unknown.
The document summarizes key aspects of the ancient Mayan civilization in Latin America between 250-900 AD. It describes that the Mayans had advanced calendars, a sophisticated mathematical system including the concept of zero, and the best written language in ancient Latin America based on hieroglyphic symbols. While the Mayans flourished for centuries, their civilization weakened around 900 AD for unknown reasons, though environmental and social factors may have contributed to the changes.
This document provides an overview and agenda for an Excel training program on accounting and auditing techniques. The training will cover basic Excel functions and features, and how they can be applied to analytical procedures used in accounting and auditing, including horizontal analysis, vertical analysis, trend analysis, and other analytical tests. Attendees will learn how to insert formulas, copy and paste formulas, auto-fill formulas, use relative and absolute cell referencing, and create pivot tables to convert transaction data into balances for performing trend analysis. Practical exercises using a case study workbook will allow attendees to apply the skills taught.
- Regression models can be used to predict outcomes and understand which factors influence them. Examples given include predicting India's energy consumption based on GDP growth and the probability of a customer defaulting on a loan.
- Simple and multiple regression models define the dependent variable Y and identify independent variables X to estimate relationships and interpret results.
- Non-linear probability models like logistic (logit) and probit models are better suited when the dependent variable is dichotomous like default/no default. These transform the probability in a non-linear way compared to the linear probability model (LPM).
This document summarizes planning tools and techniques discussed in Chapter 9. It describes environmental scanning, which involves screening large amounts of information to anticipate changes in the environment. It also discusses competitor intelligence, forecasting, different types of forecasting including quantitative and qualitative, and benchmarking, which is searching for best practices that lead to superior performance among competitors and non-competitors.
Detecting and Auditing for Fraud in Financial Statements Using Data AnalysisFraudBusters
Webinar series from FraudResourceNet LLC on Preventing and Detecting Fraud Using Data Analytics. Recordings of these Webinars are available for purchase from our Website fraudresourcenet.com
This Webinar focused on fraud detection using data analytic software (Excel, ACL, IDEA)
FraudResourceNet (FRN) is the only searchable portal of practical, expert fraud prevention, detection and audit information on the Web.
FRN combines the high quality, authoritative anti-fraud and audit content from the leading providers, AuditNet ® LLC and White-Collar Crime 101 LLC/FraudAware.
The two entities designed FRN as the “go-to”, easy-to-use source of “how-to” fraud prevention, detection, audit and investigation templates, guidelines, policies, training programs (recorded no CPE and live with CPE) and articles from leading subject matter experts.
FRN is a continuously expanding and improving resource, offering auditors, fraud examiners, controllers, investigators and accountants a content-rich source of cutting-edge anti-fraud tools and techniques they will want to refer to again and again.
The document outlines the Business Analysis Body of Knowledge (BABOK), which provides best practices for business analysis. It details 36 techniques used in business analysis across 6 knowledge areas: business analysis planning & monitoring, elicitation & facilitation, requirements management & communication, enterprise analysis, requirements analysis, and solution assessment & validation. It also lists 6 underlying competencies needed for business analysis.
This document discusses multiple linear regression analysis performed using SAS. It begins by outlining the assumptions of linear regression, including a linear relationship between variables, normality, no multicollinearity, and homoscedasticity. It then explains that multiple linear regression attempts to model the relationship between multiple explanatory variables and a response variable by fitting a linear equation to observed data. The document goes on to describe the regression analysis process, model selection, interpretation of outputs like R-squared and p-values, and evaluation of diagnostics like autocorrelation. It concludes by listing the predictor variables selected by the stepwise regression model and interpreting their parameter estimates.
This document discusses correlation coefficient and regression analysis. It defines correlation coefficient as representing the relationship between two variables with a straight line and ranging from -1 to 1. Regression analysis predicts changes in a dependent variable from changes in independent variables. The coefficient of determination measures the proportion of variance explained by the regression model. Multiple regression uses two or more explanatory variables to predict an outcome.
This document discusses correlation and regression analysis. It defines correlation as a statistical measure of how related two variables are. A correlation coefficient between -1 and 1 indicates the strength and direction of the relationship. Scatterplots visually depict the relationship between variables. Regression analysis predicts the value of a dependent variable based on the value of one or more independent variables. The regression equation represents the line of best fit through the data points that minimizes the residuals.
A presentation for Multiple linear regression.pptvigia41
Multiple linear regression (MLR) is a statistical method used to predict the value of a dependent variable based on the values of two or more independent variables. MLR produces an equation that estimates the best weighted combination of independent variables to predict the dependent variable. MLR can assess the contribution and relative importance of each predictor variable while controlling for the effects of the other predictors. MLR requires that assumptions of independence, normality, homoscedasticity, and linearity are met.
This document discusses correlation, regression, and issues that can arise when performing regression analysis. It defines correlation and covariance, and how to interpret a scatter plot. It explains how to test for statistical significance of correlation and establish if a linear relationship exists between variables. Simple and multiple linear regression are explained, including assumptions, model construction, and importance of regression coefficients. It discusses how to assess the importance of independent variables in explaining the dependent variable using t-tests, F-tests, R-squared, and adjusted R-squared. Potential issues like heteroskedasticity and multicollinearity are also summarized.
1. The document discusses the simple linear regression model, which relates a dependent variable Y to an independent variable X using a straight line. It defines key terms like the population regression function, sample regression function, and error term.
2. It describes how ordinary least squares regression estimates the parameters in the sample regression function by minimizing the sum of squared residuals. This provides estimated values for the intercept and slope.
3. It discusses some algebraic properties of ordinary least squares estimates, including that the sum of residuals is 0 and their sample covariance with the independent variable is 0. It also defines other summary statistics like R-squared and total, explained, and residual sum of squares.
1. The document discusses the simple linear regression model, which relates a dependent variable Y to an independent variable X using a straight line. It defines key terms like the population regression function, sample regression function, and the error term.
2. It describes how ordinary least squares regression estimates the parameters in the sample regression function by minimizing the sum of squared residuals. This provides estimated values for the intercept and slope.
3. It discusses some algebraic properties of the ordinary least squares estimates, including that the sum of residuals is 0 and their sample covariance with the independent variable is 0. It also defines other measures of fit like R-squared and total, explained, and residual sum of squares.
This document discusses correlation and the Pearson correlation coefficient (r). It investigates the linear association between body weight and plasma volume in 8 subjects. The correlation coefficient (r) between weight and plasma volume is calculated to be 0.76, indicating a strong positive correlation. A t-test shows this correlation is statistically significant. Values of r range from -1 to 1, where higher positive or negative values indicate stronger linear relationships.
Correlation analysis is used to determine the relationship between two or more variables. It can analyze the degree, direction, and type of relationship. The key types of correlation are positive (variables increase together), negative (variables change inversely), simple (two variables), partial (three+ variables with some held constant), and multiple (three+ variables together). Correlation can also be linear (constant ratio of changes) or non-linear (varying ratio of changes). It is useful for understanding variable behavior, estimating values, and interpreting results with measures like the correlation coefficient and coefficient of determination.
The document discusses bivariate and multivariate linear regression analysis, explaining how to estimate regression coefficients using software like SPSS and interpret their results. It covers topics such as estimating and interpreting intercept and slope coefficients, measuring predictive power using R-squared, and testing the significance of individual regression coefficients and the overall regression model through techniques like t-tests and F-tests.
The document discusses the concept of correlation as a way to quantify the association between two variables. It explains that correlation standardizes the covariance between two variables by dividing by the product of their standard deviations. This results in a correlation value between -1 and 1, where values closer to -1 or 1 indicate a stronger linear relationship between the variables. The correlation coefficient provides a standardized way to measure the strength and direction of association between two quantitative variables.
This document provides an overview of correlation and linear regression. It defines key terms like independent variable, dependent variable, correlation coefficient, and regression coefficients. It explains how to calculate the correlation coefficient and regression coefficients using the least squares method. Properties of the regression coefficients are also discussed. Examples are provided to demonstrate how to interpret correlation, draw scatter plots, calculate coefficients, and predict values using the linear regression equation.
Unit-I, BP801T. BIOSTATISITCS AND RESEARCH METHODOLOGY (Theory)
Correlation: Definition, Karl Pearson’s coefficient of correlation, Multiple correlations -
Pharmaceuticals examples.
Correlation: is there a relationship between 2
variables.
Linear regression analysis allows researchers to predict scores on a dependent or criterion variable (Y) based on knowledge of an independent or predictor variable (X). Simple linear regression involves using one predictor variable to predict scores on the dependent variable. Multiple regression expands this to use multiple predictor variables. Key aspects of regression analysis covered in the document include the correlation between variables, using the least squares method to determine the best fitting regression line, computing predicted Y scores, explaining and unexplained variance, and the importance of multiple regression in understanding how well predictor variables predict the criterion variable.
This document provides an overview of correlation analysis procedures in SPSS, including bivariate correlation, partial correlation, and distance measures. It discusses interpreting correlation coefficients and significance values. Scatterplots are recommended to check assumptions before correlation. Hands-on exercises are included to find correlations between variables while controlling for other variables.
This document provides an overview of key concepts in applied statistics including:
- Measures of central tendency such as the mean, median, mode, and midrange for discrete, grouped and continuous data
- Measures of dispersion like range, mean deviation, standard deviation, variance, and coefficient of variation
- Regression analysis and how to calculate linear regression equations
- Correlation and how to compute the covariance and coefficient of correlation between two variables
The document discusses chi-square test and its properties. It defines chi-square as a non-parametric statistical test used for discrete data to test for independence and goodness of fit between observed and expected frequencies. The chi-square test has some key assumptions including independent random samples, nominal or ordinal level data, and no expected cell counts below 5. It is calculated by subtracting expected from observed frequencies, squaring the differences, and dividing by expected counts. The chi-square test can identify if there is a significant association between variables but does not measure the strength of the association.
This document summarizes a presentation on correlation and regression analysis. It introduces correlation, which measures the strength and direction of association between two variables. It describes Pearson's correlation coefficient and Spearman's correlation coefficient, and when each is appropriate. It then discusses regression, explaining the difference between correlation and regression, and introducing linear regression, logistic regression, and their applications. Examples of running linear and logistic regression in SPSS are provided.
Regression analysis is a statistical technique used to investigate relationships between variables. It allows one to determine the strength of the relationship between a dependent variable (usually denoted by Y) and one or more independent variables (denoted by X). Multiple regression extends this to analyze the relationship between a dependent variable and multiple independent variables. The goals of regression analysis are to understand how the dependent variable changes with the independent variables and to use the independent variables to predict the value of the dependent variable. It requires the dependent variable to be continuous and the independent variables can be either continuous or categorical.
Similar to 9 Quantitative Analysis Techniques (20)
Best practices for project execution and deliveryCLIVE MINCHIN
A select set of project management best practices to keep your project on-track, on-cost and aligned to scope. Many firms have don't have the necessary skills, diligence, methods and oversight of their projects; this leads to slippage, higher costs and longer timeframes. Often firms have a history of projects that simply failed to move the needle. These best practices will help your firm avoid these pitfalls but they require fortitude to apply.
[To download this presentation, visit:
https://www.oeconsulting.com.sg/training-presentations]
This PowerPoint compilation offers a comprehensive overview of 20 leading innovation management frameworks and methodologies, selected for their broad applicability across various industries and organizational contexts. These frameworks are valuable resources for a wide range of users, including business professionals, educators, and consultants.
Each framework is presented with visually engaging diagrams and templates, ensuring the content is both informative and appealing. While this compilation is thorough, please note that the slides are intended as supplementary resources and may not be sufficient for standalone instructional purposes.
This compilation is ideal for anyone looking to enhance their understanding of innovation management and drive meaningful change within their organization. Whether you aim to improve product development processes, enhance customer experiences, or drive digital transformation, these frameworks offer valuable insights and tools to help you achieve your goals.
INCLUDED FRAMEWORKS/MODELS:
1. Stanford’s Design Thinking
2. IDEO’s Human-Centered Design
3. Strategyzer’s Business Model Innovation
4. Lean Startup Methodology
5. Agile Innovation Framework
6. Doblin’s Ten Types of Innovation
7. McKinsey’s Three Horizons of Growth
8. Customer Journey Map
9. Christensen’s Disruptive Innovation Theory
10. Blue Ocean Strategy
11. Strategyn’s Jobs-To-Be-Done (JTBD) Framework with Job Map
12. Design Sprint Framework
13. The Double Diamond
14. Lean Six Sigma DMAIC
15. TRIZ Problem-Solving Framework
16. Edward de Bono’s Six Thinking Hats
17. Stage-Gate Model
18. Toyota’s Six Steps of Kaizen
19. Microsoft’s Digital Transformation Framework
20. Design for Six Sigma (DFSS)
To download this presentation, visit:
https://www.oeconsulting.com.sg/training-presentations
The Steadfast and Reliable Bull: Taurus Zodiac Signmy Pandit
Explore the steadfast and reliable nature of the Taurus Zodiac Sign. Discover the personality traits, key dates, and horoscope insights that define the determined and practical Taurus, and learn how their grounded nature makes them the anchor of the zodiac.
Navigating the world of forex trading can be challenging, especially for beginners. To help you make an informed decision, we have comprehensively compared the best forex brokers in India for 2024. This article, reviewed by Top Forex Brokers Review, will cover featured award winners, the best forex brokers, featured offers, the best copy trading platforms, the best forex brokers for beginners, the best MetaTrader brokers, and recently updated reviews. We will focus on FP Markets, Black Bull, EightCap, IC Markets, and Octa.
Top 10 Free Accounting and Bookkeeping Apps for Small BusinessesYourLegal Accounting
Maintaining a proper record of your money is important for any business whether it is small or large. It helps you stay one step ahead in the financial race and be aware of your earnings and any tax obligations.
However, managing finances without an entire accounting staff can be challenging for small businesses.
Accounting apps can help with that! They resemble your private money manager.
They organize all of your transactions automatically as soon as you link them to your corporate bank account. Additionally, they are compatible with your phone, allowing you to monitor your finances from anywhere. Cool, right?
Thus, we’ll be looking at several fantastic accounting apps in this blog that will help you develop your business and save time.
Industrial Tech SW: Category Renewal and CreationChristian Dahlen
Every industrial revolution has created a new set of categories and a new set of players.
Multiple new technologies have emerged, but Samsara and C3.ai are only two companies which have gone public so far.
Manufacturing startups constitute the largest pipeline share of unicorns and IPO candidates in the SF Bay Area, and software startups dominate in Germany.
SATTA MATKA SATTA FAST RESULT KALYAN TOP MATKA RESULT KALYAN SATTA MATKA FAST RESULT MILAN RATAN RAJDHANI MAIN BAZAR MATKA FAST TIPS RESULT MATKA CHART JODI CHART PANEL CHART FREE FIX GAME SATTAMATKA ! MATKA MOBI SATTA 143 spboss.in TOP NO1 RESULT FULL RATE MATKA ONLINE GAME PLAY BY APP SPBOSS
[To download this presentation, visit:
https://www.oeconsulting.com.sg/training-presentations]
This presentation is a curated compilation of PowerPoint diagrams and templates designed to illustrate 20 different digital transformation frameworks and models. These frameworks are based on recent industry trends and best practices, ensuring that the content remains relevant and up-to-date.
Key highlights include Microsoft's Digital Transformation Framework, which focuses on driving innovation and efficiency, and McKinsey's Ten Guiding Principles, which provide strategic insights for successful digital transformation. Additionally, Forrester's framework emphasizes enhancing customer experiences and modernizing IT infrastructure, while IDC's MaturityScape helps assess and develop organizational digital maturity. MIT's framework explores cutting-edge strategies for achieving digital success.
These materials are perfect for enhancing your business or classroom presentations, offering visual aids to supplement your insights. Please note that while comprehensive, these slides are intended as supplementary resources and may not be complete for standalone instructional purposes.
Frameworks/Models included:
Microsoft’s Digital Transformation Framework
McKinsey’s Ten Guiding Principles of Digital Transformation
Forrester’s Digital Transformation Framework
IDC’s Digital Transformation MaturityScape
MIT’s Digital Transformation Framework
Gartner’s Digital Transformation Framework
Accenture’s Digital Strategy & Enterprise Frameworks
Deloitte’s Digital Industrial Transformation Framework
Capgemini’s Digital Transformation Framework
PwC’s Digital Transformation Framework
Cisco’s Digital Transformation Framework
Cognizant’s Digital Transformation Framework
DXC Technology’s Digital Transformation Framework
The BCG Strategy Palette
McKinsey’s Digital Transformation Framework
Digital Transformation Compass
Four Levels of Digital Maturity
Design Thinking Framework
Business Model Canvas
Customer Journey Map
The APCO Geopolitical Radar - Q3 2024 The Global Operating Environment for Bu...APCO
The Radar reflects input from APCO’s teams located around the world. It distils a host of interconnected events and trends into insights to inform operational and strategic decisions. Issues covered in this edition include:
Zodiac Signs and Food Preferences_ What Your Sign Says About Your Tastemy Pandit
Know what your zodiac sign says about your taste in food! Explore how the 12 zodiac signs influence your culinary preferences with insights from MyPandit. Dive into astrology and flavors!
3 Simple Steps To Buy Verified Payoneer Account In 2024SEOSMMEARTH
Buy Verified Payoneer Account: Quick and Secure Way to Receive Payments
Buy Verified Payoneer Account With 100% secure documents, [ USA, UK, CA ]. Are you looking for a reliable and safe way to receive payments online? Then you need buy verified Payoneer account ! Payoneer is a global payment platform that allows businesses and individuals to send and receive money in over 200 countries.
If You Want To More Information just Contact Now:
Skype: SEOSMMEARTH
Telegram: @seosmmearth
Gmail: seosmmearth@gmail.com
NIMA2024 | De toegevoegde waarde van DEI en ESG in campagnes | Nathalie Lam |...BBPMedia1
Nathalie zal delen hoe DEI en ESG een fundamentele rol kunnen spelen in je merkstrategie en je de juiste aansluiting kan creëren met je doelgroep. Door middel van voorbeelden en simpele handvatten toont ze hoe dit in jouw organisatie toegepast kan worden.
Digital Marketing with a Focus on Sustainabilitysssourabhsharma
Digital Marketing best practices including influencer marketing, content creators, and omnichannel marketing for Sustainable Brands at the Sustainable Cosmetics Summit 2024 in New York
Storytelling is an incredibly valuable tool to share data and information. To get the most impact from stories there are a number of key ingredients. These are based on science and human nature. Using these elements in a story you can deliver information impactfully, ensure action and drive change.
𝐔𝐧𝐯𝐞𝐢𝐥 𝐭𝐡𝐞 𝐅𝐮𝐭𝐮𝐫𝐞 𝐨𝐟 𝐄𝐧𝐞𝐫𝐠𝐲 𝐄𝐟𝐟𝐢𝐜𝐢𝐞𝐧𝐜𝐲 𝐰𝐢𝐭𝐡 𝐍𝐄𝐖𝐍𝐓𝐈𝐃𝐄’𝐬 𝐋𝐚𝐭𝐞𝐬𝐭 𝐎𝐟𝐟𝐞𝐫𝐢𝐧𝐠𝐬
Explore the details in our newly released product manual, which showcases NEWNTIDE's advanced heat pump technologies. Delve into our energy-efficient and eco-friendly solutions tailored for diverse global markets.
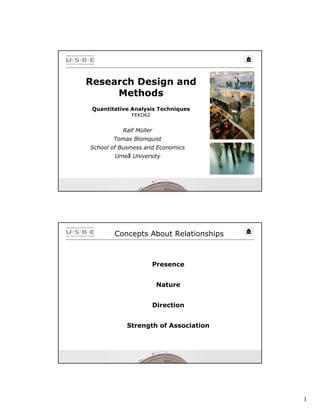
1. Research Design and
Methods
Quantitative Analysis Techniques
FEKD62
Ralf Müller
Tomas Blomquist
School of Business and Economics
Umeå University
Concepts About Relationships
Presence
Nature
Direction
Strength of Association
1
2. Relationship Presence
. . . . assesses whether a systematic
relationship exists between two or more
variables.
If we find statistical significance between
the variables we say a relationship is
present.
Nature of Relationships
Relationships between variables typically are described
as either linear or nonlinear.
•Linear relationship = a “straight line
-
association” between two or more variables.
•Nonlinear relationship = often referred to
as curvilinear, it is best described by a curve
instead of a straight line.
2
3. Direction of Relationship
The direction of a relationship can be either
positive or negative.
Positive relationship = when one variable
increases, e.g., loyalty to employer, then so
does another related one, e.g. effort put
forth for employer.
Negative relationship = when one variable
increases, e.g., satisfaction with job, then a
related one decreases, e.g. likelihood of
searching for another job.
Strength of Association
When a consistent and systematic
relationship is present, the researcher
must determine the strength of
association.
The strength ranges from very strong to
slight.
3
4. Covariation
. . . . exists when one variable
consistently and systematically changes
relative to another variable.
The correlation coefficient is used to
assess this linkage.
Correlation Coefficients
Positive Correlation = when the value of X increases,
+ 1.0
the value of Y also increases. When the value of X
decreases, the value of Y also decreases.
0.0 Zero Correlation = the value of Y does not increase or
decrease with the value of X.
Negative Correlation = when the value of X increases,
- 1.0
the value of Y decreases. When the value of X
decreases, the value of Y increases.
4
5. Rules of Thumb about Correlation Coefficient Size
Coefficient Strength of
Range Association
+/– .91 to +/– 1.00 Very Strong
+/– .71 to +/– .90 High
+/– .41 to +/– .70 Moderate
+/– .21 to +/– .40 Small
+/– .01 to +/– .20 Slight
Pearson Correlation
The Pearson correlation coefficient
measures the linear association between
two metric variables.
It ranges from – 1.00 to + 1.00, with zero
representing absolutely no association.
The larger the coefficient the stronger the
linkage and the smaller the coefficient the
weaker the relationship.
5
6. Coefficient of Determination
The coefficient of determination is the
square of the correlation coefficient, or r2.
It ranges from 0.00 to 1.00 and is the
amount of variation in one variable
explained by one or more other variables.
6
7. Definitions of Statistical Techniques
ANOVA (analysis of variance) is used to examine statistical
differences between the means of two or more groups. The
dependent variable is metric and the independent variable(s) is
nonmetric. One-way ANOVA has a single nonmetric independent
variable and two-way ANOVA can have two or more nonmetric
independent variables.
Cluster analysis enables researchers to place objects (e.g.,
customers, brands, products) into groups so that objects within the
groups are similar to each other. At the same time, objects in any
particular group are different from objects in all other groups.
Conjoint analysis enables researchers to determine the preferences
individuals have for various products and services, and which
product features are valued the most.
Definitions of Statistical Techniques
Discriminant analysis enables the researcher to predict group
membership using two or more metric dependent variables. The
group membership variable is a nonmetric dependent variable.
Factor analysis is used to summarize the information from a large
number of variables into a much smaller number of variables or
factors. This technique is used to combine variables whereas
cluster analysis is used to identify groups with similar
characteristics.
Logistic regression is a special type of regression that can have a
non-metric/categorical dependent variable.
Multiple regression has a single metric dependent variable and
several metric independent variables.
7
8. Calculating the “Explained” and
“Unexplained” Variance in Regression
The explained variance in regression, referred to
as r2, is calculated by dividing the regression
sum of squares by the total sum of squares.
The unexplained variance in regression, referred to
as residual variance, is calculated by dividing the
residual sum of squares by the total sum of
squares.
How to calculate the t-value?
The t-value is calculated by dividing the
regression coefficient by its standard
error.
8
9. How to interpret the regression coefficient
The regression coefficient of .459 for Samouel’s
X1– Food Quality reported in Exhibit 11-11 is
interpreted
as follows: “ . . . for every unit that X1 increases, X17
will increase by .459 units.” Recall that in this
example
X1 is the independent (predictor) variable and X17 is
the
dependent variable.
Dummy Variable
. . . . an independent variable that has two
(or more) distinct levels, which are coded 0
and 1.
9
10. Regression Analysis Terms
Explained variance = R2.
Unexplained variance or error =
residuals.
Regression Assumptions
The error variance is constant over all
values of the independent variables;
The errors are uncorrelated with each of
the independent variables; and
The errors are normally distributed.
10
11. Residuals Plots
Plot of standardized residuals – enables you to
determine if the errors are normally distributed
Normal probability plot – enables you to determine if
the errors are normally distributed. It compares the
observed standardized residuals against the expected
standardized residuals from a normal distribution
Plot of standardized residuals – can be used to identify
outliers. It compares the standardized predicted values
of the dependent variable against the standardized
residuals from the regression equation.
Exhibit A-5 Histogram of
Employee Survey Dependent
Variable X15 – Proud
Histogram
Dependent Variable: X15 -- Proud
10
8
6
4
Frequency
Std. Dev = .97
2
Mean = 0.00
N = 63.00
0
-1.75 -1.25 -.75 -.25 .25 .75 1.25 1.75 2.25
-1.50 -1.00 -.50 0.00 .50 1.00 1.50 2.00
Regression Standardized Residual
11
12. Normal Probability Plot of
Regression Standardized Residuals
Normal P-P Plot of Regression Standardized Residual
Dependent Variable: X15 -- Proud
1.00
.75
Expected Cum Prob
.50
.25
0.00
0.00 .25 .50 .75 1.00
Observed Cum Prob
Scatterplot
Scatterplot
Dependent Variable: X15 -- Proud
Regression Standardized Predicted Value
3
2
1
0
-1
-2
-2 -1 0 1 2 3
Regression Standardized Residual
12
13. Example: Communication Research
Appropriate Formal
Situational Variables
Communication Variables
Organisation Structure
H2 (+) Communication Frequency
Level of organic
Daily, (bi)-weekly,
organisation structure
monthly, at milestone,
phase end, project end
H3
Research Model (+)
H
H4
(-)
)
Methodology Clearness
H6 (+)
Communication Media
Richness
Written,
verbal,
face-to-face
)
H5 (-
Objective Clearness
Relational Norms Communication Contents
Status, changes, issues,
Flexibility, next steps, analysis,
information exchange, measures
solidarity
H2 to H5: Hypothesized relationships
Exploratory investigation
Example: Communication Research
Standard
Deviation
Questionnaire Item(s) Mean
Variable (from Appendix A-3) (SD)
Project Variables
Respondents Role 1 N/A N/A
Project Type 2, 3 N/A N/A
Objective Clearness 4, 5, 6 5.39 (1.15)
Methodology Clearness 7, 8, 9 5.05 (1.32)
Summary statistics Relational Norms 10, 11, 12, 13, 14, 15, 16, 17, 18, 19 5.45 (0.90)
Organisation Structure 68, 69, 70, 71, 72, 73, 74 4.58 (1.05)
Project Performance 65, 66, 67 5.69 (0.96)
Communication Media
Importance of Written Communication 20 6.34 (0.97)
Importance of Verbal Communication 21 6.19 (0.96)
Importance Personal Communication 22 6.21 (1.04)
Communication Frequency
Variable Interval Communication 27, 28, 33, 34, 35, 41, 42 2.83 (0.24)
Fixed Interval Communication 25, 26, 32, 33, 39, 40 3.32 (0.44)
Continuous Communication 23, 24, 30, 38 4.04 (0.79)
Communication Contents
Personal Review 58, 59, 60, 61, 62, 63, 64 5.23 (0.63)
Project Analysis 45, 48, 52, 55, 59, 62 4.40 (0.45)
Written Status 44, 46, 47, 49, 50, 57, 64 5.51 (0.91)
Verbal Update 51, 53, 54, 56 5.47 (0.16)
Demographic Variables
Age 80 42.2 (8.15)
Years of work experience 81 20.2 (8.87)
Years of experience in proj. mgmt. 82 10.3 (6.47)
Years as sponsor 83 5.9 (5.19)
13
14. Example: Communication Research
Frequency Factors
Variable Interval Fixed Interval Continuous
Final Factor Names:
Communication Communication Communication
Factor Eigenvalue 5.760 2.277 1.728
% Variance Explained 29.684 18.309 13.040
Analysis Factor Loading
Variable/Item
Frequency in Communication
Written daily communication 0.007 -0.273 0.583
Written weekly communication -0.077 -0.014 0.688
Written bi-weekly communication -0.087 -0.042
0.803
Written monthly communication 0.349 -0.243
0.641
Written communication at milestone achievement 0.121 -0.186
0.808
Written communication at phase or project end 0.074 -0.117
0.826
No formal written communication*
Verbal daily communication -0.060 -0.107 0.766
Verbal weekly communication**
Verbal bi-weekly communication 0.229 -0.242
0.781
Verbal monthly communication -0.273
0.485 0.570
Verbal communication at milestone achievement 0.196 -0.131
0.847
Verbal communication at phase or project end 0.090 -0.120
0.849
No formal Verbal communication*
Personal daily communication**
Personal weekly communication -0.214 0.146 0.563
Personal bi-weekly communication -0.070 0.309
0.668
Personal monthly communication 0.342 -0.011
0.549
Personal communication at milestone achievement 0.115 0.007
0.821
Personal communication at phase or project end 0.066 -0.027
0.841
No formal Personal communication*
* Items not included because of low preference
** Items dropped because of low MSA or Alpha
Example: Communication Research
Contents Factors
Written status
Personal Project report with Verbal
Final Factor Names:
Factor Analysis Review Analysis possible follow- Update
up
Eigenvalue 5.136 2.487 2.091 1.963
% Variance Explained 15.396 13.999 13.812 12.392
Factor Loading
Variable/Item
Contents in Communication
Written contents: status and achievements 0.036 0.151 0.151
0.489
Written contents: measures and quality metrics -0.078 0.356 -0.171
0.673
Written contents: issues or 'open items' -0.004 0.044 0.212
0.628
Written contents: project changes -0.027 0.186 0.177
0.598
Written contents: trends 0.156 0.364 -0.108
0.663
Written contents: next steps 0.137 -0.095 0.112
0.611
Written contents: other 0.217 0.139 -0.269
0.554
Verbal contents: status and achievements 0.025 0.154 -0.093 0.740
Verbal contents: measures and quality metrics -0.029 0.027 0.353
0.741
Verbal contents: issues or 'open items' 0.150 -0.051 0.154 0.747
Verbal contents: project changes 0.053 0.069 0.115 0.808
Verbal contents: trends 0.047 0.109 0.194
0.759
Verbal contents: next steps 0.301 -0.034 0.350 0.481
Verbal contents: other 0.129 0.137 -0.093
0.548
Personal contents: status and achievements 0.060 -0.114 0.184
0.762
Personal contents: measures and quality metrics -0.104 -0.016
0.560 0.590
Personal contents: issues or 'open items' 0.006 0.272 0.088
0.711
Personal contents: project changes 0.085 0.106 0.304
0.727
Personal contents: trends 0.000 -0.096
0.540 0.624
Personal contents: next steps 0.012 0.367 -0.059
0.750
Personal contents: other 0.186 -0.263
0.465 0.495
14
15. Example: Communication Research
Appropriate Formal
Situational Variables
Communication Variables
Organisation Structure
Level of organic
organisation structure
Communication
H2
(+)
Frequency
Variable Intervals
---
Fixed Intervals
---
Continuous
Methodology Clearness
Revised Research Model
H3
(-)
)
,H
H
6( Communication
+)
4
4(
Contents and Media
Objective Clearness
-)
Personal Review
H5
(+) ---
Project Analysis
---
Written Status
Relational Norms ---
Verbal Update
Flexibility,
information exchange,
solidarity
H2 to H6: Hypothesized relationships
Exploratory investigation
Example: Communication Research
Normal distribution 40
30
of dependent variables 30
20
20
10
10
Std. Dev = 1.00
Std. Dev = 1.00 Mean = 0.00
Mean = 0.00 N = 200.00
0
N = 200.00
0 -1.50 -.50 .50 1.50 2.50
-1.00 0.00 1.00 2.00
-2
-2
-1
-1
-.7
-.2
.2
.7
1.2
1.7
2.2
5
5
.7
.2
.7
.2
5
5
5
5
5
5
5
5
5
Variable Interval Communication
Continuous Communication
30
30 30
20
20 20
10
10 10
Std. Dev = 1.00
Std. Dev = 1.00
Std. Dev = 1.00
Mean = 0.00
Mean = 0.00
Mean = 0.00
N = 200.00
0
N = 200.00
0 N = 200.00
0
-2
-1
-1
-.5
0.0
.5
1.0
1.5
2.0
2.5
0
.0
.5
.0
0
-3
-3
-2
-2
-1
-1
-.5
0.0
.5
1.0
1.5
2.0
0
0
0
0
0
0
0
0
0
.5
.0
.5
.0
.5
.0
-3
-3
-2
-2
-1
-1
-.7
-.2
.2
.7
1.2
1.7
0
0
0
0
0
0
0
0
0
0
0
5
5
.7
.2
.7
.2
.7
.2
5
5
5
5
5
5
5
5
5
5
Fixed Interval Communication
Project Analysis Personal Reviews
15