Downloaded 67 times


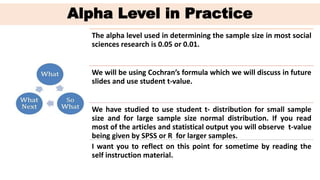
![Categorical Data
The sample size formulas for categorical
data is similar but not identical
•N =
[𝒕 𝟐
∗ 𝒑.𝒒 ]
𝒅 𝟐 = [1.962∗(0.5)(0.5)/(0.052 )] = 384
Units](https://image.slidesharecdn.com/lecture4-samplesizedetermination-200228174716/85/Sample-Size-Determination-28-320.jpg)


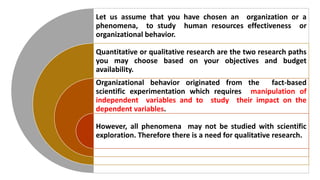
The document discusses the critical importance of sample size determination in both quantitative and qualitative research within the context of organizational behavior and human resources effectiveness. It highlights the process, challenges, and statistical principles involved in selecting an appropriate sample size to minimize sampling error, alongside considerations of alpha and beta errors. Additionally, it presents methodologies for calculating sample size based on various variables, illustrating the need for careful planning and analysis in research design.


![The Crooked Timber of New India [Autosaved].pptx](https://cdn.slidesharecdn.com/ss_thumbnails/thecrookedtimberofnewindiaautosaved-240302045121-e57b6550-thumbnail.jpg?width=640&height=640&fit=bounds)


![Hacking-Uncovered-How-People-Get-Hacked-and-How-to-Stay-Safe[1].pptx](https://cdn.slidesharecdn.com/ss_thumbnails/hacking-uncovered-how-people-get-hacked-and-how-to-stay-safe1-260130170011-4883a9c7-thumbnail.jpg?width=640&height=640&fit=bounds)


![제 23회 보아즈(BOAZ) 빅데이터 컨퍼런스 - [MBOAX] : ABSA를 활용한 소비자 반응 분석 기반 운영 효율화 대시보드 설계](https://cdn.slidesharecdn.com/ss_thumbnails/3-1boaz23rdconferencemboax-260203102709-9d519923-thumbnail.jpg?width=640&height=640&fit=bounds)


![7.__Developing_a_Research_Proposal[1].pptx](https://cdn.slidesharecdn.com/ss_thumbnails/7-260131073037-df92dd7d-thumbnail.jpg?width=640&height=640&fit=bounds)
