Good Morning! 
 
Prepared by: 
Aljon A. Casupanan 
(BSEd III – Compassion)
Today’s Lesson: 
Z Test 
(Two Sample Mean 
Test)
Z Test (Two Sample Mean Test) 
Z test can be used in: 
• Education 
• Business 
• Engineering
We need to: 
• Accept Ho and Reject Ha when: 
the p value is greater than the level of 
significance. 
(p value > 휶) 
• Accept Ha and Reject Ho when: 
the p value is less than the level of significance. 
(p value < 휶)
When do we use Z Test (Two 
Sample Mean)? 
When two separate samples are drawn 
at random. 
When testing whether the two 
samples are taken from a single 
population.
When do we use Z Test (Two 
Sample Mean)? 
It is necessary that the sample must 
be independent.
Steps In Hypothesis Testing (Z 
Test Two Sample Mean Test) 
Step 1:State the null and alternative 
hypotheses 
Step 2: Identify or select the level of 
significance and the p - value 
Step 3: Compute the test statistic 
Step 4: Decision,whether to accept the null 
hypothesis (Ho) and reject alternative 
hypothesis (Ha) or vice versa 
Step 5: State the conclusion.
Formula in Computing the Test Statistic 
Using Z Test (Two Sample Mean Test) 
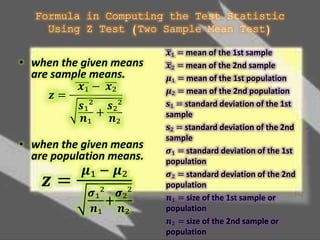
• when the given means 
are sample means. 
풛 = 
풙₁ − 풙₂ 
풔₁² 
+ 
풏₁ 
풔₂² 
풏₂ 
• when the given means 
are population means. 
풛 = 
흁₁ − 흁₂ 
흈₁² 
+ 
풏₁ 
흈₂² 
풏₂ 
풙₁ = mean of the 1st sample 
풙₂ = mean of the 2nd sample 
흁₁ = mean of the 1st population 
흁₂ = mean of the 2nd population 
퐬₁ = standard deviation of the 1st 
sample 
퐬₂ = standard deviation of the 2nd 
sample 
흈₁ = standard deviation of the 1st 
population 
흈₂ = standard deviation of the 2nd 
population 
풏₁ = size of the 1st sample or 
population 
풏₂ = size of the 2nd sample or 
population
We need to: 
• Accept Ho and Reject Ha when: 
the p value is greater than the level of 
significance. 
(p value > 휶) 
• Accept Ha and Reject Ho when: 
the p value is less than the level of significance. 
(p value < 휶)
Problem 1: 
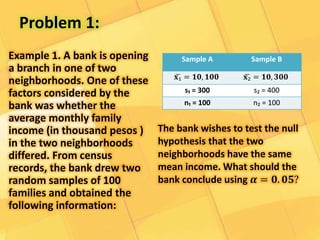
Example 1. A bank is opening 
a branch in one of two 
neighborhoods. One of these 
factors considered by the 
bank was whether the 
average monthly family 
income (in thousand pesos ) 
in the two neighborhoods 
differed. From census 
records, the bank drew two 
random samples of 100 
families and obtained the 
following information: 
Sample A Sample B 
퐱 ₁ = ퟏퟎ, ퟏퟎퟎ 퐱 ₂ = ퟏퟎ, ퟑퟎퟎ 
s₁ = 300 s₂ = 400 
n₁ = 100 n₂ = 100 
The bank wishes to test the null 
hypothesis that the two 
neighborhoods have the same 
mean income. What should the 
bank conclude using 휶 = ퟎ. ퟎퟓ?
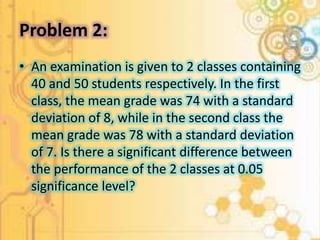
Problem 2: 
• An examination is given to 2 classes containing 
40 and 50 students respectively. In the first 
class, the mean grade was 74 with a standard 
deviation of 8, while in the second class the 
mean grade was 78 with a standard deviation 
of 7. Is there a significant difference between 
the performance of the 2 classes at 0.05 
significance level?
QUIZ #2
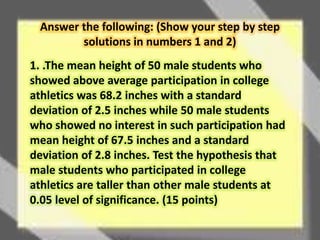
Answer the following: (Show your step by step 
solutions in numbers 1 and 2) 
1. .The mean height of 50 male students who 
showed above average participation in college 
athletics was 68.2 inches with a standard 
deviation of 2.5 inches while 50 male students 
who showed no interest in such participation had 
mean height of 67.5 inches and a standard 
deviation of 2.8 inches. Test the hypothesis that 
male students who participated in college 
athletics are taller than other male students at 
0.05 level of significance. (15 points)
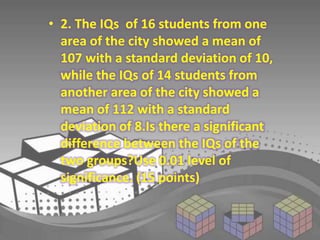
• 2. The IQs of 16 students from one 
area of the city showed a mean of 
107 with a standard deviation of 10, 
while the IQs of 14 students from 
another area of the city showed a 
mean of 112 with a standard 
deviation of 8.Is there a significant 
difference between the IQs of the 
two groups?Use 0.01 level of 
significance. (15 points)
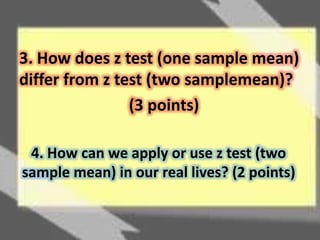
3. How does z test (one sample mean) 
differ from z test (two samplemean)? 
(3 points) 
4. How can we apply or use z test (two 
sample mean) in our real lives? (2 points)
z-test