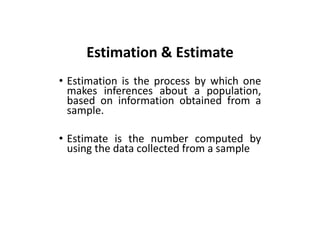
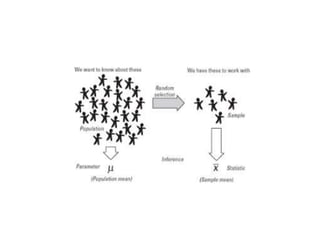
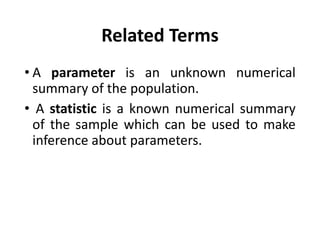
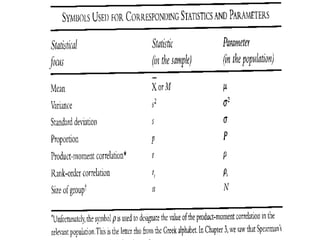
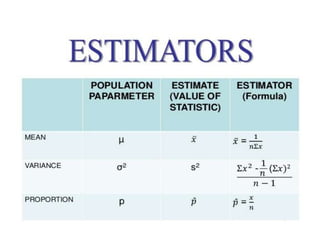
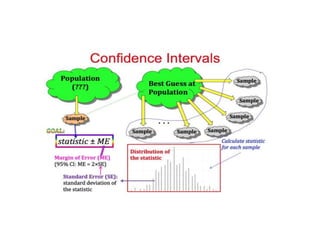
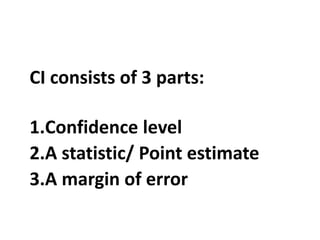
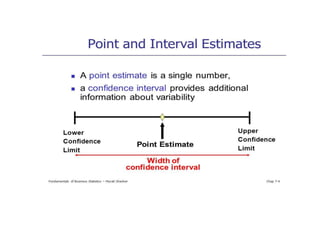
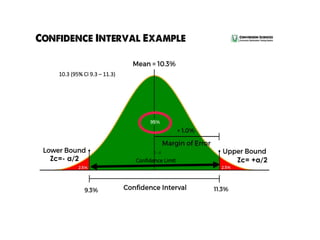
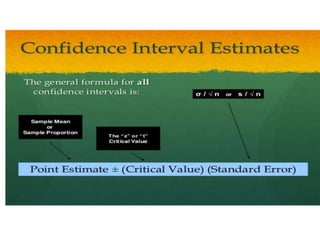
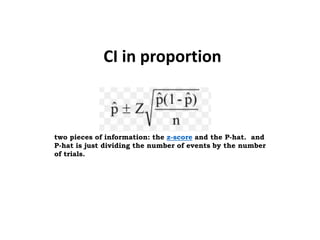
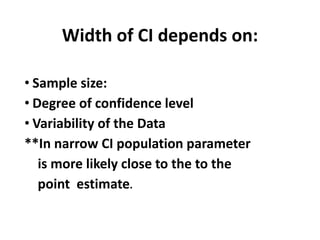
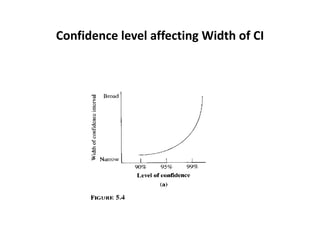
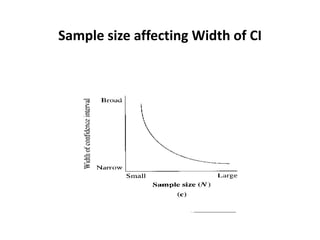
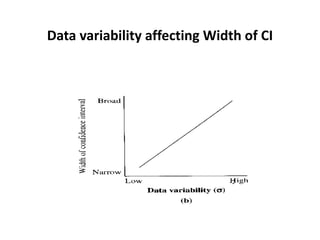
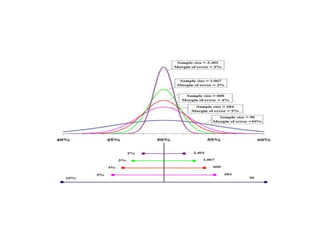
SlideShare a Scribd company logo
1 of 46
Estimation
&
Estimate
Dr. Rasheda Samad
Professor of Pediatrics
Types Of Statistics
• Descriptive: summarization of data.
• Inferential: to generalize the
findings to a larger population from
the sample collected.
Inferential Statistics
Two ways of inference:
•Hypothesis testing
•Estimation
Estimation & Estimate
• Estimation is the process by which one
makes inferences about a population,
based on information obtained from a
sample.
• Estimate is the number computed by
using the data collected from a sample
Estimator
• An estimator is a statistic that estimates some fact
about the population.
• Estimator creates an estimate e,g, sample mean (x̄) is
an estimator for the population mean, μ.
• Estimator is the tool & estimate is the product.
Objective of the Estimate
• To determine the approximate value of
population parameter on the basis of
sample statistic
Properties of a good
estimator:
• Unbiased: parameter & statistics same
• Efficiency: small variance
i, e, precise
• Consistency:
• Sufficiency:
Basic Terminology
• Population: is the collection of all
individuals or items under
consideration in a statistical study.
• Sample: is that part of the population
from which information is collected.
Related Terms
• A parameter is an unknown numerical
summary of the population.
• A statistic is a known numerical summary
of the sample which can be used to make
inference about parameters.
Types of Estimate
1. Point Estimate:
• A single value estimate for
a population parameter.
e,g, Mean, proportion, OR, RR.
2. Interval estimate:
( Confidence Interval)
Point Estimate
• Calculated from random variables
• Vary from study to study
• Importance of point estimates lies in fact that
many statistical formulas based on them.
Confidence Interval
(CI)
•Interval around point estimate
with upper & lower limits
expected to contain unknown
the population parameter with
certain degree of confidence.
•This degree of confidence is
the – confidence level e,g,
95% CI, 99% CI.
•Upper & lower limits are -
confidence limit.
CI consists of 3 parts:
1.Confidence level
2.A statistic/ Point estimate
3.A margin of error
Confidence Limit
10.3 (95% CI 9.3 – 11.3)
1- α
Central Limit Theorem
& Law of Large Number
States when SS is large >30
• Is normally distributed.
• Has a mean equal to the
population mean.
Rule of Normal
Distribution Curve
• All of the data will fall within three SD of the mean.
It has three parts:
• 68% of data falls within the 1 SD.
• 95% fall within 2 SD.
• 99.7% fall within 3 SD.
• The rule is also called the 68-95-99.7
• Rule or the Three Sigma Rule.
95% CI
Definition 1:
95% sure that the true mean (μ) will fall
within the upper and lower bounds.
Definition 2:
95% of the intervals constructed using
sample means ( x ) will contain the true
mean ( μ ).
When to use t statistic
•When sample size is small
•Popular standard deviation not
known.
CI in proportion
two pieces of information: the z-score and the P-hat. and
P-hat is just dividing the number of events by the number
of trials.
Calculation for SD
Width of CI depends on:
• Sample size:
• Degree of confidence level
• Variability of the Data
**In narrow CI population parameter
is more likely close to the to the
point estimate.
Confidence level affecting Width of CI
Sample size affecting Width of CI
Data variability affecting Width of CI
Why CI important in modern
research?
• For decades researchers relied on the p-value
• Calculating a CI became a mandatory pre-requisite
in modern research
• Many international journals do not accept
manuscripts for publication if testing is only based
only on the p-value, why?
• CI provides magnitude of the effect.
P value vs CI
• CI along with p value is pre-requite for publication.
• P value only shows significance not quantifies the
strength or weakness
• As such, p-value is NOT the probability of making a
type I error. does NOT indicate the size or
importance of the observed effect.
CI for null Hypothesis
• If CI calculated for effect & outcome & if CI
include null value zero then H0 accepted if not
H0 rejected.
• 95% CI range is 1.16 - 6.84 so H0 rejected &
result significant.
• 95% CI range is -0.15 to 2.85 so H0 accepted &
not significant
• At the same time provide effect size & clinical
significance of the result.
CI for Risk Ratio RR
Risk of outcome in exposed
• RR= ---------------------------------------------
Risk of outcome in unexposed
Risk of lung cancer in smokers
• RR= ---------------------------------------------
Risk of lung cancer in nonsmokers
• RR = 1 means exposure is not a risk,
• If CI includes Ho value 1 then no effect & same
interpretation for OR.
Relation Of CI & p value
• Complementary to each other.
In Hypothesis testing:
• When null hypothesis accepted CI contains null
value 0 & p is >0.05&
• When not include null value p value is <0.05 &
null hypothesis is rejected & result is significant.
• Similarly when CI include 1 in ratio then p is
>0.05 result is not significant.
• Similarly when CI not include 1 in ratio then p is
<0.05 result is significant.
Problems with the CI
It has inherited two important
pitfalls:
• First, always a 5% risk to assume a
significant difference when actually no
difference exists (Type I error).
• Second, as it measures the effect of
chance; statistically significant does not
mean clinically significant.
Summary
• CI is essential for all the values like, mean, proportion,
OR, RR etc.
• Confidence level i.e. 95% CI expresses degree of
uncertainty.
• Margin of error indicates precision.
• Narrow CI is desirable.
• P value & CI are complementary to each other in
significance test
• CI provides magnitude & effect size to have decision
making for clinical significance.
Estimation &amp; estimate Prof.  rasheda samad,

More Related Content

What's hot

1 statistical analysis notes
1 statistical analysis notes1 statistical analysis notes
1 statistical analysis notes
cartlidge
 
Statistical Analysis for Educational Outcomes Measurement in CME
Statistical Analysis for Educational Outcomes Measurement in CMEStatistical Analysis for Educational Outcomes Measurement in CME
Statistical Analysis for Educational Outcomes Measurement in CME
D. Warnick Consulting
 
Experimental designs and data analysis in the field of Agronomy science by ma...
Experimental designs and data analysis in the field of Agronomy science by ma...Experimental designs and data analysis in the field of Agronomy science by ma...
Experimental designs and data analysis in the field of Agronomy science by ma...
Manoj Sharma
 
Standard error of measurement
Standard error of measurementStandard error of measurement
Standard error of measurement
tlcoffman
 

What's hot (20)

1 statistical analysis notes
1 statistical analysis notes1 statistical analysis notes
1 statistical analysis notes
 
Estimating a Population Proportion
Estimating a Population Proportion  Estimating a Population Proportion
Estimating a Population Proportion
 
2 statistics, measurement, graphical techniques
2 statistics, measurement, graphical techniques2 statistics, measurement, graphical techniques
2 statistics, measurement, graphical techniques
 
Topic 1: Statistical Analysis
Topic 1: Statistical AnalysisTopic 1: Statistical Analysis
Topic 1: Statistical Analysis
 
Variable inferential statistics
Variable inferential statisticsVariable inferential statistics
Variable inferential statistics
 
Data Analysis: Descriptive Statistics
Data Analysis: Descriptive StatisticsData Analysis: Descriptive Statistics
Data Analysis: Descriptive Statistics
 
Major types of statistics terms that you should know
Major types of statistics terms that you should knowMajor types of statistics terms that you should know
Major types of statistics terms that you should know
 
Sample Size Determination
Sample Size Determination Sample Size Determination
Sample Size Determination
 
Selection of appropriate data analysis technique
Selection of appropriate data analysis techniqueSelection of appropriate data analysis technique
Selection of appropriate data analysis technique
 
Topic 3 (Stats summary)
Topic 3 (Stats summary)Topic 3 (Stats summary)
Topic 3 (Stats summary)
 
3 survey, questionaire, graphic techniques
3 survey, questionaire, graphic techniques3 survey, questionaire, graphic techniques
3 survey, questionaire, graphic techniques
 
1 introduction
1 introduction1 introduction
1 introduction
 
Statistical Analysis for Educational Outcomes Measurement in CME
Statistical Analysis for Educational Outcomes Measurement in CMEStatistical Analysis for Educational Outcomes Measurement in CME
Statistical Analysis for Educational Outcomes Measurement in CME
 
Testing of hypothesis
Testing of hypothesisTesting of hypothesis
Testing of hypothesis
 
Data analysis
Data analysisData analysis
Data analysis
 
Mba ii rm unit-4.1 data analysis & presentation a
Mba ii rm unit-4.1 data analysis & presentation aMba ii rm unit-4.1 data analysis & presentation a
Mba ii rm unit-4.1 data analysis & presentation a
 
Experimental designs and data analysis in the field of Agronomy science by ma...
Experimental designs and data analysis in the field of Agronomy science by ma...Experimental designs and data analysis in the field of Agronomy science by ma...
Experimental designs and data analysis in the field of Agronomy science by ma...
 
Statistics for Business Decision-making
Statistics for Business Decision-makingStatistics for Business Decision-making
Statistics for Business Decision-making
 
statistical analysis of questionnaires
statistical analysis of questionnairesstatistical analysis of questionnaires
statistical analysis of questionnaires
 
Standard error of measurement
Standard error of measurementStandard error of measurement
Standard error of measurement
 

Similar to Estimation &amp; estimate Prof. rasheda samad,

2_Lecture 2_Confidence_Interval_3.pdf
2_Lecture 2_Confidence_Interval_3.pdf2_Lecture 2_Confidence_Interval_3.pdf
2_Lecture 2_Confidence_Interval_3.pdf
CHANSreyya1
 
samplesizedetermination-221008120007-0081a5b4.ppt
samplesizedetermination-221008120007-0081a5b4.pptsamplesizedetermination-221008120007-0081a5b4.ppt
samplesizedetermination-221008120007-0081a5b4.ppt
mekuriatadesse
 

Similar to Estimation &amp; estimate Prof. rasheda samad, (20)

Sample size determination
Sample size determinationSample size determination
Sample size determination
 
GROUP 1 biostatistics ,sample size and epid.pptx
GROUP 1 biostatistics ,sample size and epid.pptxGROUP 1 biostatistics ,sample size and epid.pptx
GROUP 1 biostatistics ,sample size and epid.pptx
 
Basic stat analysis using excel
Basic stat analysis using excelBasic stat analysis using excel
Basic stat analysis using excel
 
2_Lecture 2_Confidence_Interval_3.pdf
2_Lecture 2_Confidence_Interval_3.pdf2_Lecture 2_Confidence_Interval_3.pdf
2_Lecture 2_Confidence_Interval_3.pdf
 
Estimation and hypothesis
Estimation and hypothesisEstimation and hypothesis
Estimation and hypothesis
 
Sample size calculation
Sample  size calculationSample  size calculation
Sample size calculation
 
Sample size calculations
Sample size calculationsSample size calculations
Sample size calculations
 
samplesizecalculations-1801190731542.ppt
samplesizecalculations-1801190731542.pptsamplesizecalculations-1801190731542.ppt
samplesizecalculations-1801190731542.ppt
 
To p or not to p
To p or not to pTo p or not to p
To p or not to p
 
presentation on calculation of sample size
presentation on calculation of sample sizepresentation on calculation of sample size
presentation on calculation of sample size
 
Biostatistics
BiostatisticsBiostatistics
Biostatistics
 
Confidence interva,P value,Type1-2 error.pptx
Confidence interva,P value,Type1-2 error.pptxConfidence interva,P value,Type1-2 error.pptx
Confidence interva,P value,Type1-2 error.pptx
 
ChandanChakrabarty_1.pdf
ChandanChakrabarty_1.pdfChandanChakrabarty_1.pdf
ChandanChakrabarty_1.pdf
 
Bio-Statistics in Bio-Medical research
Bio-Statistics in Bio-Medical researchBio-Statistics in Bio-Medical research
Bio-Statistics in Bio-Medical research
 
SAMPLE SIZE DETERMINATION.ppt
SAMPLE SIZE DETERMINATION.pptSAMPLE SIZE DETERMINATION.ppt
SAMPLE SIZE DETERMINATION.ppt
 
samplesizedetermination-221008120007-0081a5b4.ppt
samplesizedetermination-221008120007-0081a5b4.pptsamplesizedetermination-221008120007-0081a5b4.ppt
samplesizedetermination-221008120007-0081a5b4.ppt
 
SAMPLE SIZE CALCULATION IN DIFFERENT STUDY DESIGNS AT.pptx
SAMPLE SIZE CALCULATION IN DIFFERENT STUDY DESIGNS AT.pptxSAMPLE SIZE CALCULATION IN DIFFERENT STUDY DESIGNS AT.pptx
SAMPLE SIZE CALCULATION IN DIFFERENT STUDY DESIGNS AT.pptx
 
Parametric tests
Parametric testsParametric tests
Parametric tests
 
Sample Size Determination
Sample Size DeterminationSample Size Determination
Sample Size Determination
 
How to do the maths
How to do the mathsHow to do the maths
How to do the maths
 

Recently uploaded

Call Girl In Pune 👉 Just CALL ME: 9352988975 💋 Call Out Call Both With High p...
Call Girl In Pune 👉 Just CALL ME: 9352988975 💋 Call Out Call Both With High p...Call Girl In Pune 👉 Just CALL ME: 9352988975 💋 Call Out Call Both With High p...
Call Girl In Pune 👉 Just CALL ME: 9352988975 💋 Call Out Call Both With High p...
chetankumar9855
 
Call Girls in Gagan Vihar (delhi) call me [🔝 9953056974 🔝] escort service 24X7
Call Girls in Gagan Vihar (delhi) call me [🔝  9953056974 🔝] escort service 24X7Call Girls in Gagan Vihar (delhi) call me [🔝  9953056974 🔝] escort service 24X7
Call Girls in Gagan Vihar (delhi) call me [🔝 9953056974 🔝] escort service 24X7
9953056974 Low Rate Call Girls In Saket, Delhi NCR
 
Call Girl in Indore 8827247818 {LowPrice} ❤️ (ahana) Indore Call Girls * UPA...
Call Girl in Indore 8827247818 {LowPrice} ❤️ (ahana) Indore Call Girls  * UPA...Call Girl in Indore 8827247818 {LowPrice} ❤️ (ahana) Indore Call Girls  * UPA...
Call Girl in Indore 8827247818 {LowPrice} ❤️ (ahana) Indore Call Girls * UPA...
mahaiklolahd
 

Recently uploaded (20)

All Time Service Available Call Girls Marine Drive 📳 9820252231 For 18+ VIP C...
All Time Service Available Call Girls Marine Drive 📳 9820252231 For 18+ VIP C...All Time Service Available Call Girls Marine Drive 📳 9820252231 For 18+ VIP C...
All Time Service Available Call Girls Marine Drive 📳 9820252231 For 18+ VIP C...
 
Call Girl In Pune 👉 Just CALL ME: 9352988975 💋 Call Out Call Both With High p...
Call Girl In Pune 👉 Just CALL ME: 9352988975 💋 Call Out Call Both With High p...Call Girl In Pune 👉 Just CALL ME: 9352988975 💋 Call Out Call Both With High p...
Call Girl In Pune 👉 Just CALL ME: 9352988975 💋 Call Out Call Both With High p...
 
💕SONAM KUMAR💕Premium Call Girls Jaipur ↘️9257276172 ↙️One Night Stand With Lo...
💕SONAM KUMAR💕Premium Call Girls Jaipur ↘️9257276172 ↙️One Night Stand With Lo...💕SONAM KUMAR💕Premium Call Girls Jaipur ↘️9257276172 ↙️One Night Stand With Lo...
💕SONAM KUMAR💕Premium Call Girls Jaipur ↘️9257276172 ↙️One Night Stand With Lo...
 
Call Girls in Gagan Vihar (delhi) call me [🔝 9953056974 🔝] escort service 24X7
Call Girls in Gagan Vihar (delhi) call me [🔝  9953056974 🔝] escort service 24X7Call Girls in Gagan Vihar (delhi) call me [🔝  9953056974 🔝] escort service 24X7
Call Girls in Gagan Vihar (delhi) call me [🔝 9953056974 🔝] escort service 24X7
 
Manyata Tech Park ( Call Girls ) Bangalore ✔ 6297143586 ✔ Hot Model With Sexy...
Manyata Tech Park ( Call Girls ) Bangalore ✔ 6297143586 ✔ Hot Model With Sexy...Manyata Tech Park ( Call Girls ) Bangalore ✔ 6297143586 ✔ Hot Model With Sexy...
Manyata Tech Park ( Call Girls ) Bangalore ✔ 6297143586 ✔ Hot Model With Sexy...
 
Call Girls Hosur Just Call 9630942363 Top Class Call Girl Service Available
Call Girls Hosur Just Call 9630942363 Top Class Call Girl Service AvailableCall Girls Hosur Just Call 9630942363 Top Class Call Girl Service Available
Call Girls Hosur Just Call 9630942363 Top Class Call Girl Service Available
 
Call Girls Hyderabad Just Call 8250077686 Top Class Call Girl Service Available
Call Girls Hyderabad Just Call 8250077686 Top Class Call Girl Service AvailableCall Girls Hyderabad Just Call 8250077686 Top Class Call Girl Service Available
Call Girls Hyderabad Just Call 8250077686 Top Class Call Girl Service Available
 
Independent Call Girls Service Mohali Sector 116 | 6367187148 | Call Girl Ser...
Independent Call Girls Service Mohali Sector 116 | 6367187148 | Call Girl Ser...Independent Call Girls Service Mohali Sector 116 | 6367187148 | Call Girl Ser...
Independent Call Girls Service Mohali Sector 116 | 6367187148 | Call Girl Ser...
 
VIP Hyderabad Call Girls Bahadurpally 7877925207 ₹5000 To 25K With AC Room 💚😋
VIP Hyderabad Call Girls Bahadurpally 7877925207 ₹5000 To 25K With AC Room 💚😋VIP Hyderabad Call Girls Bahadurpally 7877925207 ₹5000 To 25K With AC Room 💚😋
VIP Hyderabad Call Girls Bahadurpally 7877925207 ₹5000 To 25K With AC Room 💚😋
 
Models Call Girls In Hyderabad 9630942363 Hyderabad Call Girl & Hyderabad Esc...
Models Call Girls In Hyderabad 9630942363 Hyderabad Call Girl & Hyderabad Esc...Models Call Girls In Hyderabad 9630942363 Hyderabad Call Girl & Hyderabad Esc...
Models Call Girls In Hyderabad 9630942363 Hyderabad Call Girl & Hyderabad Esc...
 
Low Rate Call Girls Bangalore {7304373326} ❤️VVIP NISHA Call Girls in Bangalo...
Low Rate Call Girls Bangalore {7304373326} ❤️VVIP NISHA Call Girls in Bangalo...Low Rate Call Girls Bangalore {7304373326} ❤️VVIP NISHA Call Girls in Bangalo...
Low Rate Call Girls Bangalore {7304373326} ❤️VVIP NISHA Call Girls in Bangalo...
 
Call Girls Kolkata Kalikapur 💯Call Us 🔝 8005736733 🔝 💃 Top Class Call Girl Se...
Call Girls Kolkata Kalikapur 💯Call Us 🔝 8005736733 🔝 💃 Top Class Call Girl Se...Call Girls Kolkata Kalikapur 💯Call Us 🔝 8005736733 🔝 💃 Top Class Call Girl Se...
Call Girls Kolkata Kalikapur 💯Call Us 🔝 8005736733 🔝 💃 Top Class Call Girl Se...
 
Call Girls Vasai Virar Just Call 9630942363 Top Class Call Girl Service Avail...
Call Girls Vasai Virar Just Call 9630942363 Top Class Call Girl Service Avail...Call Girls Vasai Virar Just Call 9630942363 Top Class Call Girl Service Avail...
Call Girls Vasai Virar Just Call 9630942363 Top Class Call Girl Service Avail...
 
Saket * Call Girls in Delhi - Phone 9711199012 Escorts Service at 6k to 50k a...
Saket * Call Girls in Delhi - Phone 9711199012 Escorts Service at 6k to 50k a...Saket * Call Girls in Delhi - Phone 9711199012 Escorts Service at 6k to 50k a...
Saket * Call Girls in Delhi - Phone 9711199012 Escorts Service at 6k to 50k a...
 
Russian Call Girls Service Jaipur {8445551418} ❤️PALLAVI VIP Jaipur Call Gir...
Russian Call Girls Service  Jaipur {8445551418} ❤️PALLAVI VIP Jaipur Call Gir...Russian Call Girls Service  Jaipur {8445551418} ❤️PALLAVI VIP Jaipur Call Gir...
Russian Call Girls Service Jaipur {8445551418} ❤️PALLAVI VIP Jaipur Call Gir...
 
Call Girls Service Jaipur {9521753030 } ❤️VVIP BHAWNA Call Girl in Jaipur Raj...
Call Girls Service Jaipur {9521753030 } ❤️VVIP BHAWNA Call Girl in Jaipur Raj...Call Girls Service Jaipur {9521753030 } ❤️VVIP BHAWNA Call Girl in Jaipur Raj...
Call Girls Service Jaipur {9521753030 } ❤️VVIP BHAWNA Call Girl in Jaipur Raj...
 
Top Rated Hyderabad Call Girls Erragadda ⟟ 9332606886 ⟟ Call Me For Genuine ...
Top Rated  Hyderabad Call Girls Erragadda ⟟ 9332606886 ⟟ Call Me For Genuine ...Top Rated  Hyderabad Call Girls Erragadda ⟟ 9332606886 ⟟ Call Me For Genuine ...
Top Rated Hyderabad Call Girls Erragadda ⟟ 9332606886 ⟟ Call Me For Genuine ...
 
Call Girl in Indore 8827247818 {LowPrice} ❤️ (ahana) Indore Call Girls * UPA...
Call Girl in Indore 8827247818 {LowPrice} ❤️ (ahana) Indore Call Girls  * UPA...Call Girl in Indore 8827247818 {LowPrice} ❤️ (ahana) Indore Call Girls  * UPA...
Call Girl in Indore 8827247818 {LowPrice} ❤️ (ahana) Indore Call Girls * UPA...
 
Best Rate (Patna ) Call Girls Patna ⟟ 8617370543 ⟟ High Class Call Girl In 5 ...
Best Rate (Patna ) Call Girls Patna ⟟ 8617370543 ⟟ High Class Call Girl In 5 ...Best Rate (Patna ) Call Girls Patna ⟟ 8617370543 ⟟ High Class Call Girl In 5 ...
Best Rate (Patna ) Call Girls Patna ⟟ 8617370543 ⟟ High Class Call Girl In 5 ...
 
Premium Call Girls In Jaipur {8445551418} ❤️VVIP SEEMA Call Girl in Jaipur Ra...
Premium Call Girls In Jaipur {8445551418} ❤️VVIP SEEMA Call Girl in Jaipur Ra...Premium Call Girls In Jaipur {8445551418} ❤️VVIP SEEMA Call Girl in Jaipur Ra...
Premium Call Girls In Jaipur {8445551418} ❤️VVIP SEEMA Call Girl in Jaipur Ra...
 

Estimation &amp; estimate Prof. rasheda samad,

  • 1.
  • 3. Types Of Statistics • Descriptive: summarization of data. • Inferential: to generalize the findings to a larger population from the sample collected.
  • 4.
  • 5. Inferential Statistics Two ways of inference: •Hypothesis testing •Estimation
  • 6. Estimation & Estimate • Estimation is the process by which one makes inferences about a population, based on information obtained from a sample. • Estimate is the number computed by using the data collected from a sample
  • 7. Estimator • An estimator is a statistic that estimates some fact about the population. • Estimator creates an estimate e,g, sample mean (x̄) is an estimator for the population mean, μ. • Estimator is the tool & estimate is the product.
  • 8. Objective of the Estimate • To determine the approximate value of population parameter on the basis of sample statistic
  • 9. Properties of a good estimator: • Unbiased: parameter & statistics same • Efficiency: small variance i, e, precise • Consistency: • Sufficiency:
  • 10. Basic Terminology • Population: is the collection of all individuals or items under consideration in a statistical study. • Sample: is that part of the population from which information is collected.
  • 11.
  • 12. Related Terms • A parameter is an unknown numerical summary of the population. • A statistic is a known numerical summary of the sample which can be used to make inference about parameters.
  • 13.
  • 14.
  • 15. Types of Estimate 1. Point Estimate: • A single value estimate for a population parameter. e,g, Mean, proportion, OR, RR. 2. Interval estimate: ( Confidence Interval)
  • 16. Point Estimate • Calculated from random variables • Vary from study to study • Importance of point estimates lies in fact that many statistical formulas based on them.
  • 17. Confidence Interval (CI) •Interval around point estimate with upper & lower limits expected to contain unknown the population parameter with certain degree of confidence.
  • 18. •This degree of confidence is the – confidence level e,g, 95% CI, 99% CI. •Upper & lower limits are - confidence limit.
  • 19.
  • 20. CI consists of 3 parts: 1.Confidence level 2.A statistic/ Point estimate 3.A margin of error
  • 21.
  • 22. Confidence Limit 10.3 (95% CI 9.3 – 11.3) 1- α
  • 23. Central Limit Theorem & Law of Large Number States when SS is large >30 • Is normally distributed. • Has a mean equal to the population mean.
  • 24. Rule of Normal Distribution Curve • All of the data will fall within three SD of the mean. It has three parts: • 68% of data falls within the 1 SD. • 95% fall within 2 SD. • 99.7% fall within 3 SD. • The rule is also called the 68-95-99.7 • Rule or the Three Sigma Rule.
  • 25. 95% CI Definition 1: 95% sure that the true mean (μ) will fall within the upper and lower bounds. Definition 2: 95% of the intervals constructed using sample means ( x ) will contain the true mean ( μ ).
  • 26.
  • 27.
  • 28. When to use t statistic •When sample size is small •Popular standard deviation not known.
  • 29.
  • 30.
  • 31. CI in proportion two pieces of information: the z-score and the P-hat. and P-hat is just dividing the number of events by the number of trials.
  • 33.
  • 34. Width of CI depends on: • Sample size: • Degree of confidence level • Variability of the Data **In narrow CI population parameter is more likely close to the to the point estimate.
  • 36. Sample size affecting Width of CI
  • 38.
  • 39. Why CI important in modern research? • For decades researchers relied on the p-value • Calculating a CI became a mandatory pre-requisite in modern research • Many international journals do not accept manuscripts for publication if testing is only based only on the p-value, why? • CI provides magnitude of the effect.
  • 40. P value vs CI • CI along with p value is pre-requite for publication. • P value only shows significance not quantifies the strength or weakness • As such, p-value is NOT the probability of making a type I error. does NOT indicate the size or importance of the observed effect.
  • 41. CI for null Hypothesis • If CI calculated for effect & outcome & if CI include null value zero then H0 accepted if not H0 rejected. • 95% CI range is 1.16 - 6.84 so H0 rejected & result significant. • 95% CI range is -0.15 to 2.85 so H0 accepted & not significant • At the same time provide effect size & clinical significance of the result.
  • 42. CI for Risk Ratio RR Risk of outcome in exposed • RR= --------------------------------------------- Risk of outcome in unexposed Risk of lung cancer in smokers • RR= --------------------------------------------- Risk of lung cancer in nonsmokers • RR = 1 means exposure is not a risk, • If CI includes Ho value 1 then no effect & same interpretation for OR.
  • 43. Relation Of CI & p value • Complementary to each other. In Hypothesis testing: • When null hypothesis accepted CI contains null value 0 & p is >0.05& • When not include null value p value is <0.05 & null hypothesis is rejected & result is significant. • Similarly when CI include 1 in ratio then p is >0.05 result is not significant. • Similarly when CI not include 1 in ratio then p is <0.05 result is significant.
  • 44. Problems with the CI It has inherited two important pitfalls: • First, always a 5% risk to assume a significant difference when actually no difference exists (Type I error). • Second, as it measures the effect of chance; statistically significant does not mean clinically significant.
  • 45. Summary • CI is essential for all the values like, mean, proportion, OR, RR etc. • Confidence level i.e. 95% CI expresses degree of uncertainty. • Margin of error indicates precision. • Narrow CI is desirable. • P value & CI are complementary to each other in significance test • CI provides magnitude & effect size to have decision making for clinical significance.

Editor's Notes

  1. appreciate evidence-based medicine are daunting to say the least, especially when confronted with the myriad of statistics in any paper.  healthcare students to the interpretation of some of the most commonly used statistics for reporting the results of medical research.
  2. It is the simple description of the findings ,  are used to describe the basic features of the data in a study.
  3. Summarize the data numerically and graphically using descriptive statistics and graphs, usually known as descriptive statistics. Together with simple graphics analysis,
  4. Make statements about some feature about the population (parameter) after analyzing the data, usually known as inferential statistics. Inference is the act of generalizing from the data (sample) to a larger phenomenon (Population) with calculated degree of certainity . Use a random sample to learn something about a larger population.
  5. Estimating population parameters from sample statistics is one of the major applications of inferential statistics. Major statistical method by which Sample statistics is used to estimate the corresponding population parameter
  6. Entire group of study subject is the population having common characteristics, information also termed as target population or reference population. It is rarely possible to study the whole of a population, but it is possible to take a subset of a population to study. A subset of a population is called a sample
  7. It is the summary value of population obtained by studying the whole population which is in real sense not practical so its representative value\ue can be obtained from its subset which is the sample and summary value of sample is the static obtained by calculation of data from sample, They are random & vary from sample to sample obtained from the same population even when sample size is equal.
  8. Population parameters are identified as greek letter and sample are by Roman letters.
  9. • sample proportion pˆ (“p hat”) is the point estimate of p sample mean x (“x bar”) is the point estimate of μ • sample standard deviation s is the point estimate of σ
  10. point estimate: Point estimate • Point estimates are single points that estimates parameter directly which serve as a "best guess" or "best estimate" of an unknown population parameter
  11. We study sample to get inference on population parameter. Sample statistics give us point estimate of population. What we get is unlikely to be true population value due to sampling variation range of value around point estimate is needed which likely to have the population parameter. This range is the cI. Calculation of CI takes only sampling variation & sampling error into account not the systematic error or bias. More the sample error less is the precision & vise versa. Sample statistics with high precision is more valid estimate of population parameter. So SE is the measure precision of sample statistics as an estimate of population parameter. SE is the estimate how much sample estimate deviate from population parameter. Sample statistics and SE used to calculate CI
  12. States when SS is large >30 Is normally distributed (regardless of the shape of the population from which the samples were drawn) Has a mean equal to the population mean, “mu” regardless of the shape or size of the population size of the sample Has a standard deviation--the standard error of the mean--equal to the population standard deviation divided by the square root of the sample size What is the difference between law of large numbers and central limit theorem? The Central limit Theorem states that when sample size tends to infinity, the sample mean will be normally distributed. The Law of Large Number states that when sample size tends to infinity, the sample mean equals to population mean
  13. The empirical rule states that for a normal distribution, nearly all of the data will fall within three standard deviations of the mean. The empirical rule can be broken down into three parts: 68% of data falls within the first standard deviation from the mean. 95% fall within two standard deviations. 99.7% fall within three standard deviations. The rule is also called the 68-95-99 7 Rule or the Three Sigma Rule.
  14. For decades researchers relied on the p-value to report whether this effect is true (significant) or just has happened by chance (insignificant). In the last decade, many international journals do not accept manuscripts for publication if testing for significance was based only on the p-value. Calculating a confidence interval (CI) for every variable measured became a mandatory pre-requisite in modern research. But why should researchers measure the confidence interval and what benefit do we get from the confidence interval over the p-value?
  15. Null hypothesis is no relation, no effect Null value is zero (H0= 0) If CI calculated for effect & outcome & if CI include null value zero then H0 accepted if not H0 rejected. At the same time provide effect size & clinical significance of the result. In general, a condence interval and hypothesis test have equivalent information, i.e., if the null value (value under H0) is in the condence interval, then the test will not reject (not signicant). If null value falls outside 95% CI then H0 is rejected.
  16. For difference measure null value undern………………………..mozammel 234 Odds ratio (OR) An odds ratio is a relative measure of effect, which allows the comparison of the intervention group of a study relative to the comparison or placebo group.   So when researchers calculate an odds ratio they do it like this: The numerator is the odds in the intervention arm The denominator is the odds in the control or placebo arm = Odds Ratio (OR) So if the outcome is the same in both groups the ratio will be 1, which implies there is no difference between the two arms of the study. However: If the OR is > 1 the control is better than the intervention. If the OR is < 1 the intervention is better than the control. Concept check 1 If the trial comparing SuperStatin to placebo with the outcome of all cause mortality found the following: Odds of all cause mortality for SuperStatin were 0.4 Odds of all cause mortality for placebo were 0.8 Odds ratio would equal 0.5 So if the trial comparing SuperStatin to placebo stated “OR 0.5” What would it mean? A.            The odds of death in the SuperStatin arm are 50% less than in the placebo arm. B.            There is no difference between groups C.            The odds of death in the placebo arm are 50% less than in the SuperStatin arm.