Downloaded 298 times


![12Slide
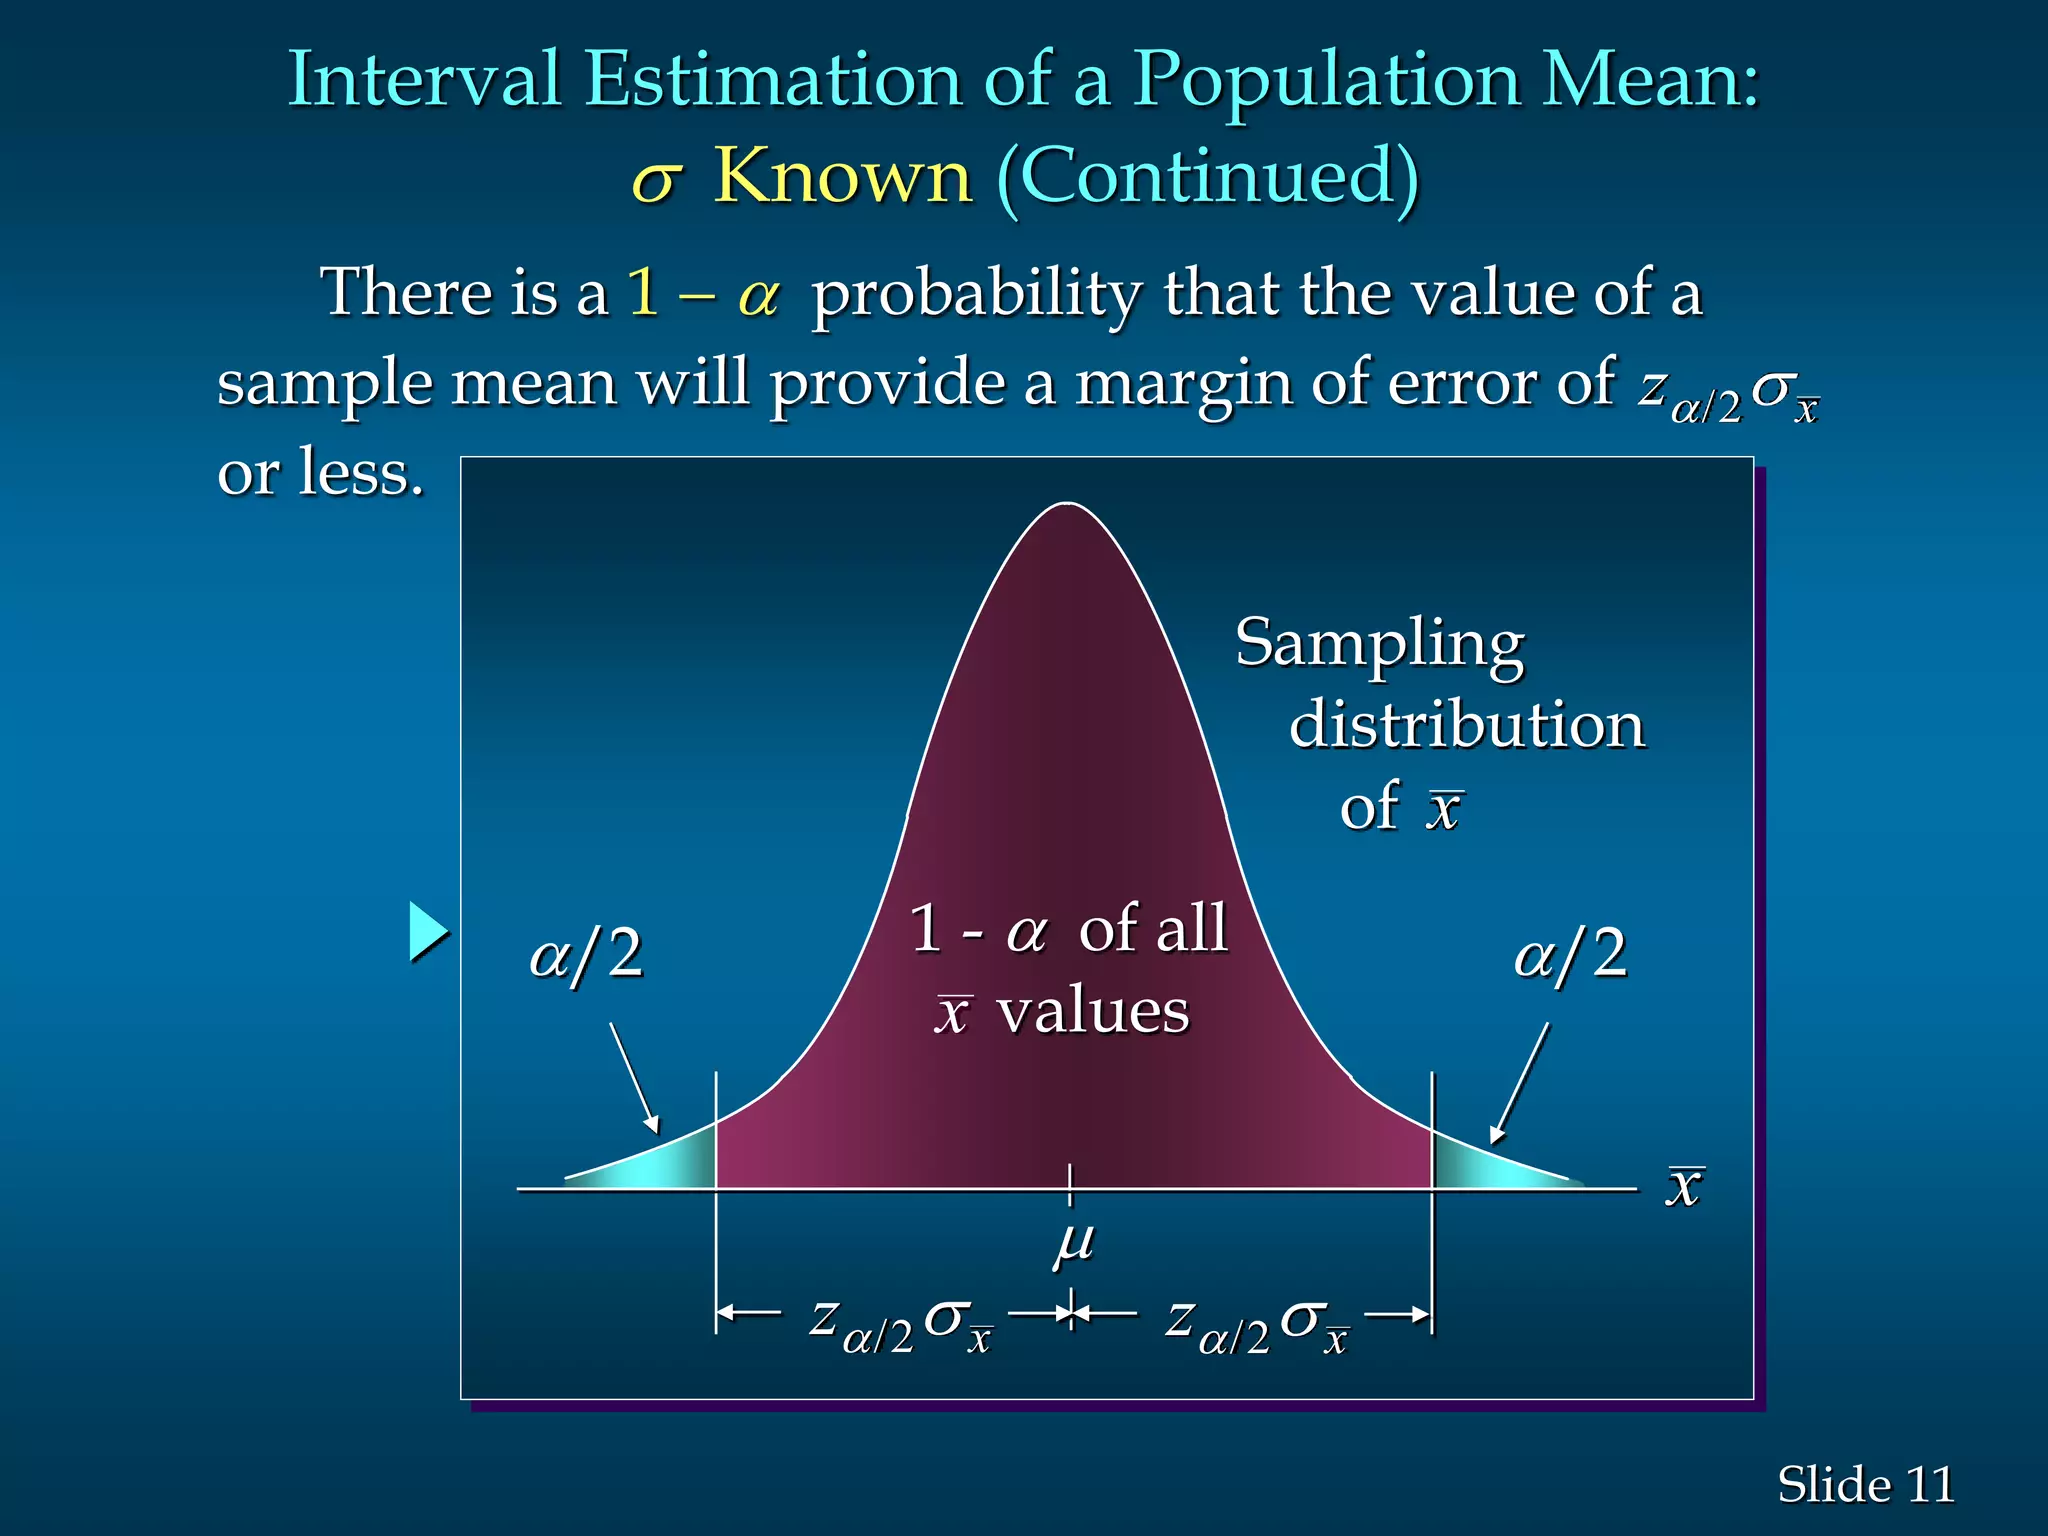
/2 /2
1 - of all
valuesx
Sampling
distribution
of x
x
z x s/2z x s/2
[------------------------- -------------------------]
[------------------------- -------------------------]
[------------------------- -------------------------]
x
x
x
interval
does not
include interval
includes
interval
includes
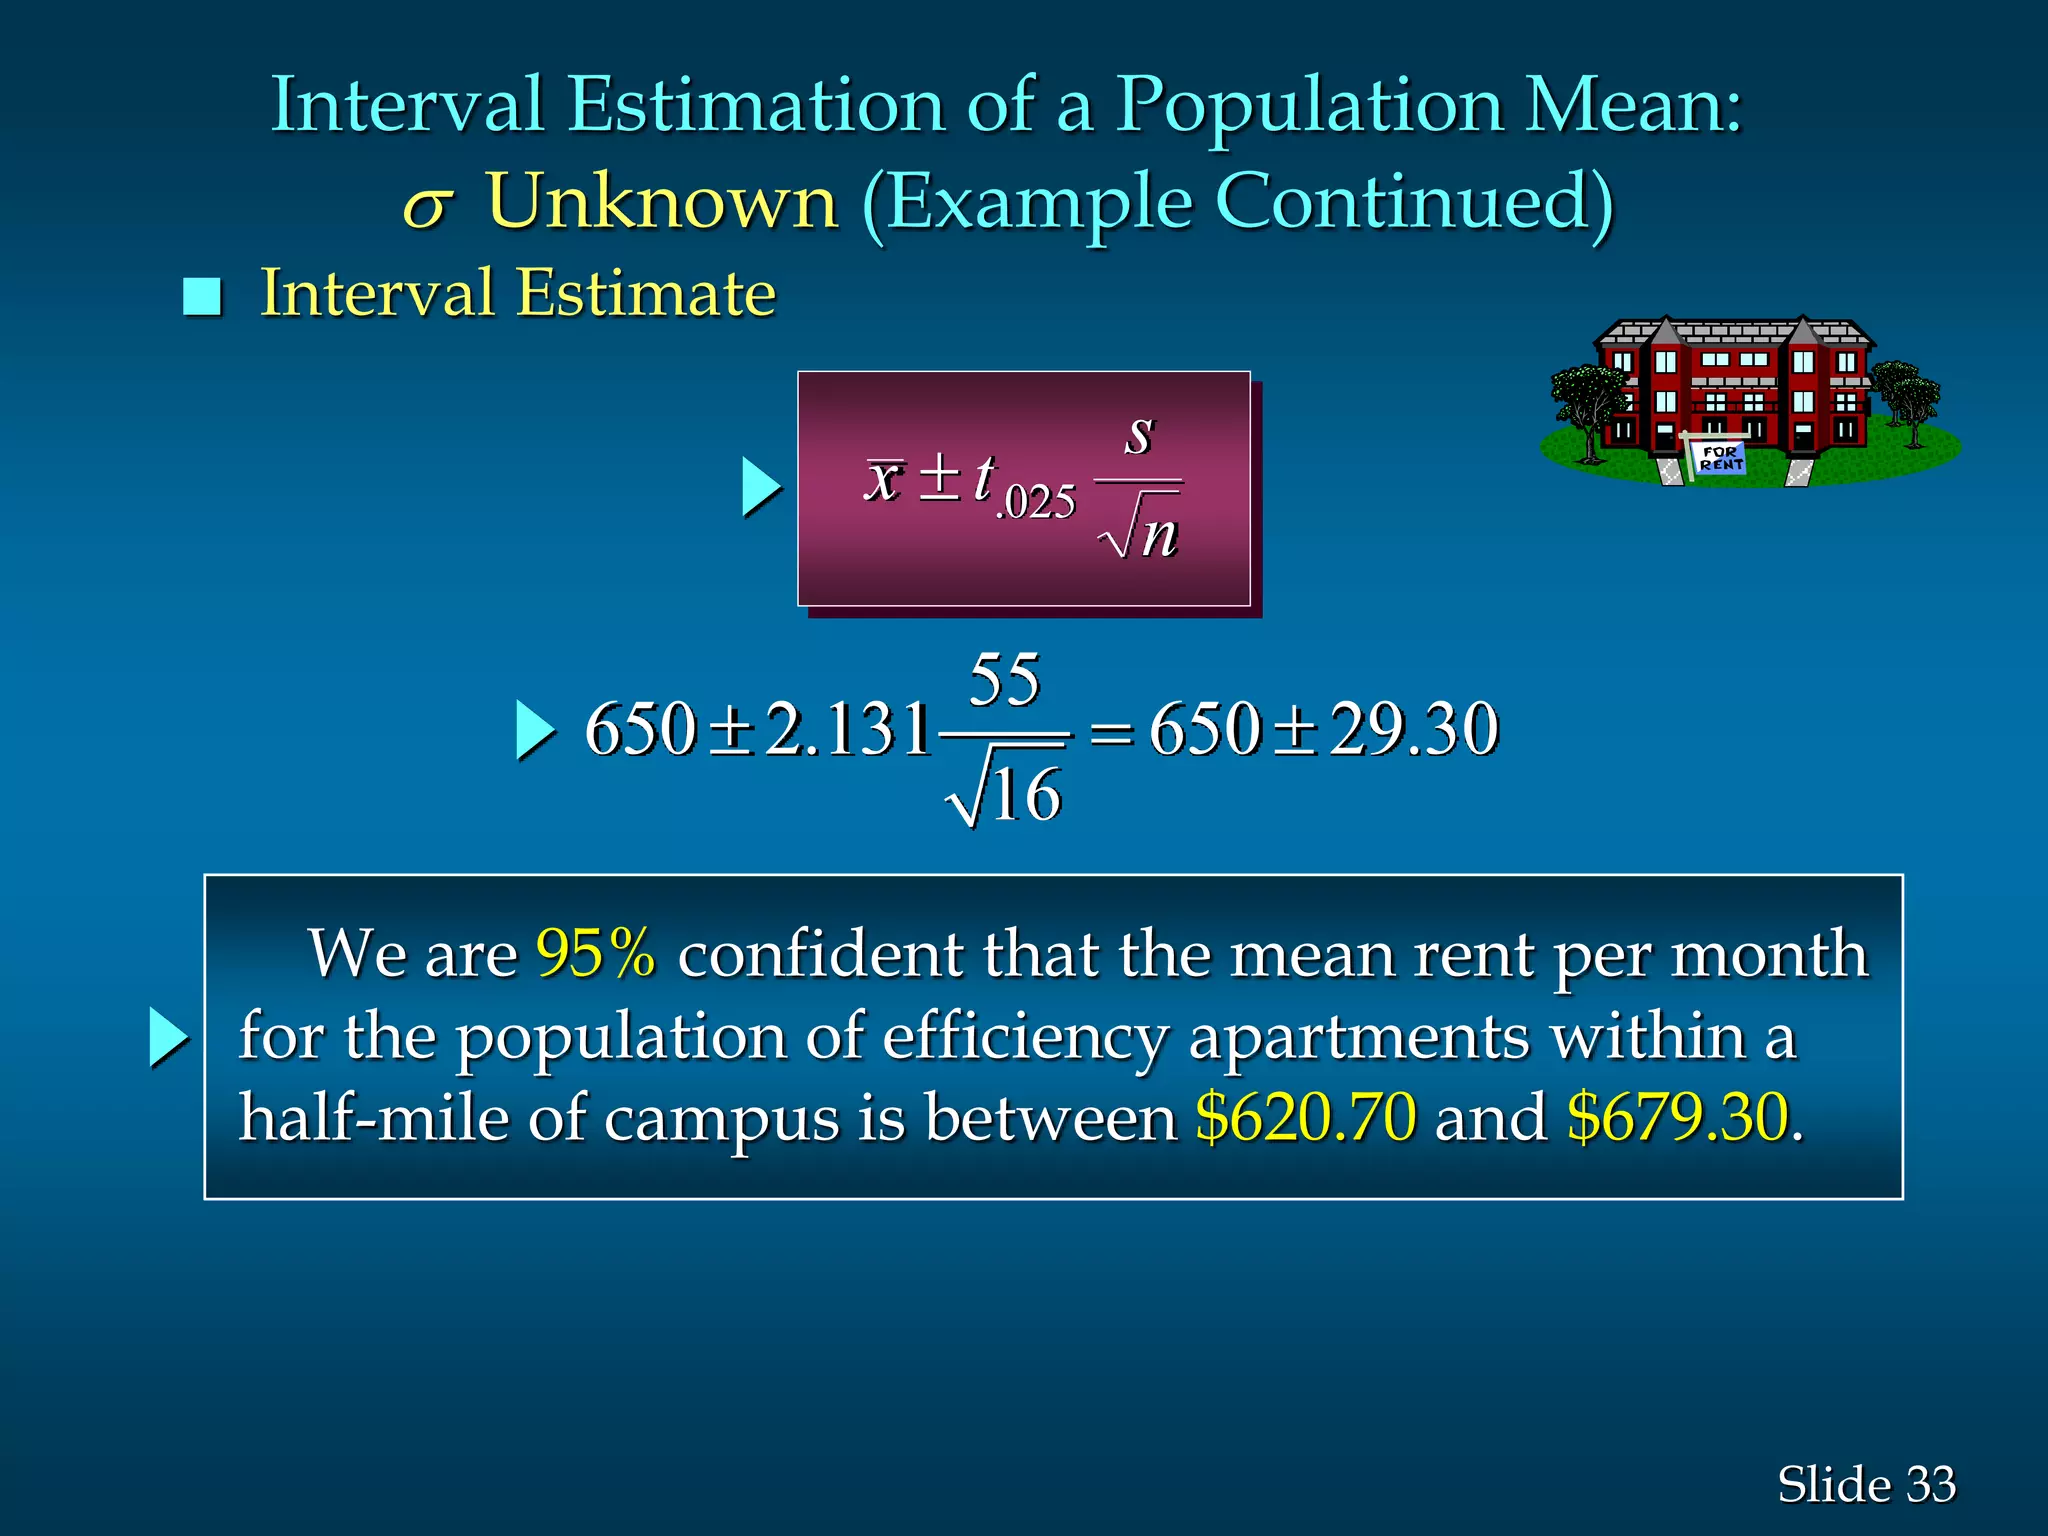
Interval Estimate of a Population Mean:
s Known (Continued)](https://image.slidesharecdn.com/estimationconfidenceinterval-160427101101/75/Estimation-and-confidence-interval-12-2048.jpg)

![59Slide
A consumer group would like to estimate the mean monthly
electric bill for a single family house in July. Based on similar
studies the standard deviation is estimated to be $20.00. A
99% level of confidence is desired, with an accuracy of $5.00.
How large a sample is required?
n = [(2.58)(20)/5]2 = 106.5024 107
n
z
E
( )/ s2
2 2
2
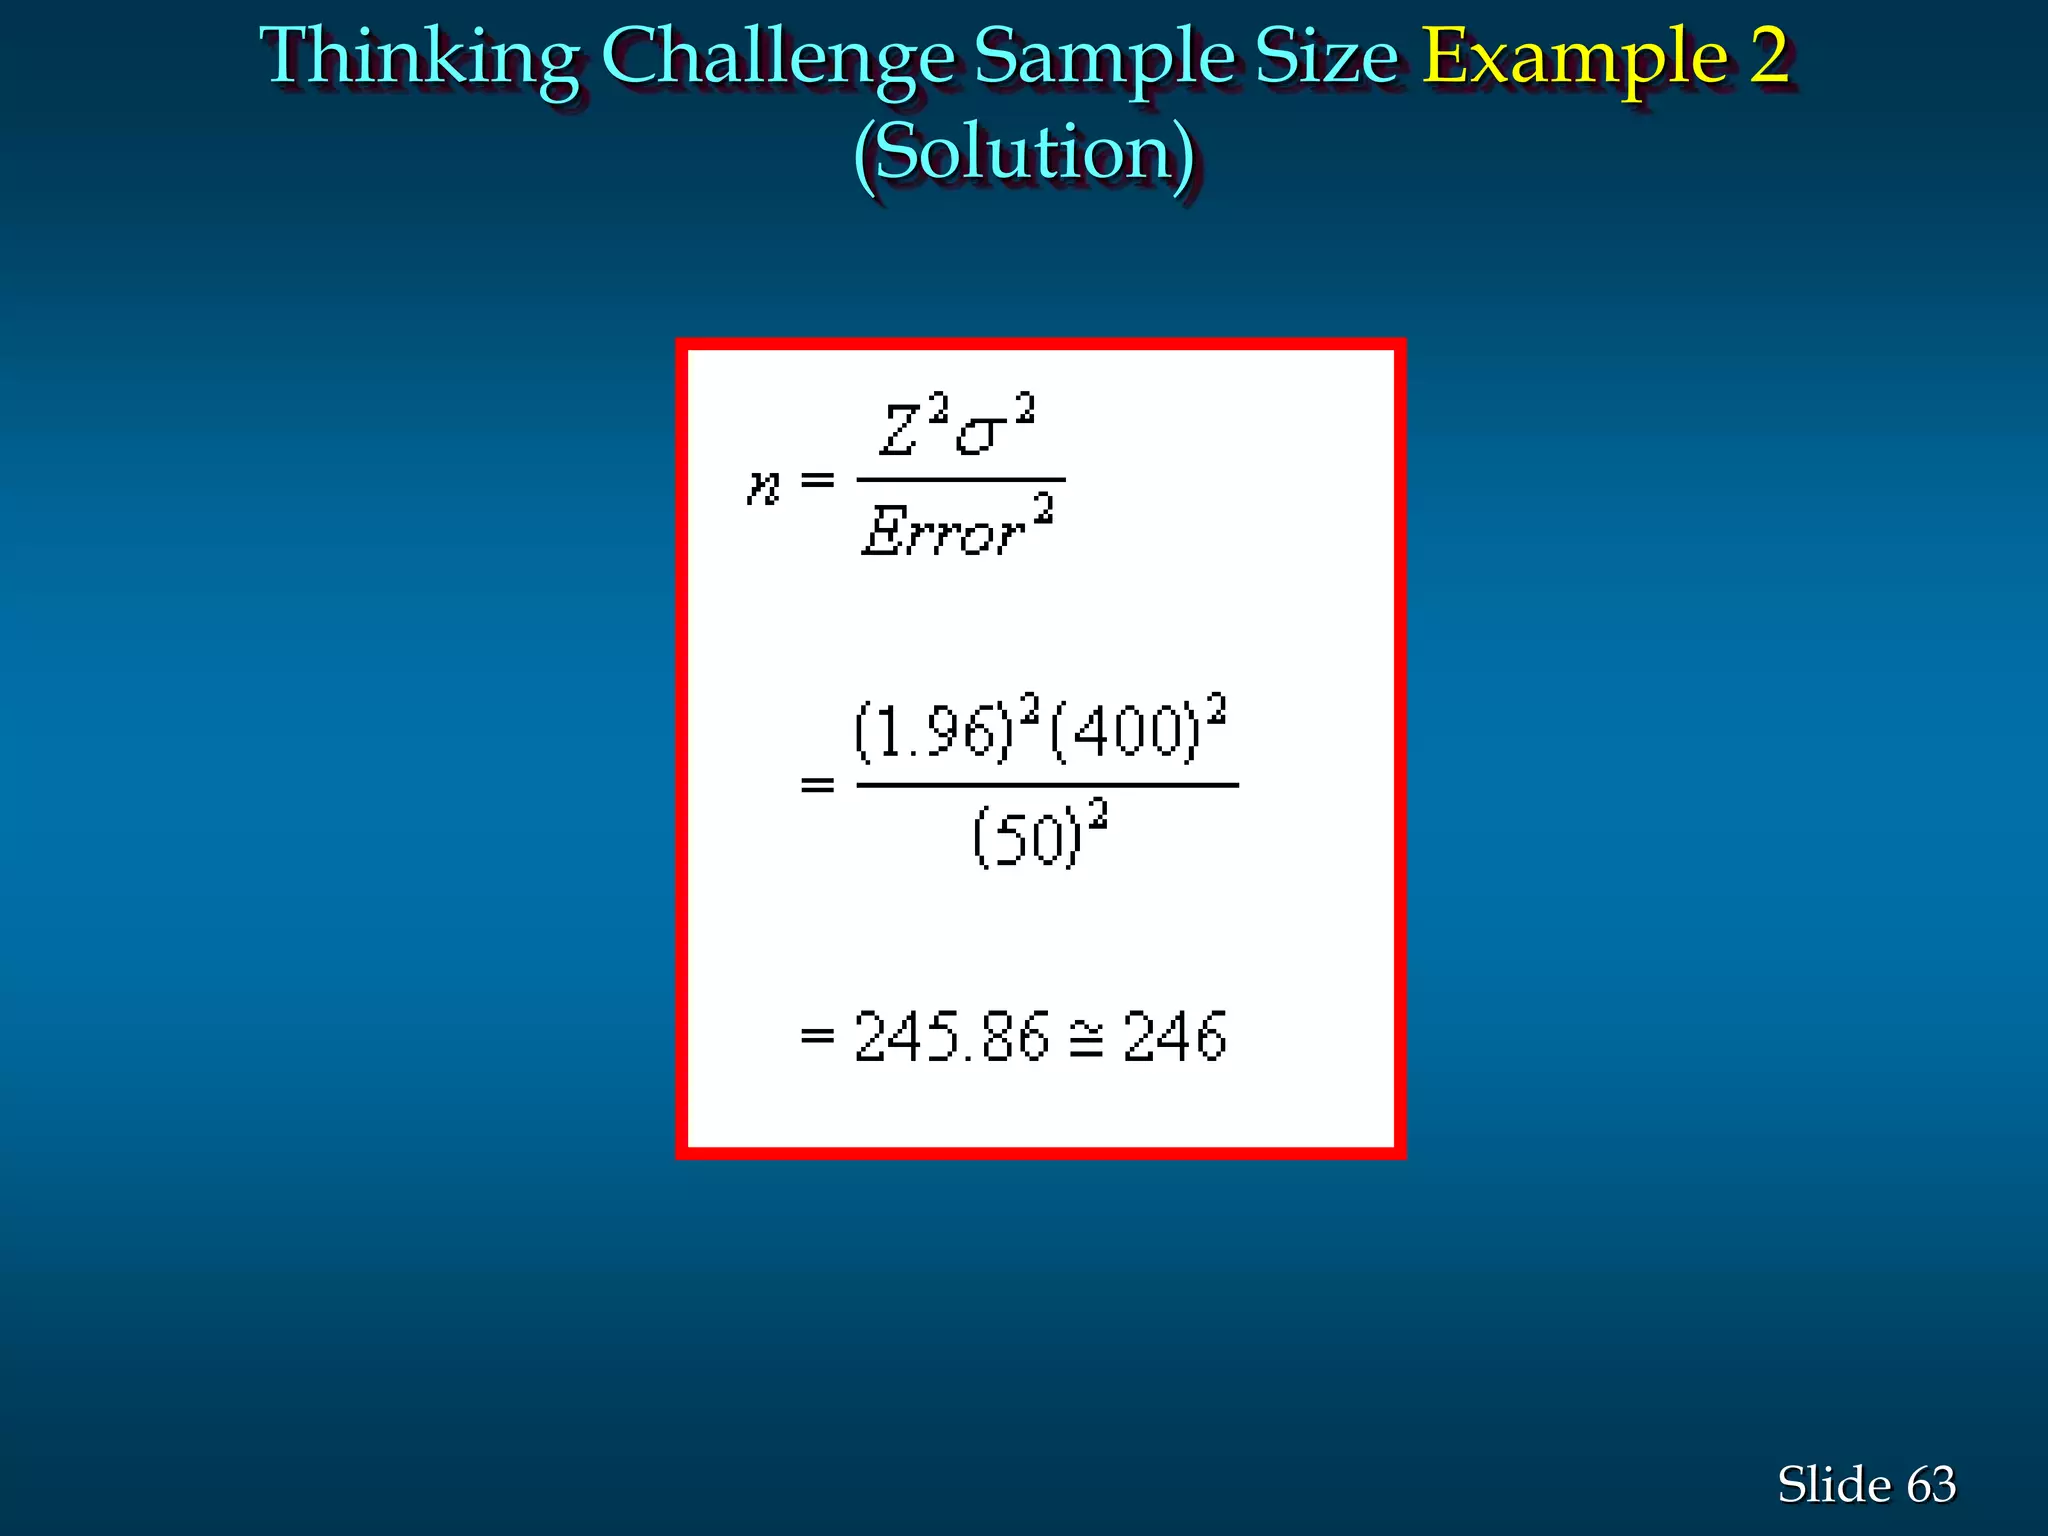
Thinking Challenge Sample Size Example 1](https://image.slidesharecdn.com/estimationconfidenceinterval-160427101101/75/Estimation-and-confidence-interval-59-2048.jpg)


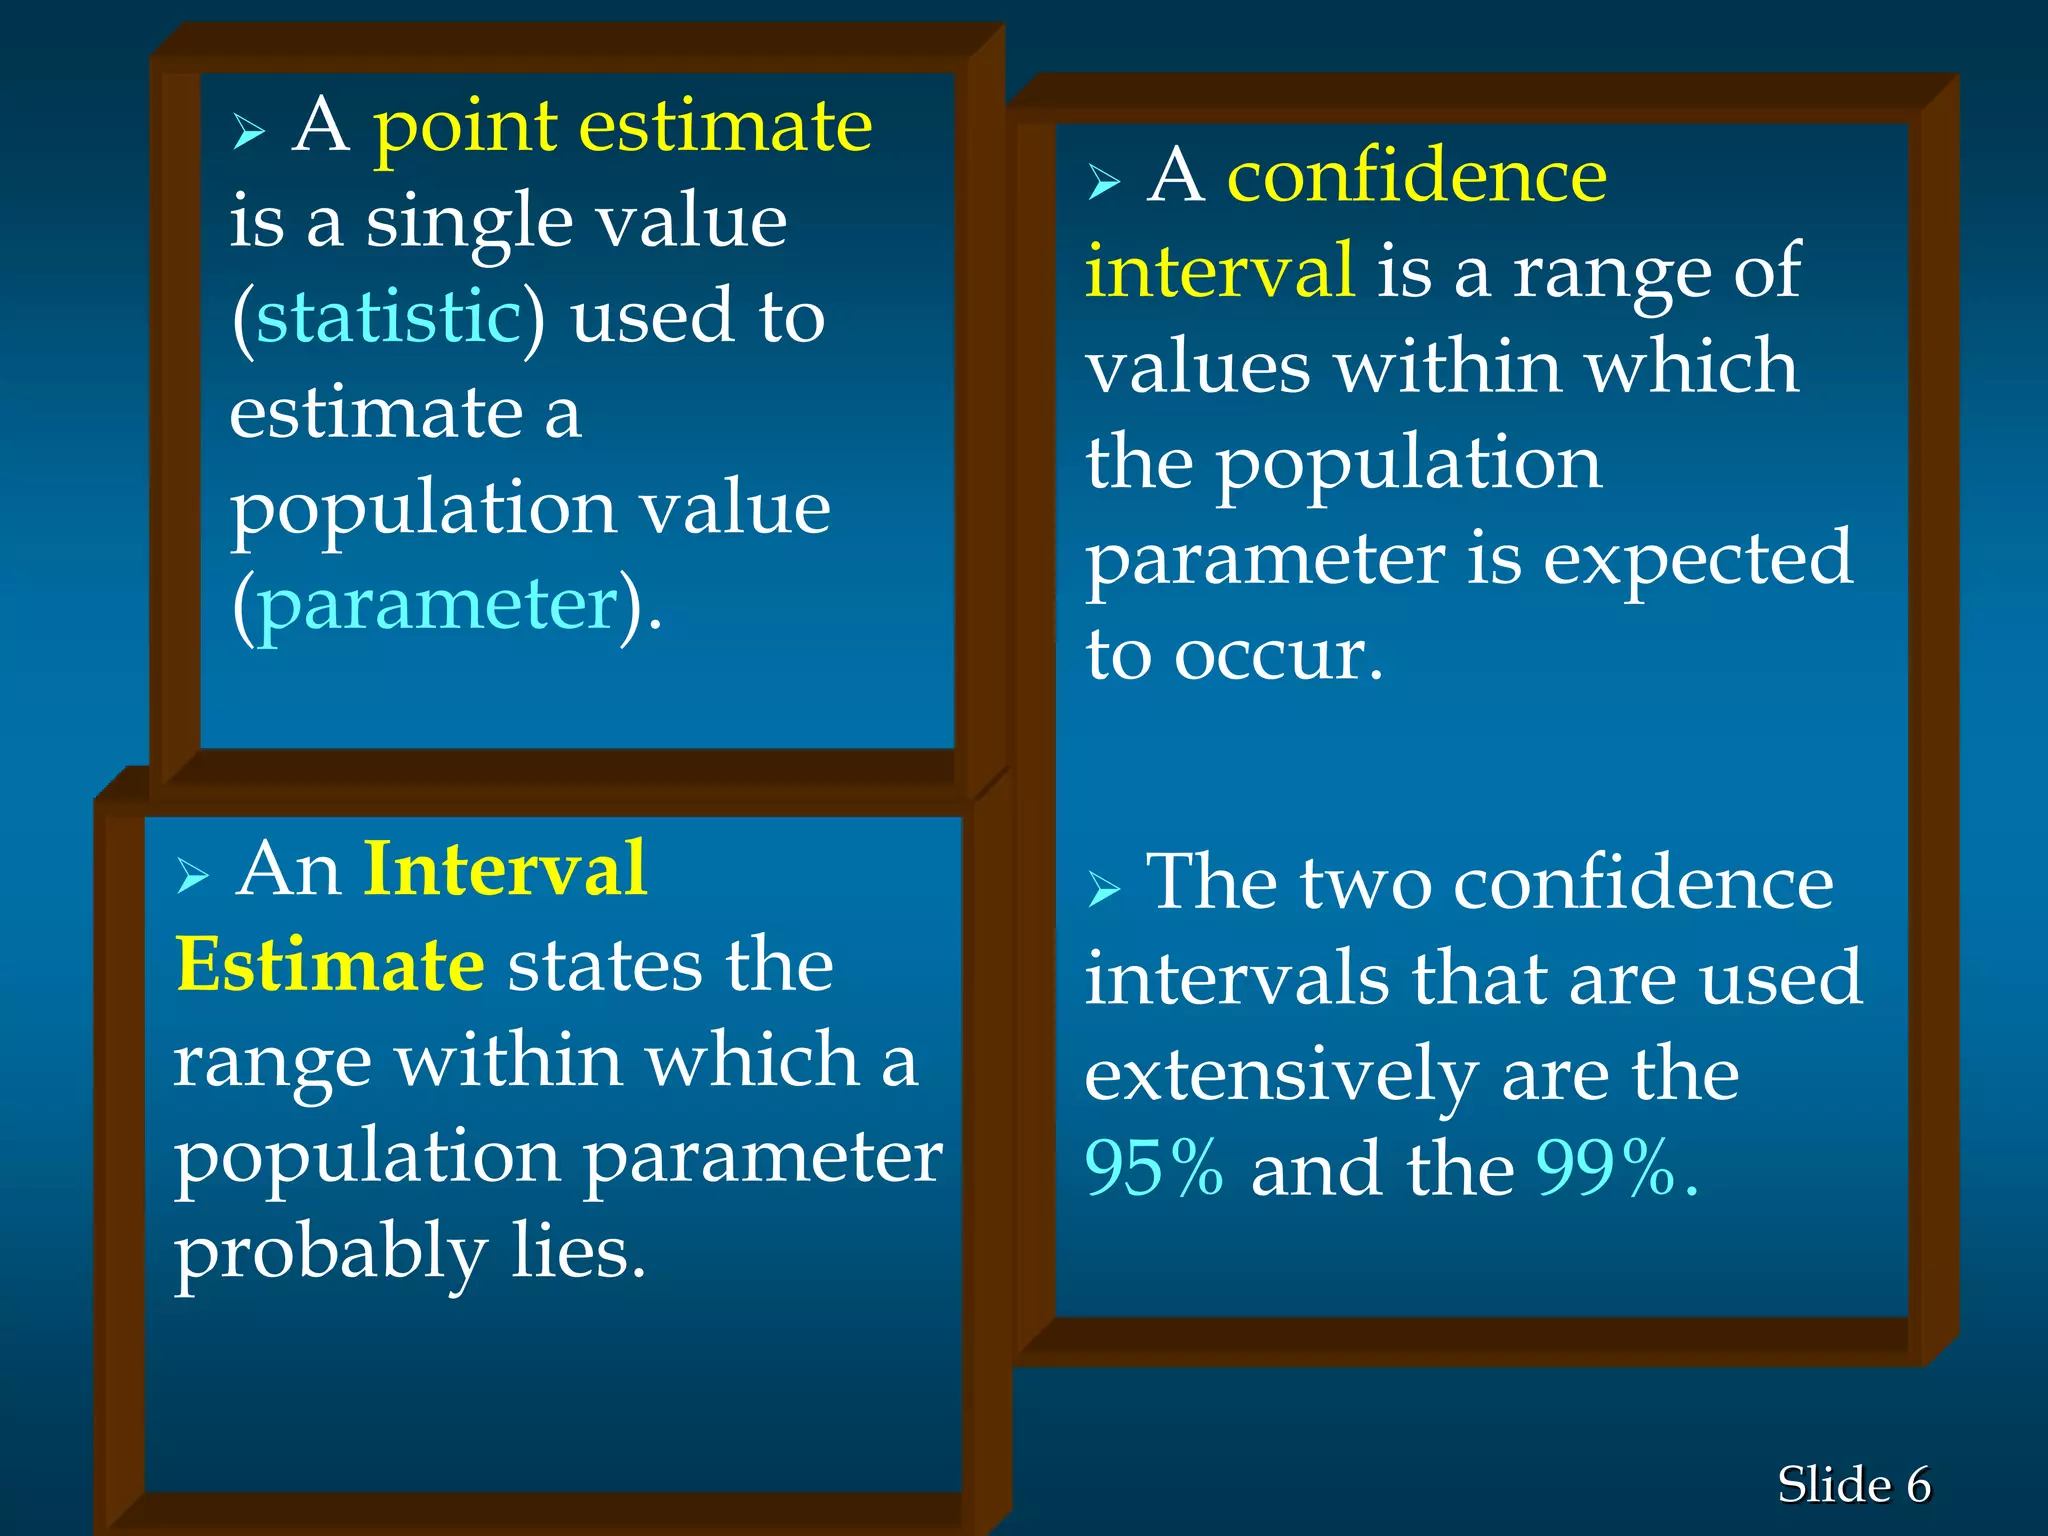
1) The document provides information about statistics homework help and tutoring services offered by Homework Guru. It discusses various types of statistics help available, including online tutoring, homework help, and exam preparation. 2) Key aspects of their tutoring services are highlighted, including the qualifications of tutors, availability, and interactive online classrooms. Confidence intervals and how to calculate them are also explained in detail. 3) Examples are given to demonstrate how to calculate 95% and 99% confidence intervals for a population mean when the population standard deviation is known or unknown. Interval estimation procedures and when to use z-tests or t-tests are summarized.


