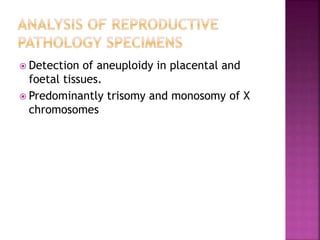
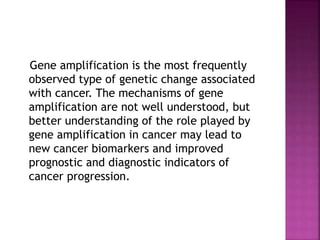
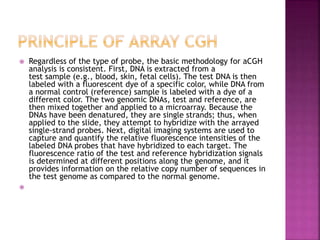
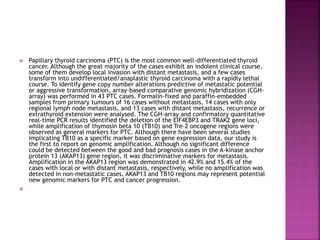
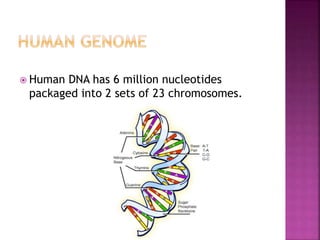
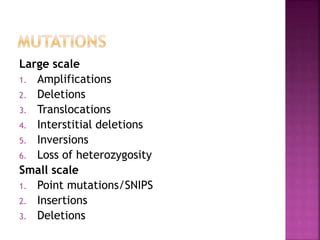
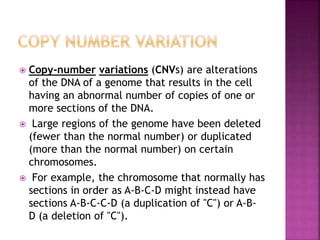
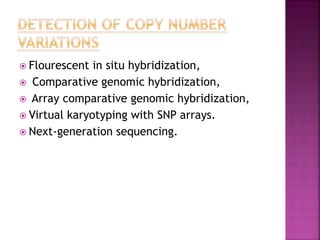
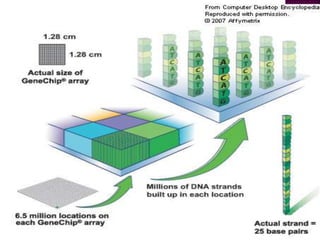
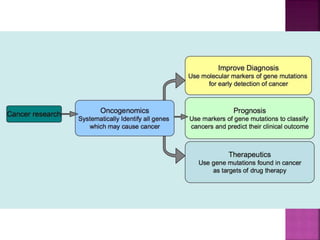
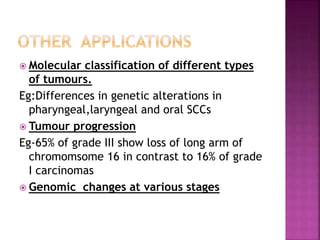
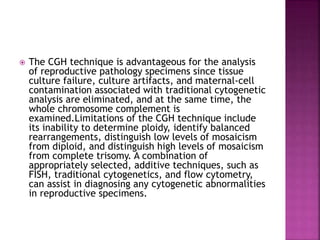
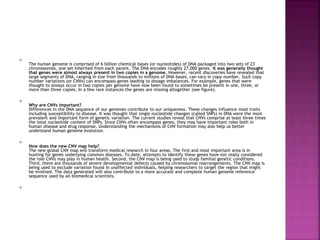
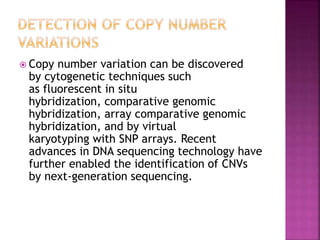
Human DNA consists of 6 million nucleotides organized into 23 pairs of chromosomes and can experience various types of alterations, such as amplifications and deletions, which contribute to diseases like cancer. Copy number variations (CNVs) reveal critical information about genetic imbalances, allowing for improved disease prognosis and treatment strategies. Techniques such as comparative genomic hybridization (CGH) and array CGH enable detailed analysis of these chromosomal aberrations, linking them to specific malignancies and developmental disorders.
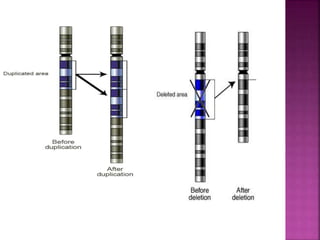
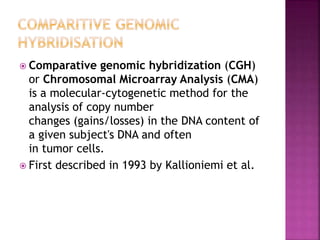
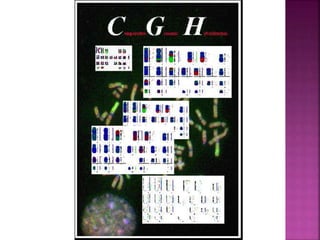
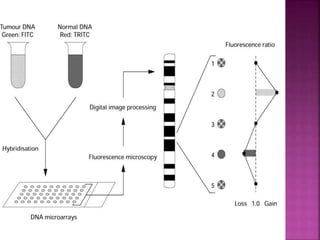
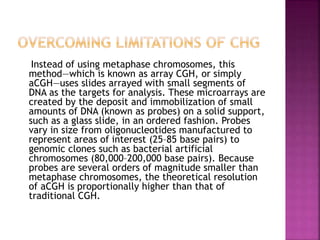
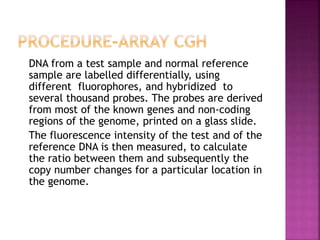
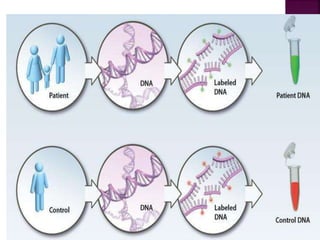
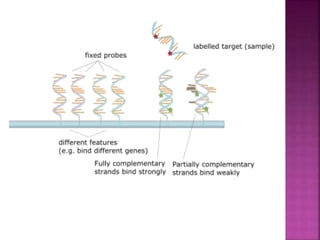
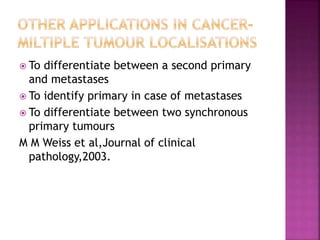
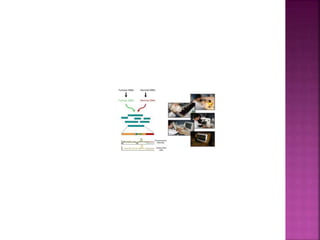
![After extraction of test DNA (i.e.
from a tumor sample) and normal
DNA (i.e. from peripheral blood),
the samples are differentially
labeled with discernable
fluorochromes (i.e. tumor DNA
with FITC [green] and control
DNA with TRITC [red]).](https://image.slidesharecdn.com/comparitivegenomichybridisation-150814080423-lva1-app6891/85/Comparitive-genomic-hybridisation-12-320.jpg)
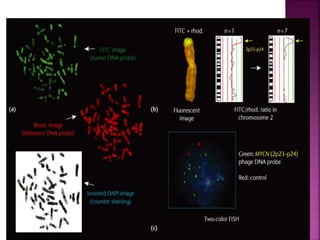
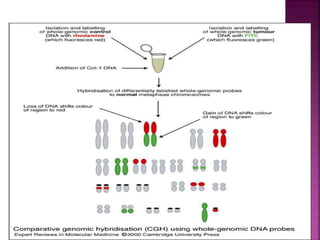
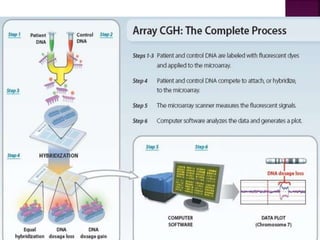
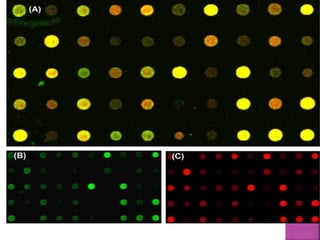
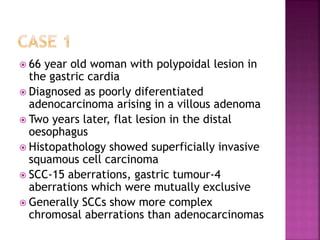

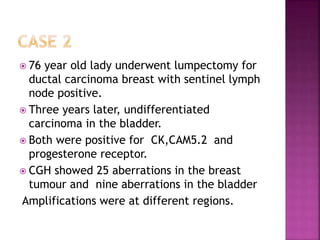
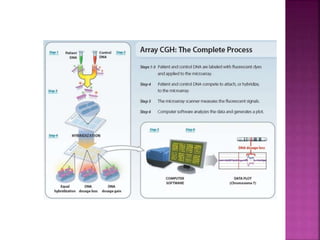
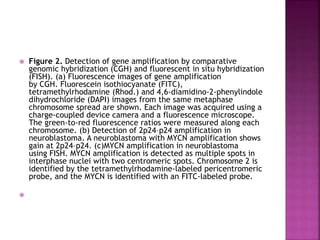
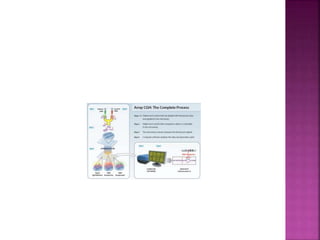
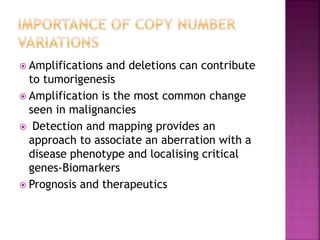
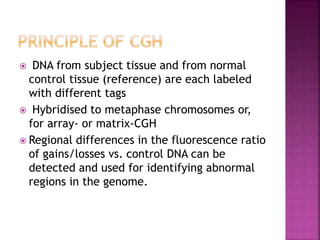
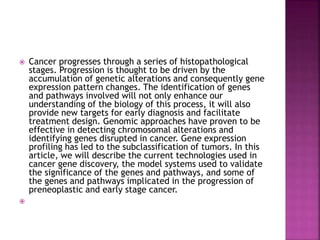
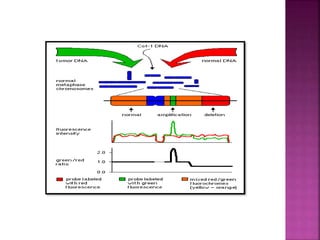
![ After extraction of test DNA (i.e. from a tumor sample) and normal DNA (i.e.
from peripheral blood), the samples are differentially labeled with discernable
fluorochromes (i.e. tumor DNA with FITC [green] and control DNA with TRITC
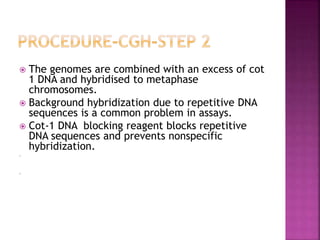
[red]). The two genomes are combined with an excess of human Cot-1 DNA
and then hybridized to normal metaphase chromosomes . Images of
metaphase spreads are then acquired with a (charged coupled device) CCD
camera and fluorochrome-specific optical filter sets to capture the FITC and
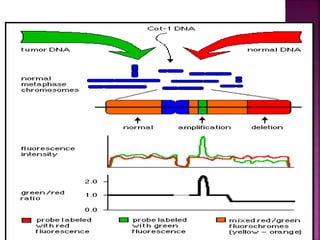
TRITC fluorescence . Differences in fluorescence intensity values between
tumor and control DNA represent gains and losses of specific chromosomes or
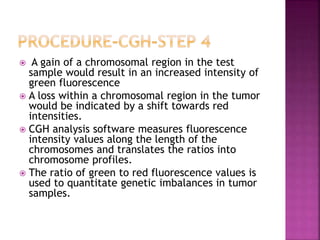
chromosomal regions . For example, a gain of a chromosomal region in the
test sample would result in an increased intensity of green fluorescence. A loss
within a chromosomal region in the tumor would be indicated by a shift
towards red intensities. Specialized CGH analysis software measures
fluorescence intensity values along the length of the chromosomes and
translates the ratios into chromosome profiles . The ratio of green to red
fluorescence values is used to quantitate genetic imbalances in tumor
samples.](https://image.slidesharecdn.com/comparitivegenomichybridisation-150814080423-lva1-app6891/85/Comparitive-genomic-hybridisation-59-320.jpg)
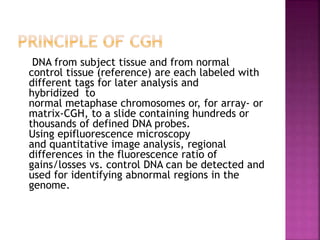
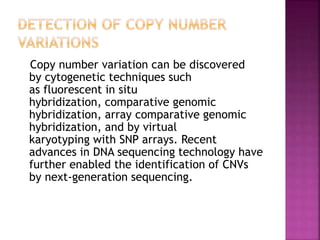

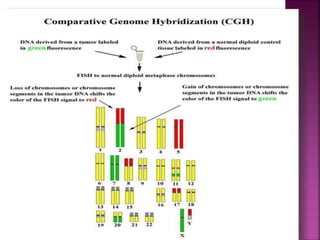
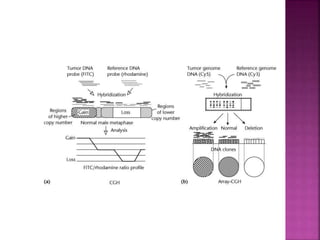
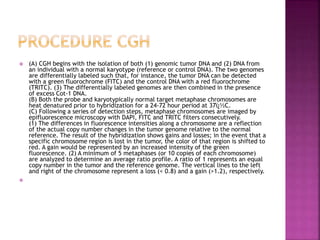
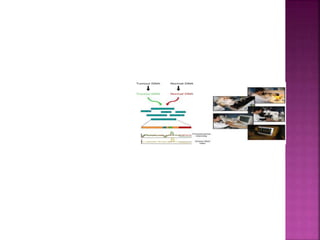
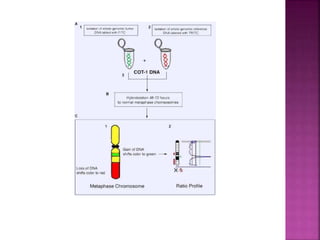
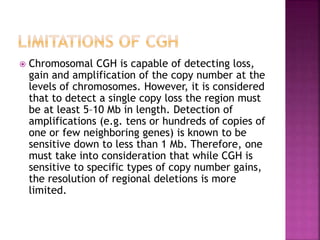
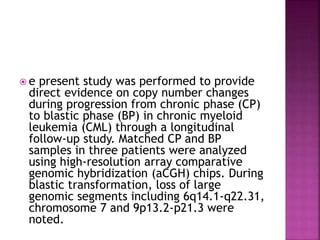
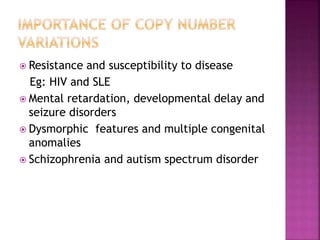
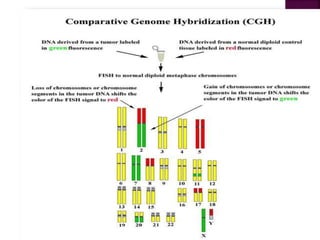
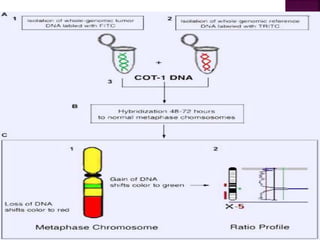
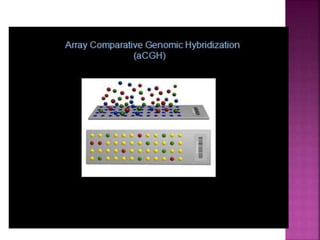
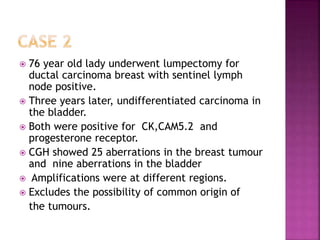
![ After extraction of test DNA (i.e. from a tumor sample) and normal DNA
(i.e. from peripheral blood), the samples are differentially labeled with
discernable fluorochromes (i.e. tumor DNA with FITC [green] and control
DNA with TRITC [red]) (Figure 3A). The two genomes are combined with
an excess of human Cot-1 DNA and then hybridized to normal metaphase
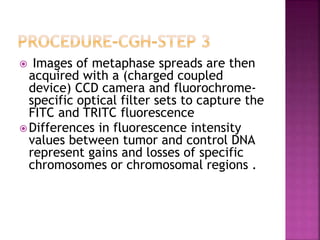
chromosomes . Images of metaphase spreads are then acquired with a
(charged coupled device) CCD camera and fluorochrome-specific optical
filter sets to capture the FITC and TRITC fluorescence . Differences in
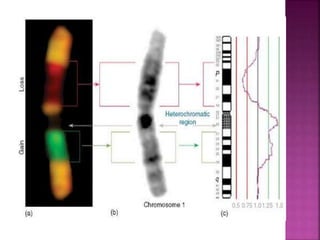
fluorescence intensity values between tumor and control DNA represent
gains and losses of specific chromosomes or chromosomal regions . For
example, a gain of a chromosomal region in the test sample would result
in an increased intensity of green fluorescence. A loss within a
chromosomal region in the tumor would be indicated by a shift towards
red intensities. Specialized CGH analysis software measures fluorescence
intensity values along the length of the chromosomes and translates the
ratios into chromosome profiles . The ratio of green to red fluorescence
values is used to quantitate genetic imbalances in tumor samples.
](https://image.slidesharecdn.com/comparitivegenomichybridisation-150814080423-lva1-app6891/85/Comparitive-genomic-hybridisation-80-320.jpg)