Comparative genomics involves comparing the genetic material and genome sequences of different species to understand evolution, gene function, and disease. For cereals like wheat, rice, maize, and barley, comparative genomics has revealed conserved gene order and colinearity between species, helping to map genes. While rice has a small genome and was fully sequenced first, studies compare features across cereal genomes of different sizes to understand genome structure and evolution in grasses. Comparative genomics is improving our ability to predict gene function and location in related species.
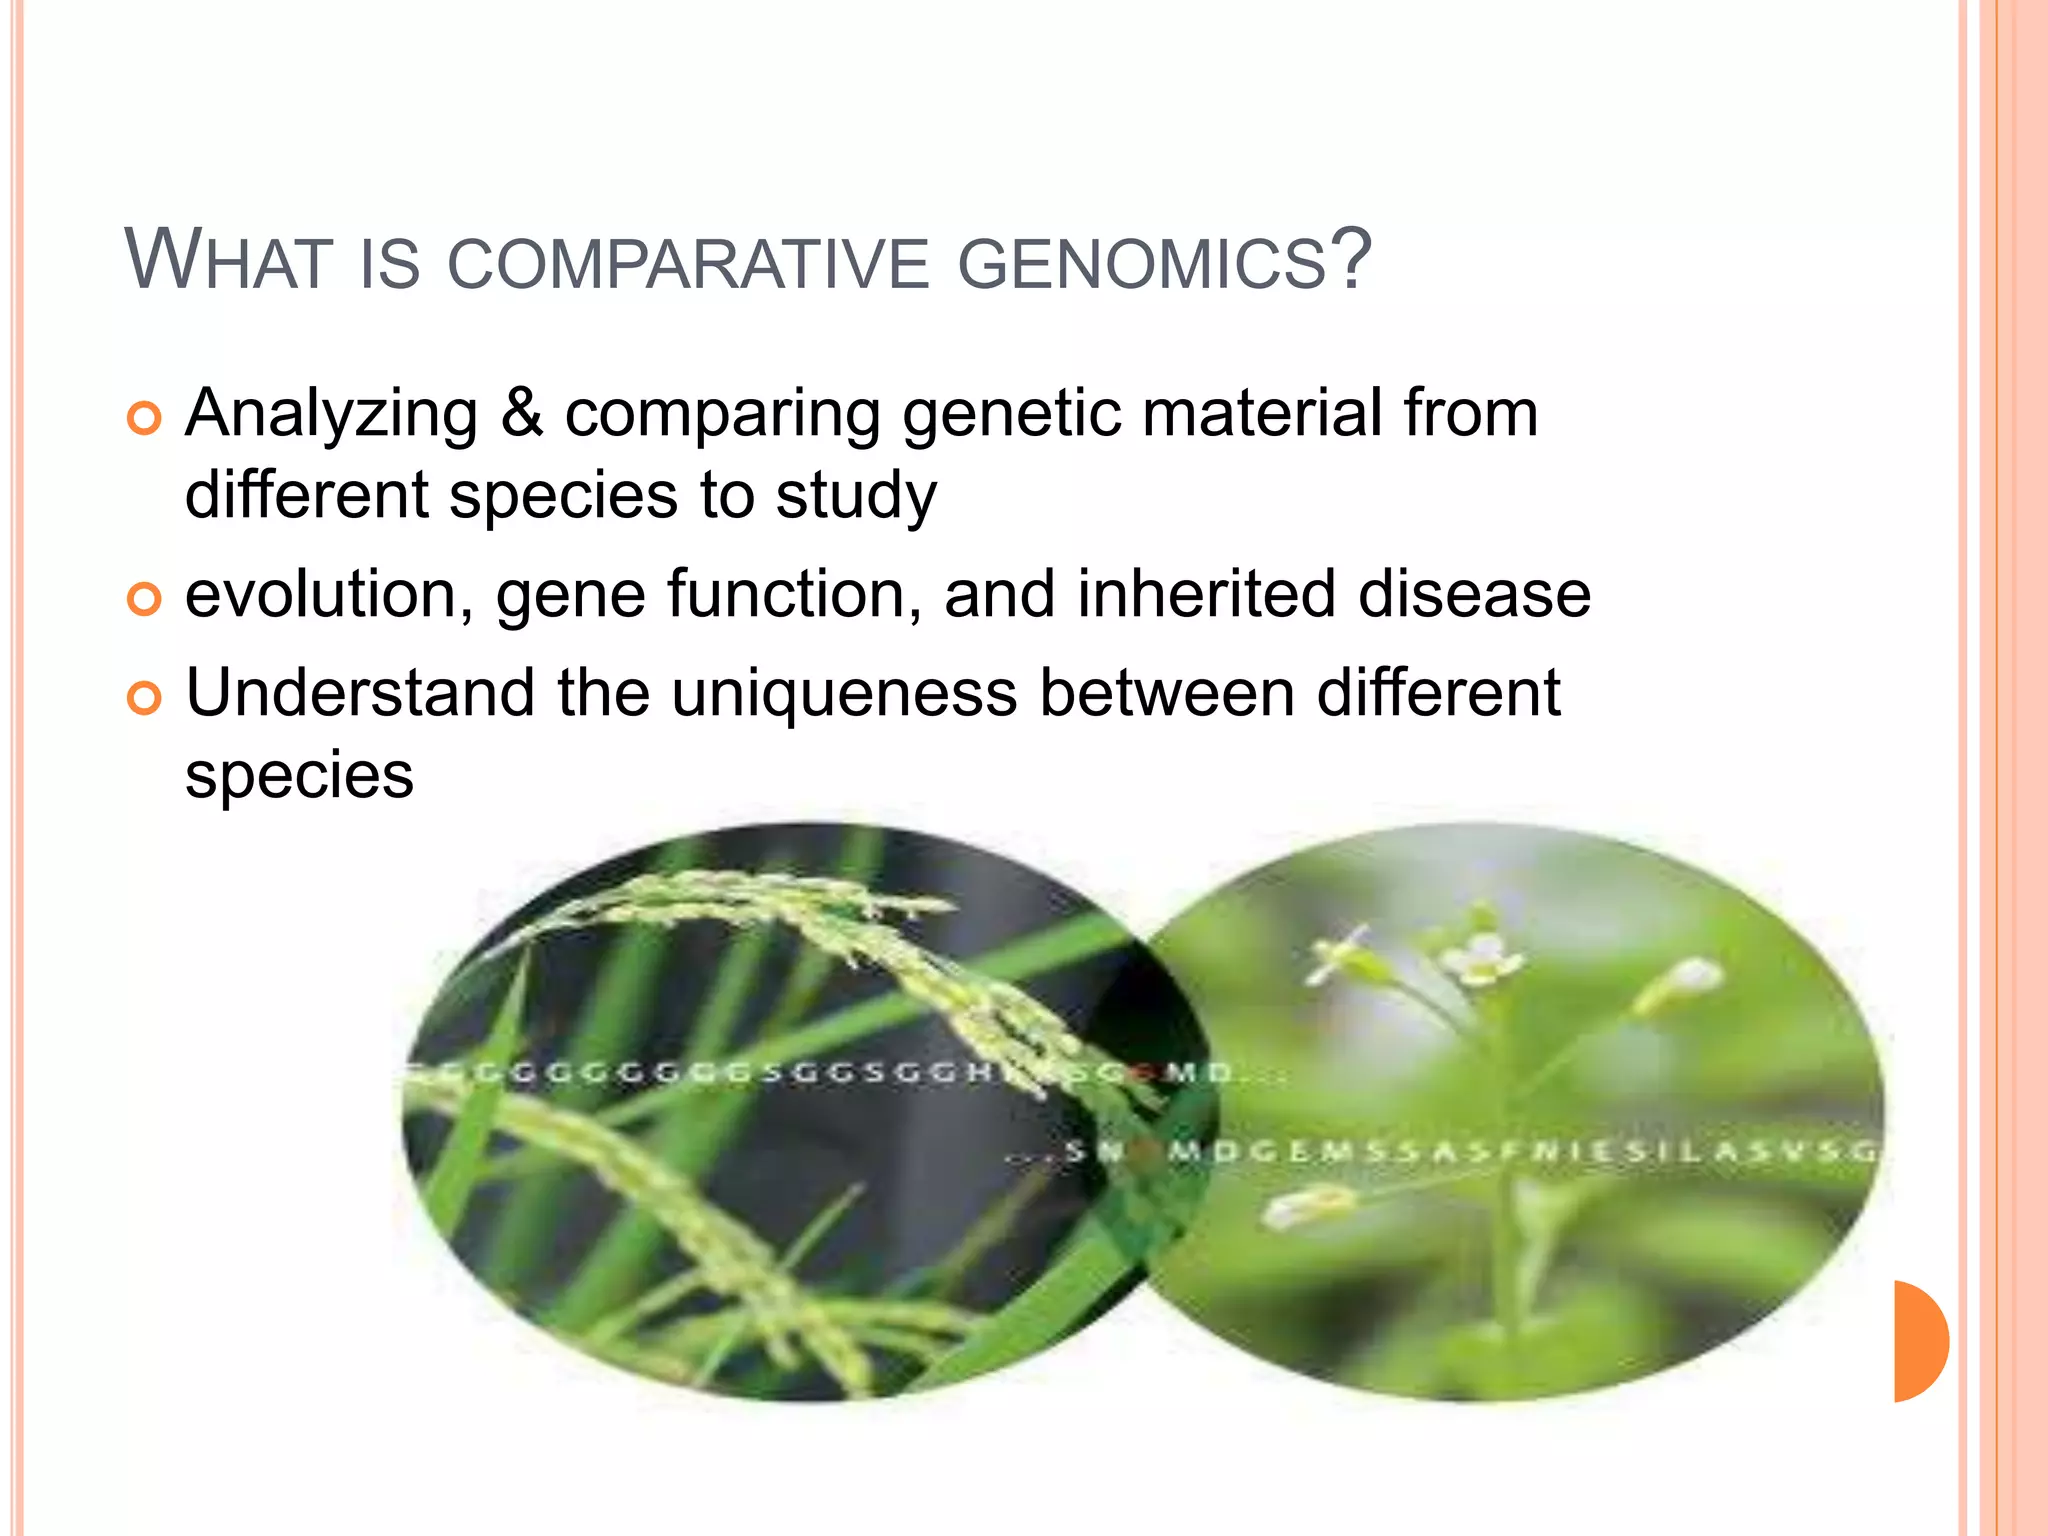
WHAT IS COMPARATIVEGENOMICS?
Analyzing & comparing genetic material from
different species to study
evolution, gene function, and inherited disease
Understand the uniqueness between different
species
3.
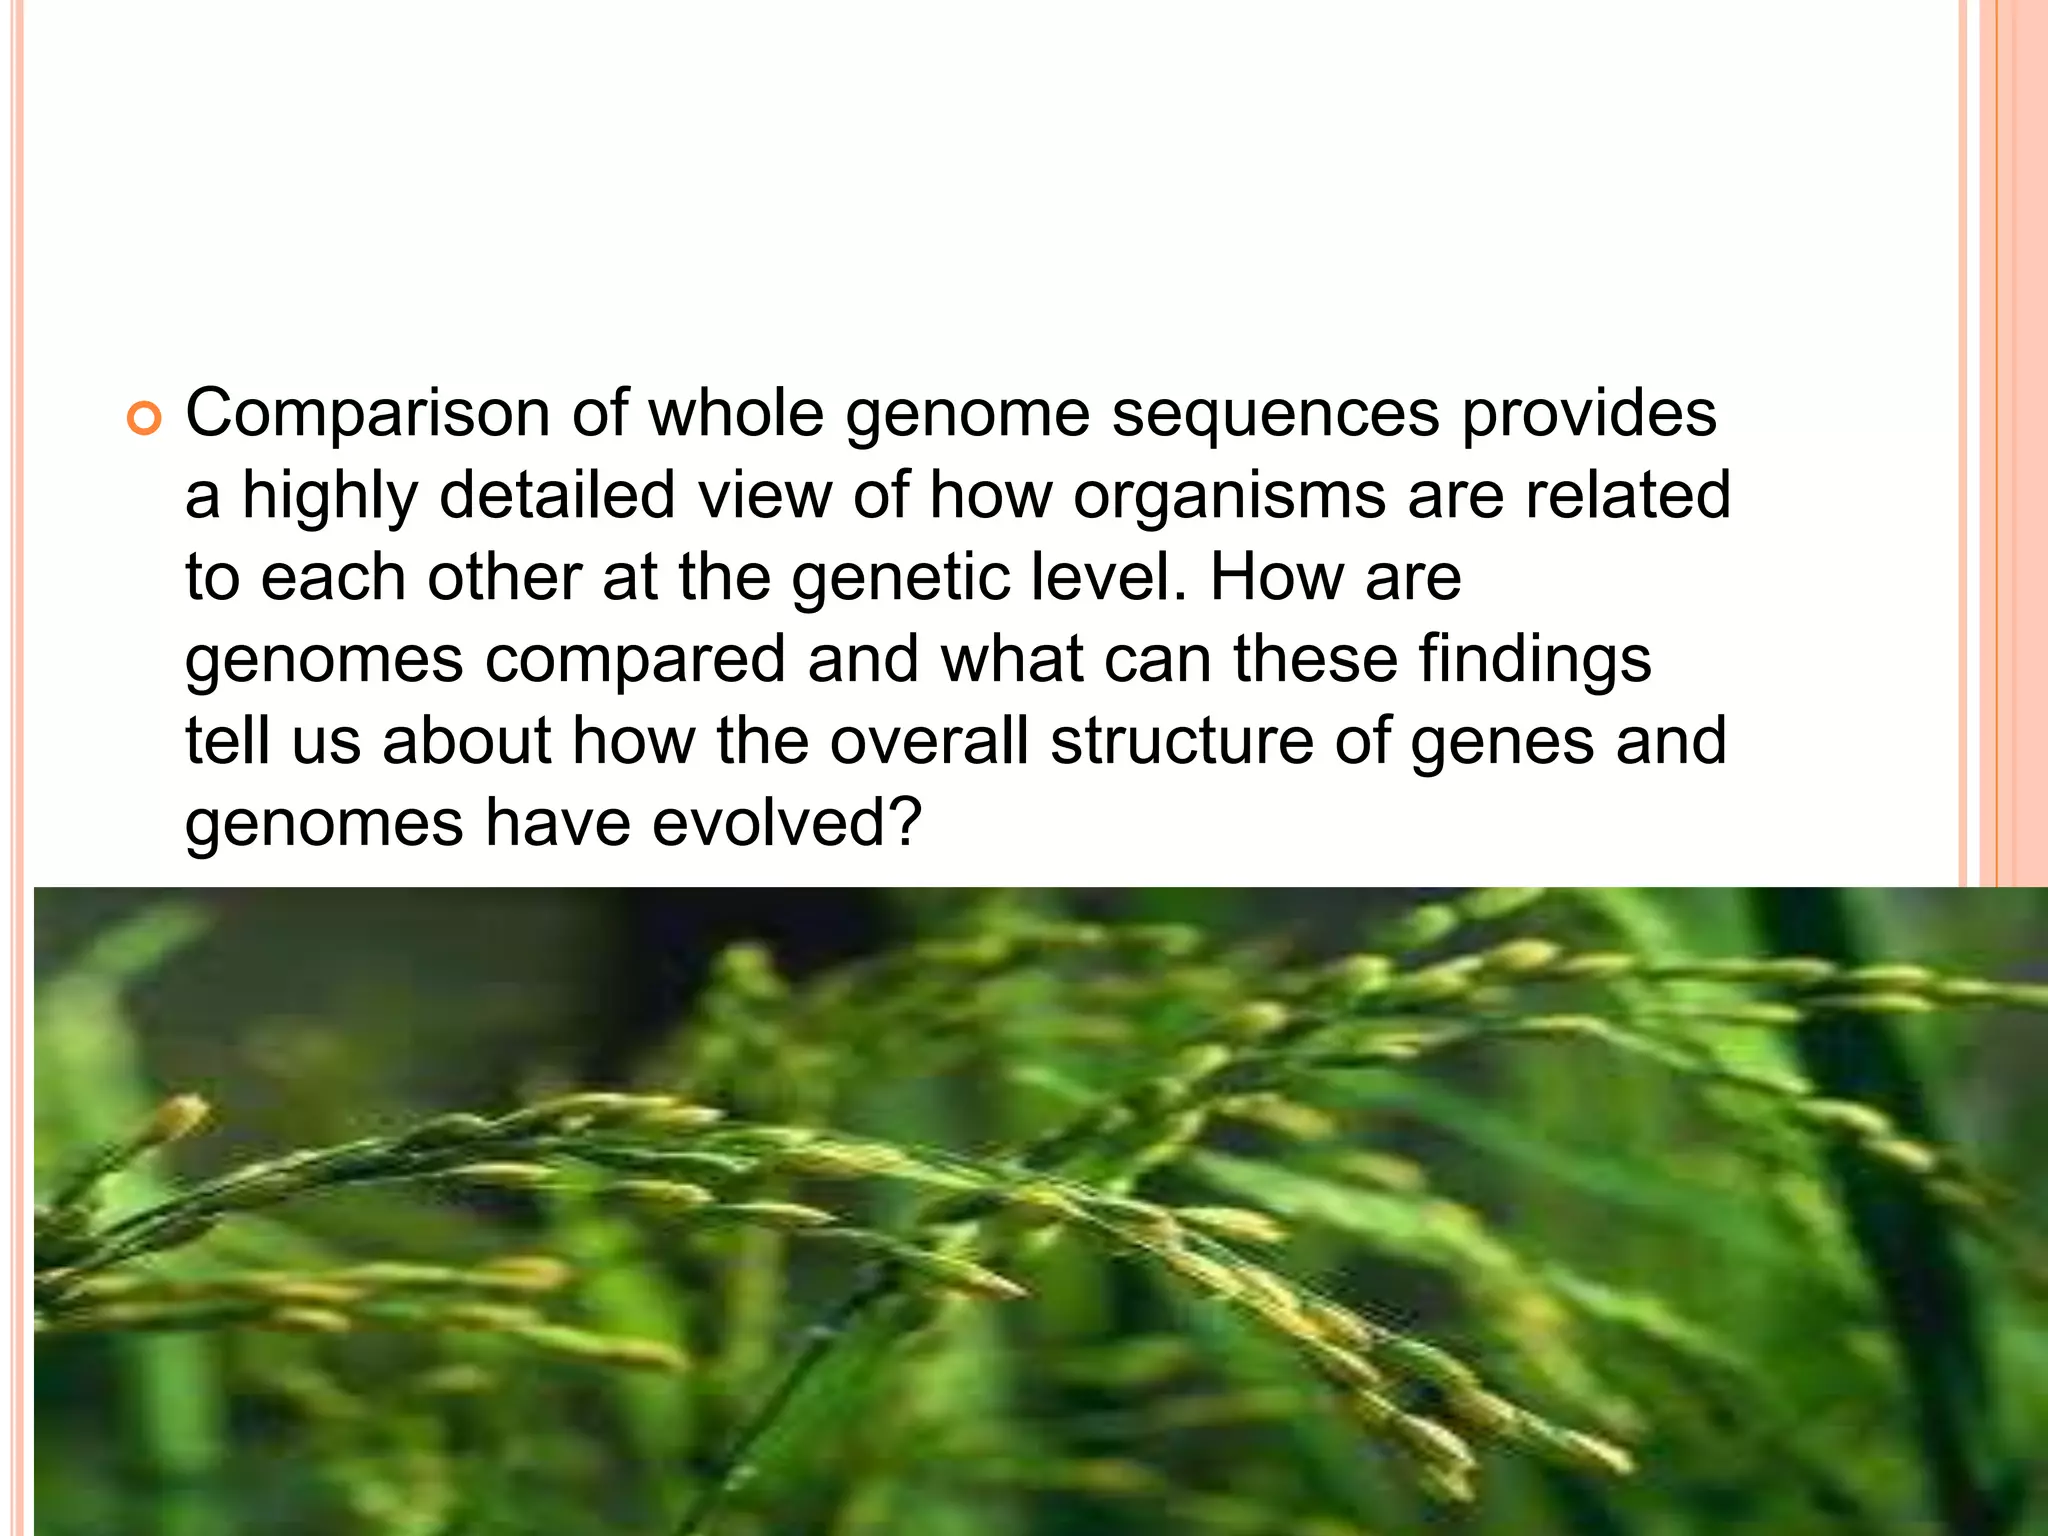
Comparison ofwhole genome sequences provides
a highly detailed view of how organisms are related
to each other at the genetic level. How are
genomes compared and what can these findings
tell us about how the overall structure of genes and
genomes have evolved?
4.
WHY WE MAKECOMPARISON
Comparative genomics is a field of biological research in
which the genome sequences of different species —
human, mouse, and a wide variety of other organisms
from bacteria to chimpanzees — are compared.
By comparing the sequences of genomes of different
organisms, researchers can understand what, at the
molecular level, distinguishes different life forms from
each other.
Comparative genomics also provides a powerful tool for
studying evolutionary changes among organisms,
helping to identify genes that are conserved or common
among species, as well as genes that give each
organism its unique characteristics.
5.
HOW ARE GENOMESCOMPARED?
A simple comparison of the general features of
genomes such as
genome size,
number of genes, and
chromosome number presents an entry point into
comparative genomic analysis
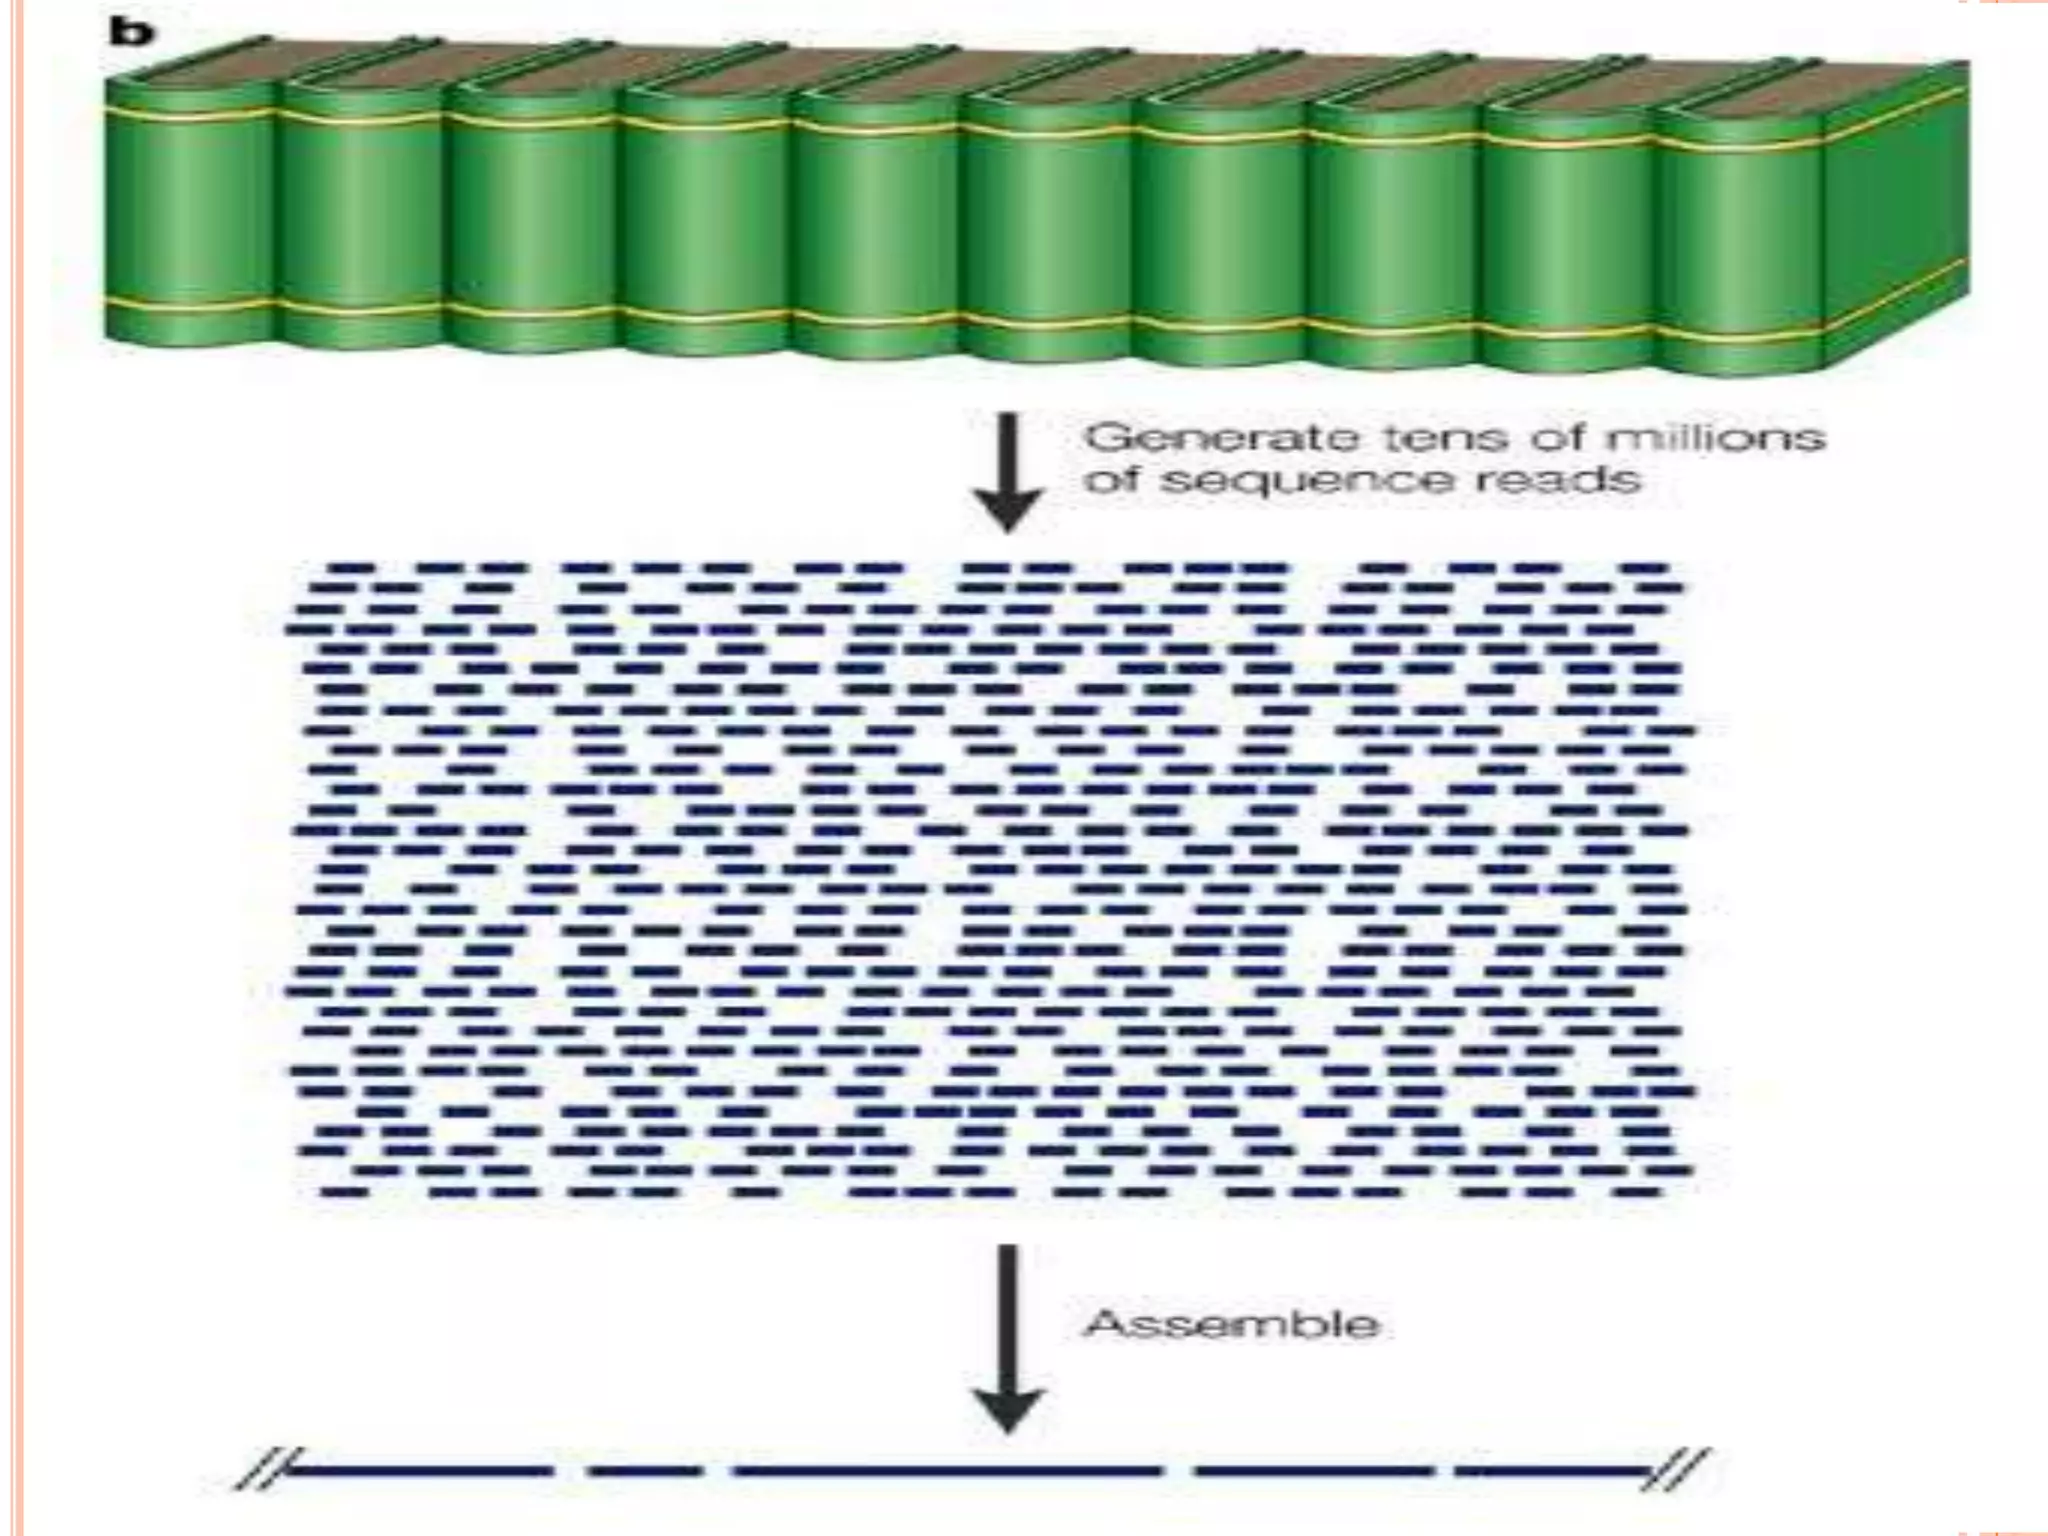
Whole-genome shotgunsequencing:
1. Genome is cut into small sections
2. Each section is hundreds or a few thousand bp of
DNA
3. Each section is sequenced and put in a database
4. A computer aligns all sequences together (millions
of them from each chromosome) to form contigs
5. Contigs are arranged (using markers, etc) to form
scaffolds
9.
CEREAL CROP
FAO'sdefinition of cereals describes these plants as
annual plants which generally belong to the gramineous
family, producing grains that are used for food, feed,
seed and production of industrial products.
Cereal Crops:
Rice
Wheat,
Corn or maize
Barley
Millet
Sorghum
Oat
Rye
10.
Cereals suchas wheat, barley, maize, sorghum,
millet and rice belong to the grass family and
comprise some of the most important crops for
human and animal nutrition
. Comparative genomic studies in cereals have
been pioneering the field of plant comparative
genomics in the past decade. The first comparative
studies were performed at the genetic map level.
They have revealed a very good conservation of
the order (colinearity) of molecular markers and of
QTL for agronomic traits along the chromosomes
thereby establishing evolutionary relationships
between the cereal genomes.
11.
For thisreason and because of its small size, rice
was promoted as a model and was chosen to be
the first cereal genome sequenced.
Further, the development of large EST collections
and the first inter- and intra-specific comparative
studies of BAC sequences from maize, sorghum,
rice, wheat and barley have increased the
resolution of comparative analyses and have shown
that a number of rearrangements disrupting
microcolinearity have occurred during the evolution
of the cereal genomes in the past 50–70 million
years.
12.
Comparative genomicsin the grass family
(Poaceae) is of particular importance. The family
comprises a number of economically important
plants, such as rice (Oryza sativa L.), maize (Zea
mays L.), wheat (Triticum aestivum L.), sorghum
(Sorghum vulgare L.), barley (Hordeum vulgare L.),
rye (Secale cereale L.), and others. Even though
Poaceae species diverged over 65 million years
ago, comparative mapping studies have indicated
that there is a high level of gene order conservation
at the macro level
13.
development ofmolecular markers, and for
identifying the region in the model species that
might contain candidate genes responsible for a
trait of interest. Rice (2n = 24), having a small
genome and great economic significance, was the
first grass species selected for genome sequencing
14.
In contrast,wheat, a polyploid (2n = 6x, AA, BB, DD
genomes), with a genome size 40 times larger than
that of rice (Argumuganathan and Earle 1991),
25%–30% gene duplication (Anderson et al. 1992;
Dubcovsky et al. 1996; Akhunov et al. 2003), and
over 80% repeated DNA can clearly benefit from
comparative genomics. Hexaploid wheat has a
haploid chromosome complement composed of
three related genomes, (A, B, and D), each
containing seven chromosomes.
15.
MICRO-COLINEARITY
Micro-colinearity hasbeen shown to be conserved
in some regions between barley (Dunford et al.
1995) or wheat (Yan et al. 2003) and rice.
Investigations of the Sh2/A1 orthologous region in
rice, sorghum, and maize (Bennetzen and
Ramakrishna 2002), and species in the Triticeae (Li
and Gill 2002) showed that the region was largely
colinear
16.
WHOLE GENOME COMPARATIVEMAPPING BY
SEQUENCE MATCHING
Southern hybridization using anchor probes (Van
Deynze et al. 1998) has been the method of choice
for evaluating relationships among species and
genera and can detect genome fragments
estimated to be at least 80% similar. Other methods
such as PCR-based fragment amplification may be
an all or none reaction (dominant), may amplify
nonorthologous loci, or because of primer
specificity, inadequately sample sequence variation.
17.
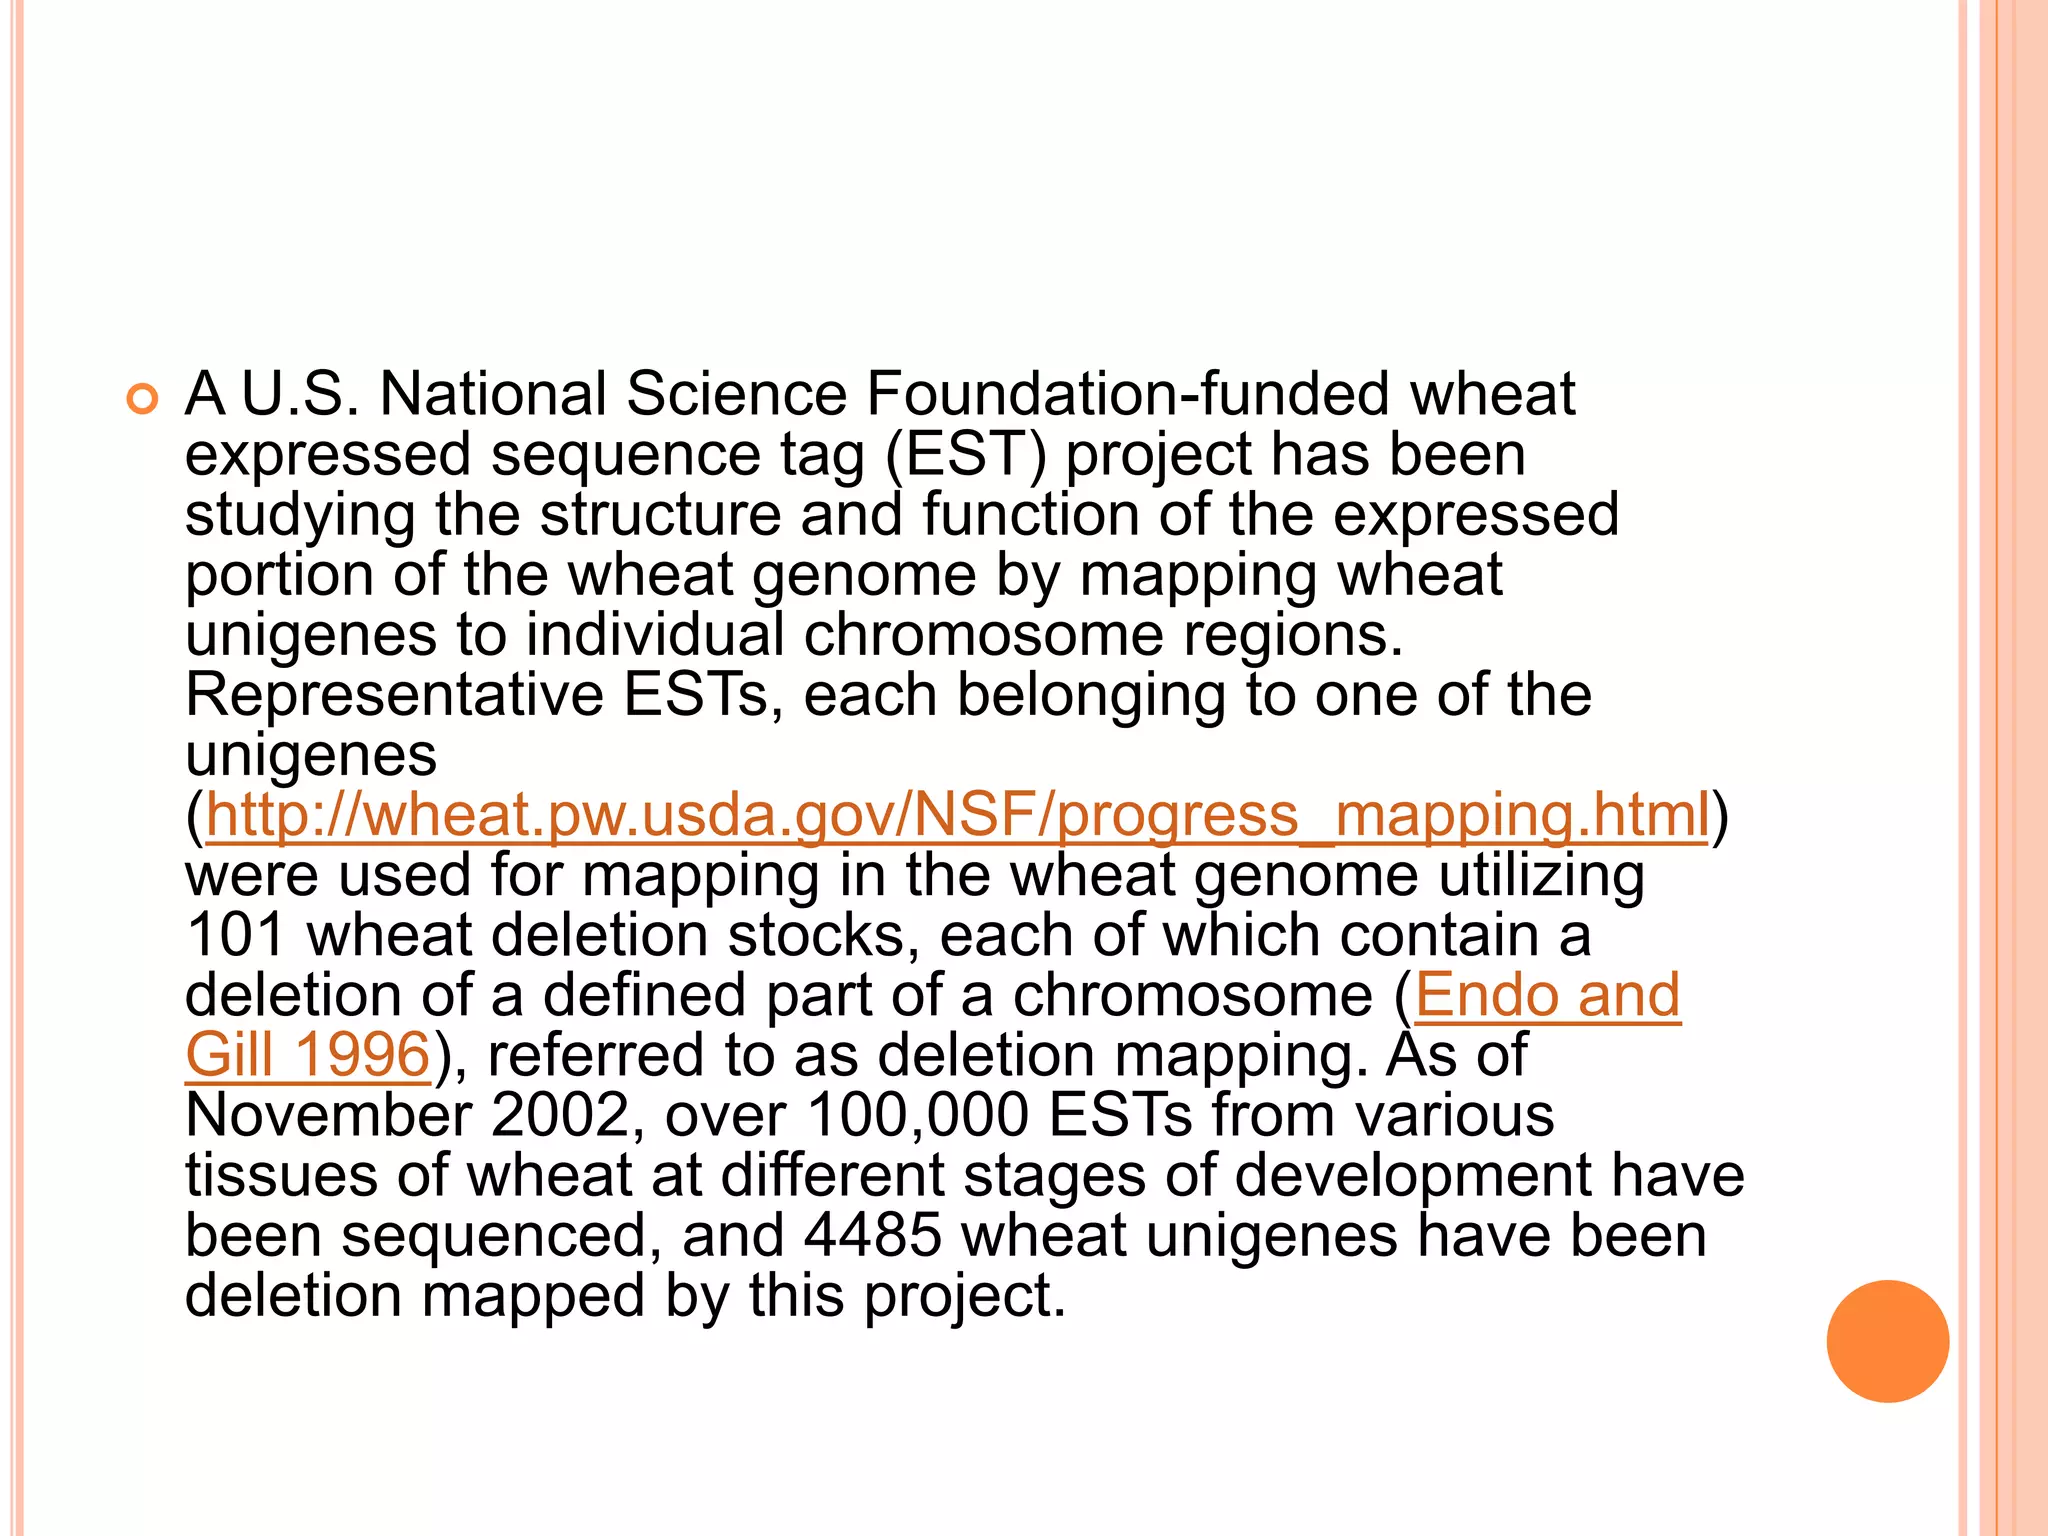
A U.S.National Science Foundation-funded wheat
expressed sequence tag (EST) project has been
studying the structure and function of the expressed
portion of the wheat genome by mapping wheat
unigenes to individual chromosome regions.
Representative ESTs, each belonging to one of the
unigenes
(http://wheat.pw.usda.gov/NSF/progress_mapping.html)
were used for mapping in the wheat genome utilizing
101 wheat deletion stocks, each of which contain a
deletion of a defined part of a chromosome (Endo and
Gill 1996), referred to as deletion mapping. As of
November 2002, over 100,000 ESTs from various
tissues of wheat at different stages of development have
been sequenced, and 4485 wheat unigenes have been
deletion mapped by this project.
18.
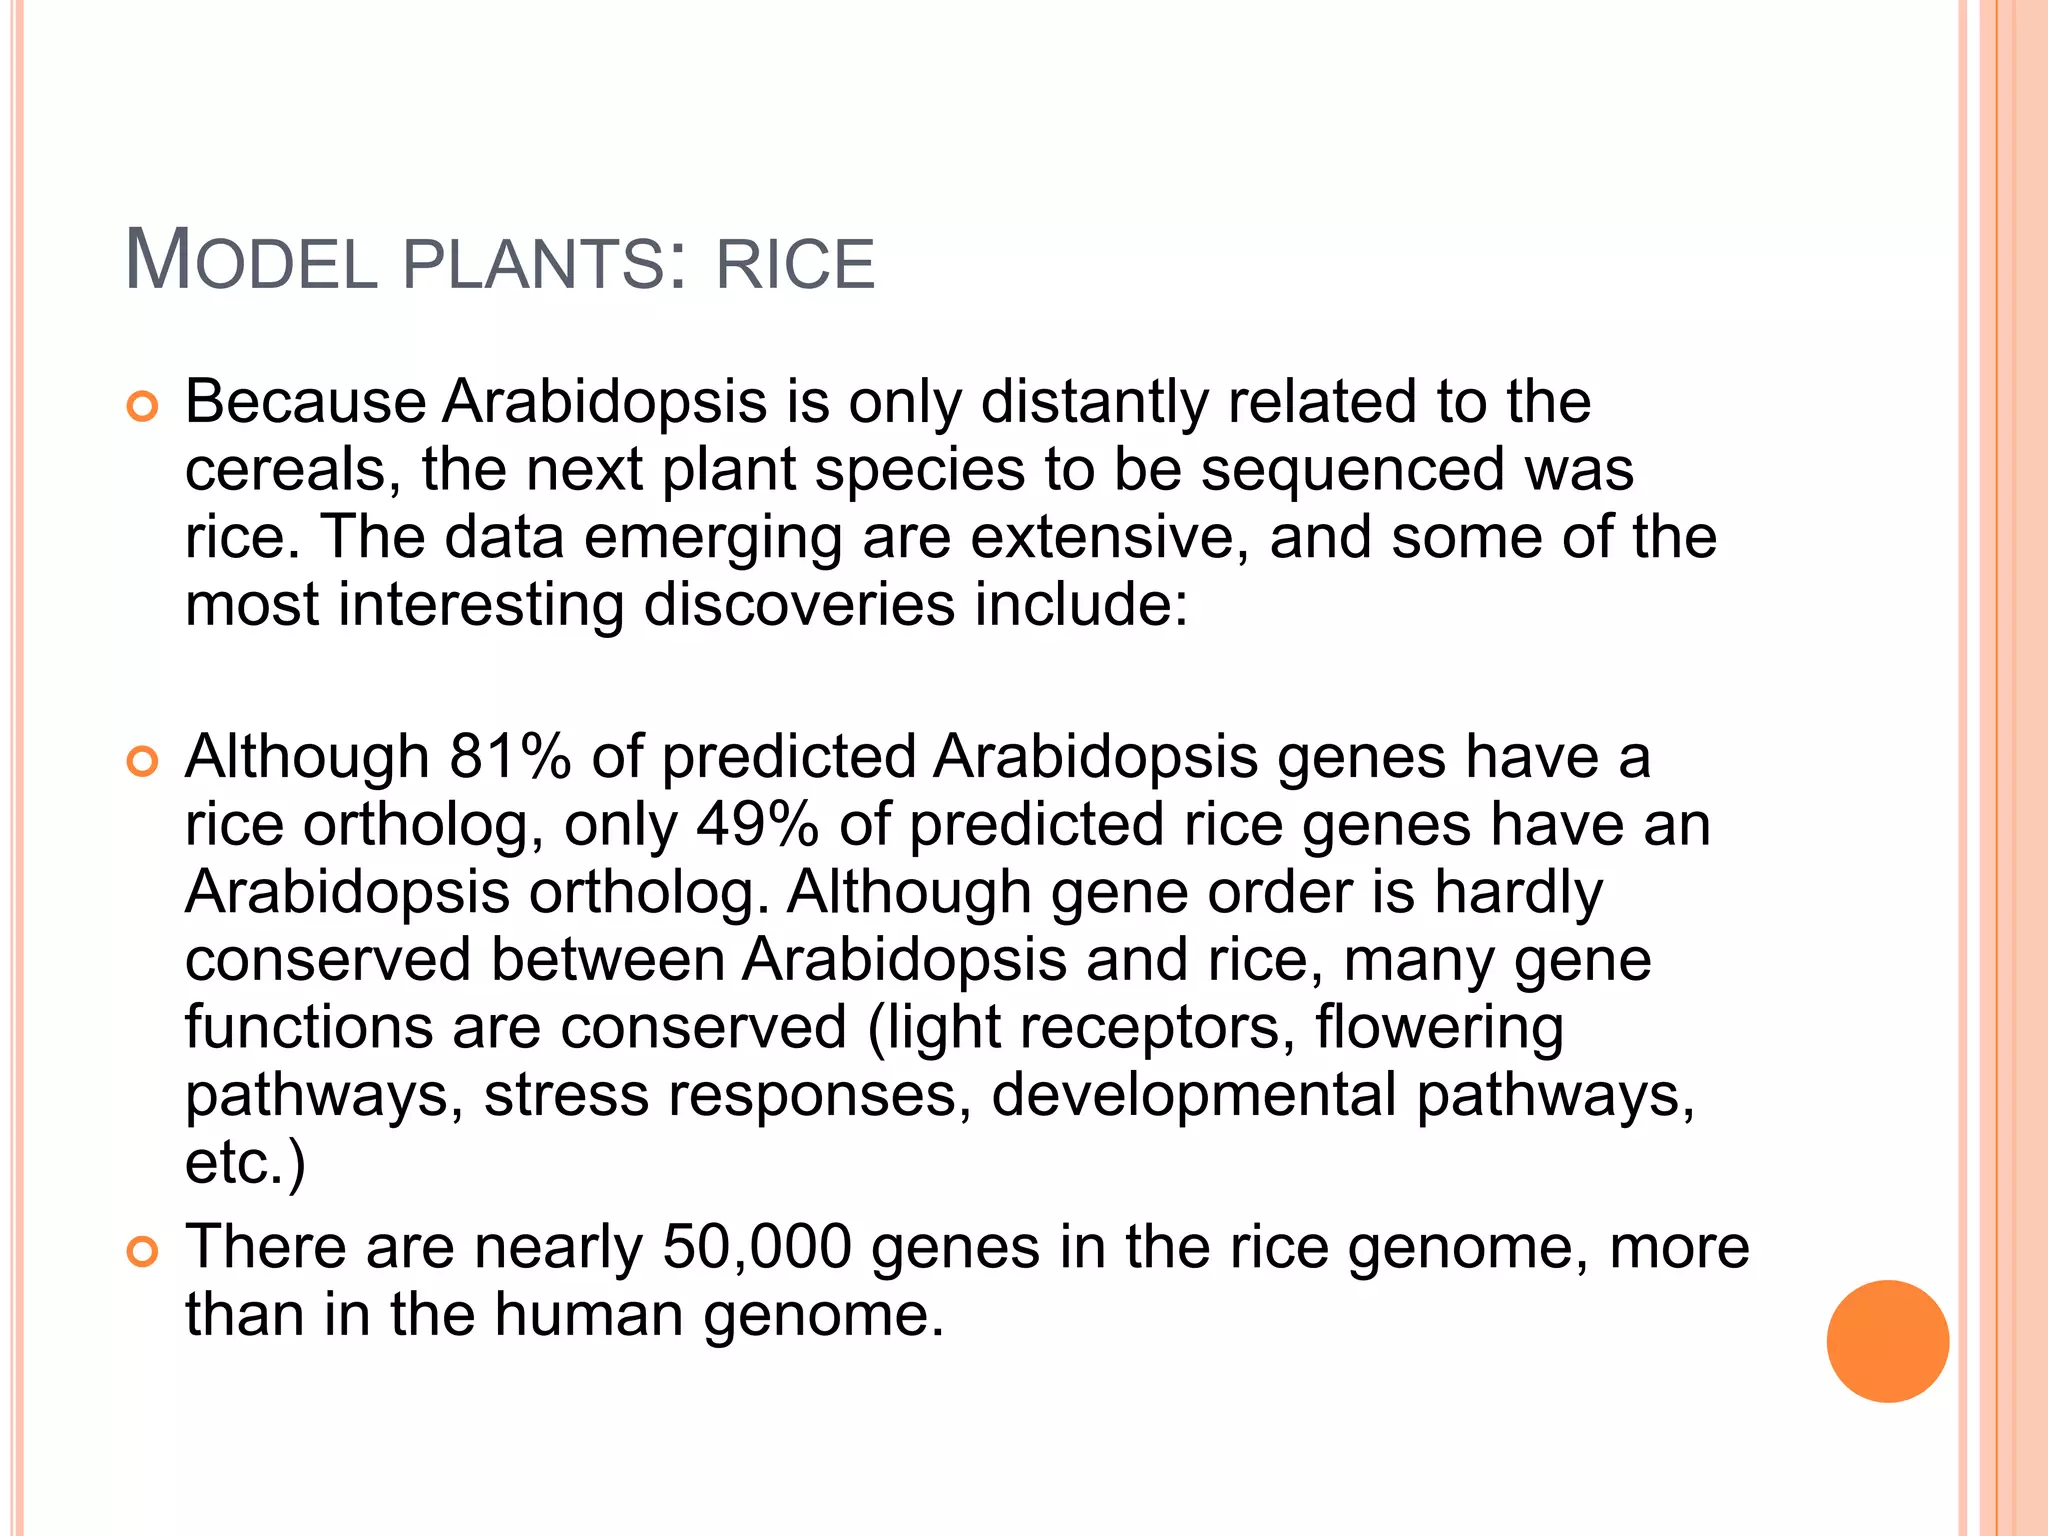
MODEL PLANTS: RICE
Because Arabidopsis is only distantly related to the
cereals, the next plant species to be sequenced was
rice. The data emerging are extensive, and some of the
most interesting discoveries include:
Although 81% of predicted Arabidopsis genes have a
rice ortholog, only 49% of predicted rice genes have an
Arabidopsis ortholog. Although gene order is hardly
conserved between Arabidopsis and rice, many gene
functions are conserved (light receptors, flowering
pathways, stress responses, developmental pathways,
etc.)
There are nearly 50,000 genes in the rice genome, more
than in the human genome.
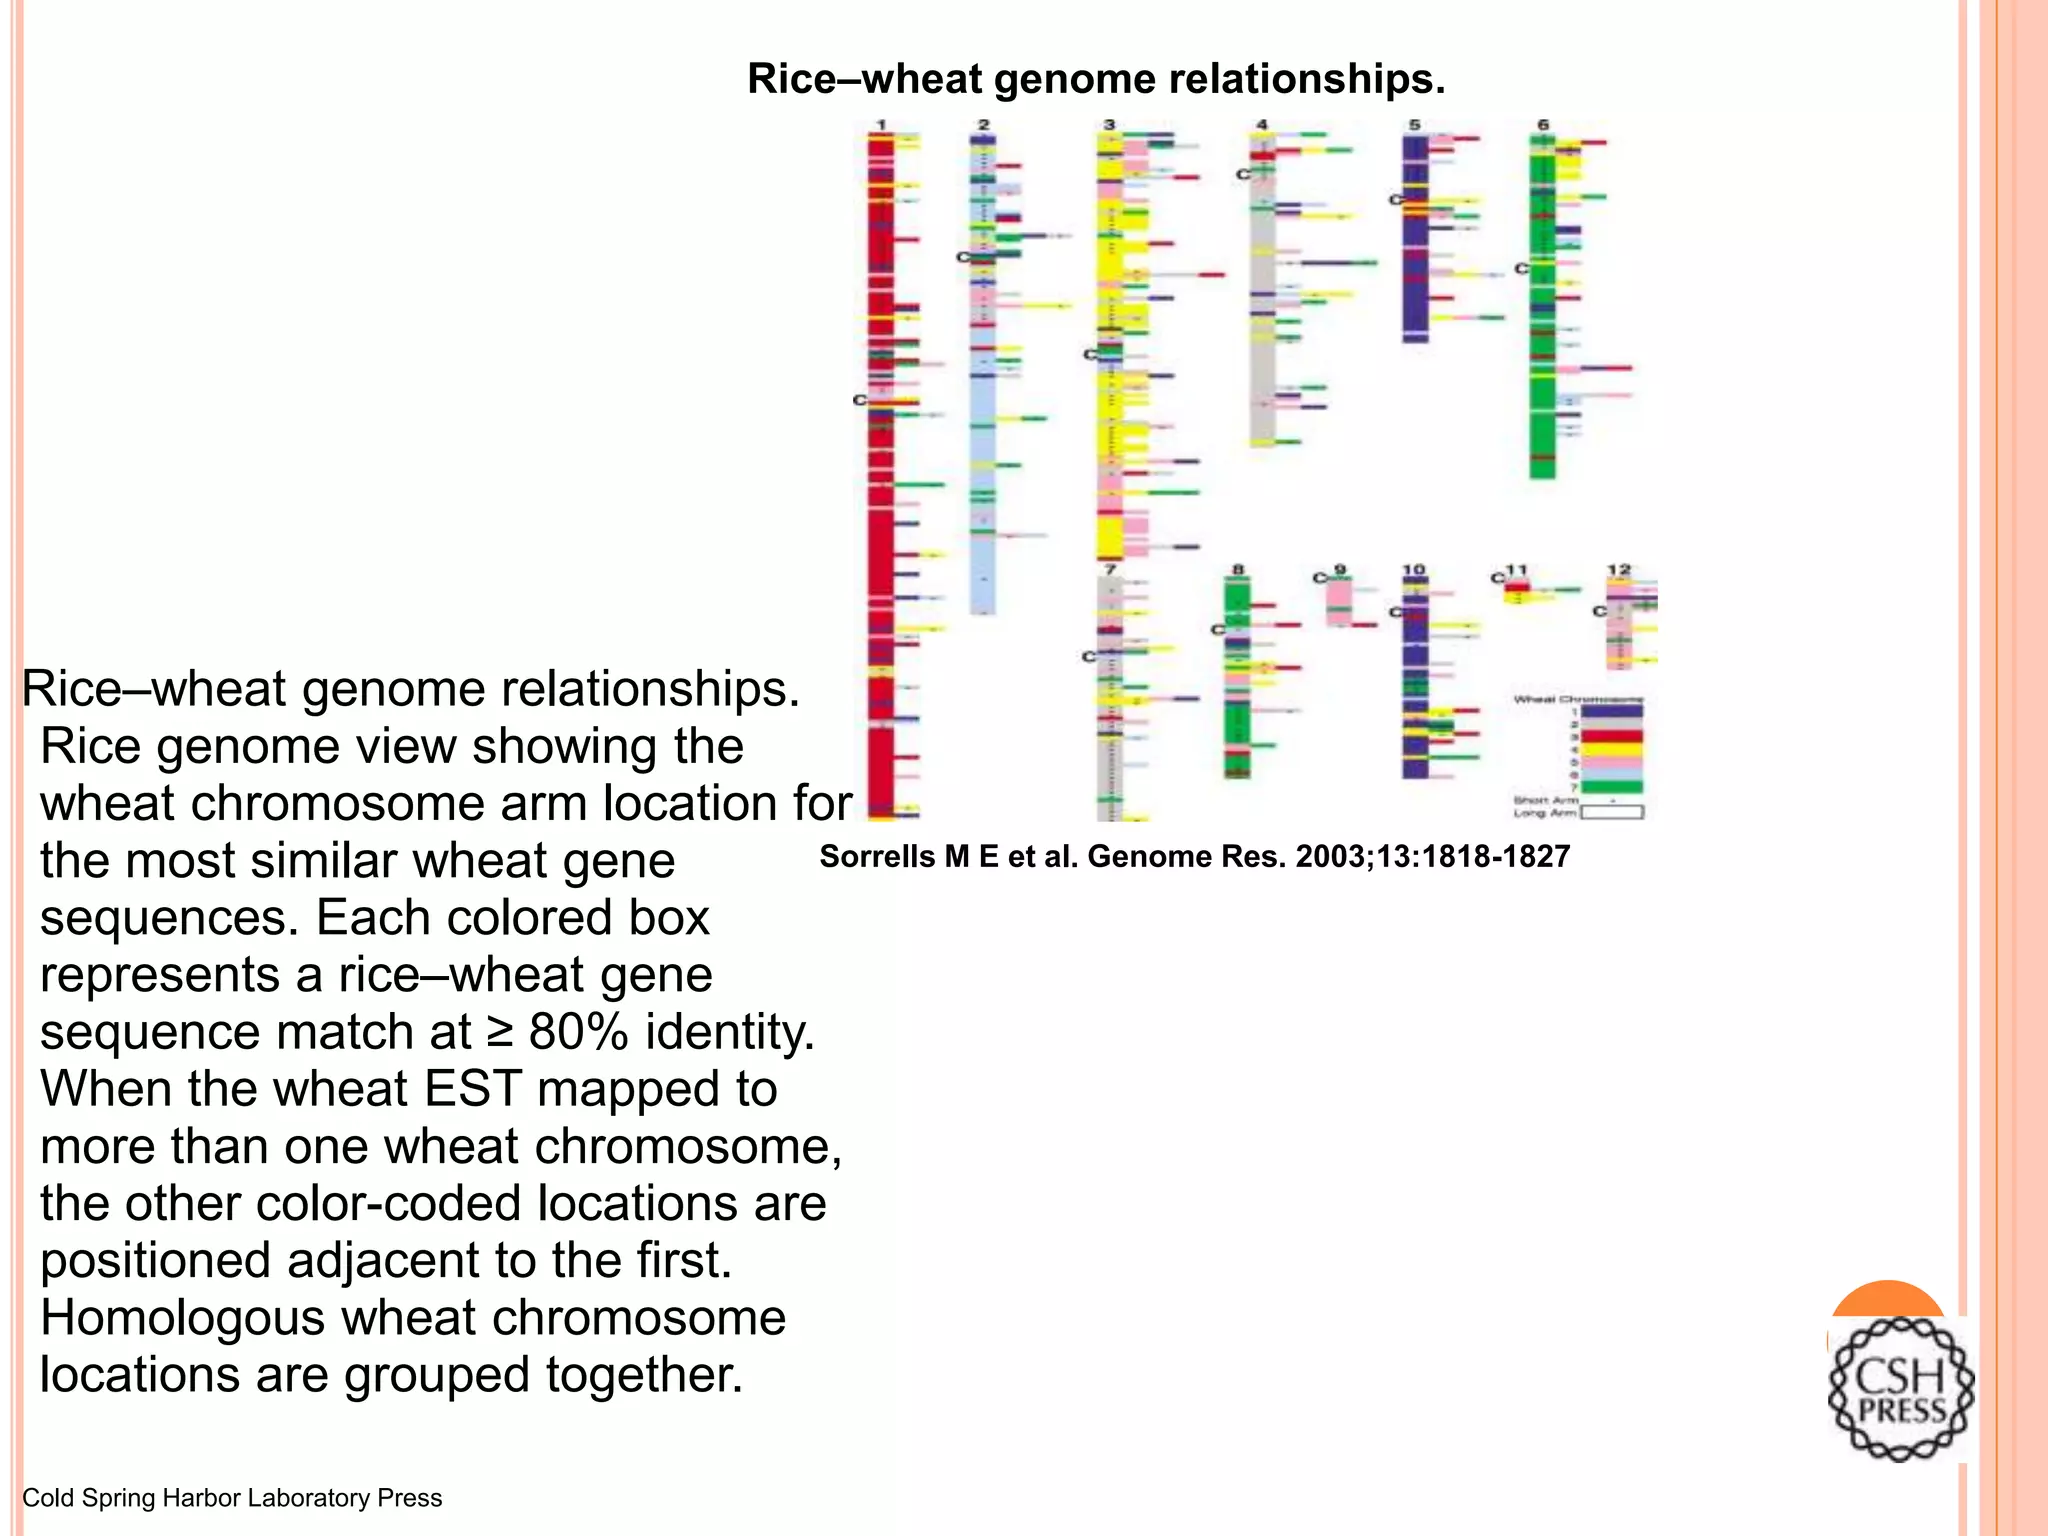
Rice–wheat genome relationships.
SorrellsM E et al. Genome Res. 2003;13:1818-1827
Cold Spring Harbor Laboratory Press
Rice–wheat genome relationships.
Rice genome view showing the
wheat chromosome arm location for
the most similar wheat gene
sequences. Each colored box
represents a rice–wheat gene
sequence match at ≥ 80% identity.
When the wheat EST mapped to
more than one wheat chromosome,
the other color-coded locations are
positioned adjacent to the first.
Homologous wheat chromosome
locations are grouped together.
22.
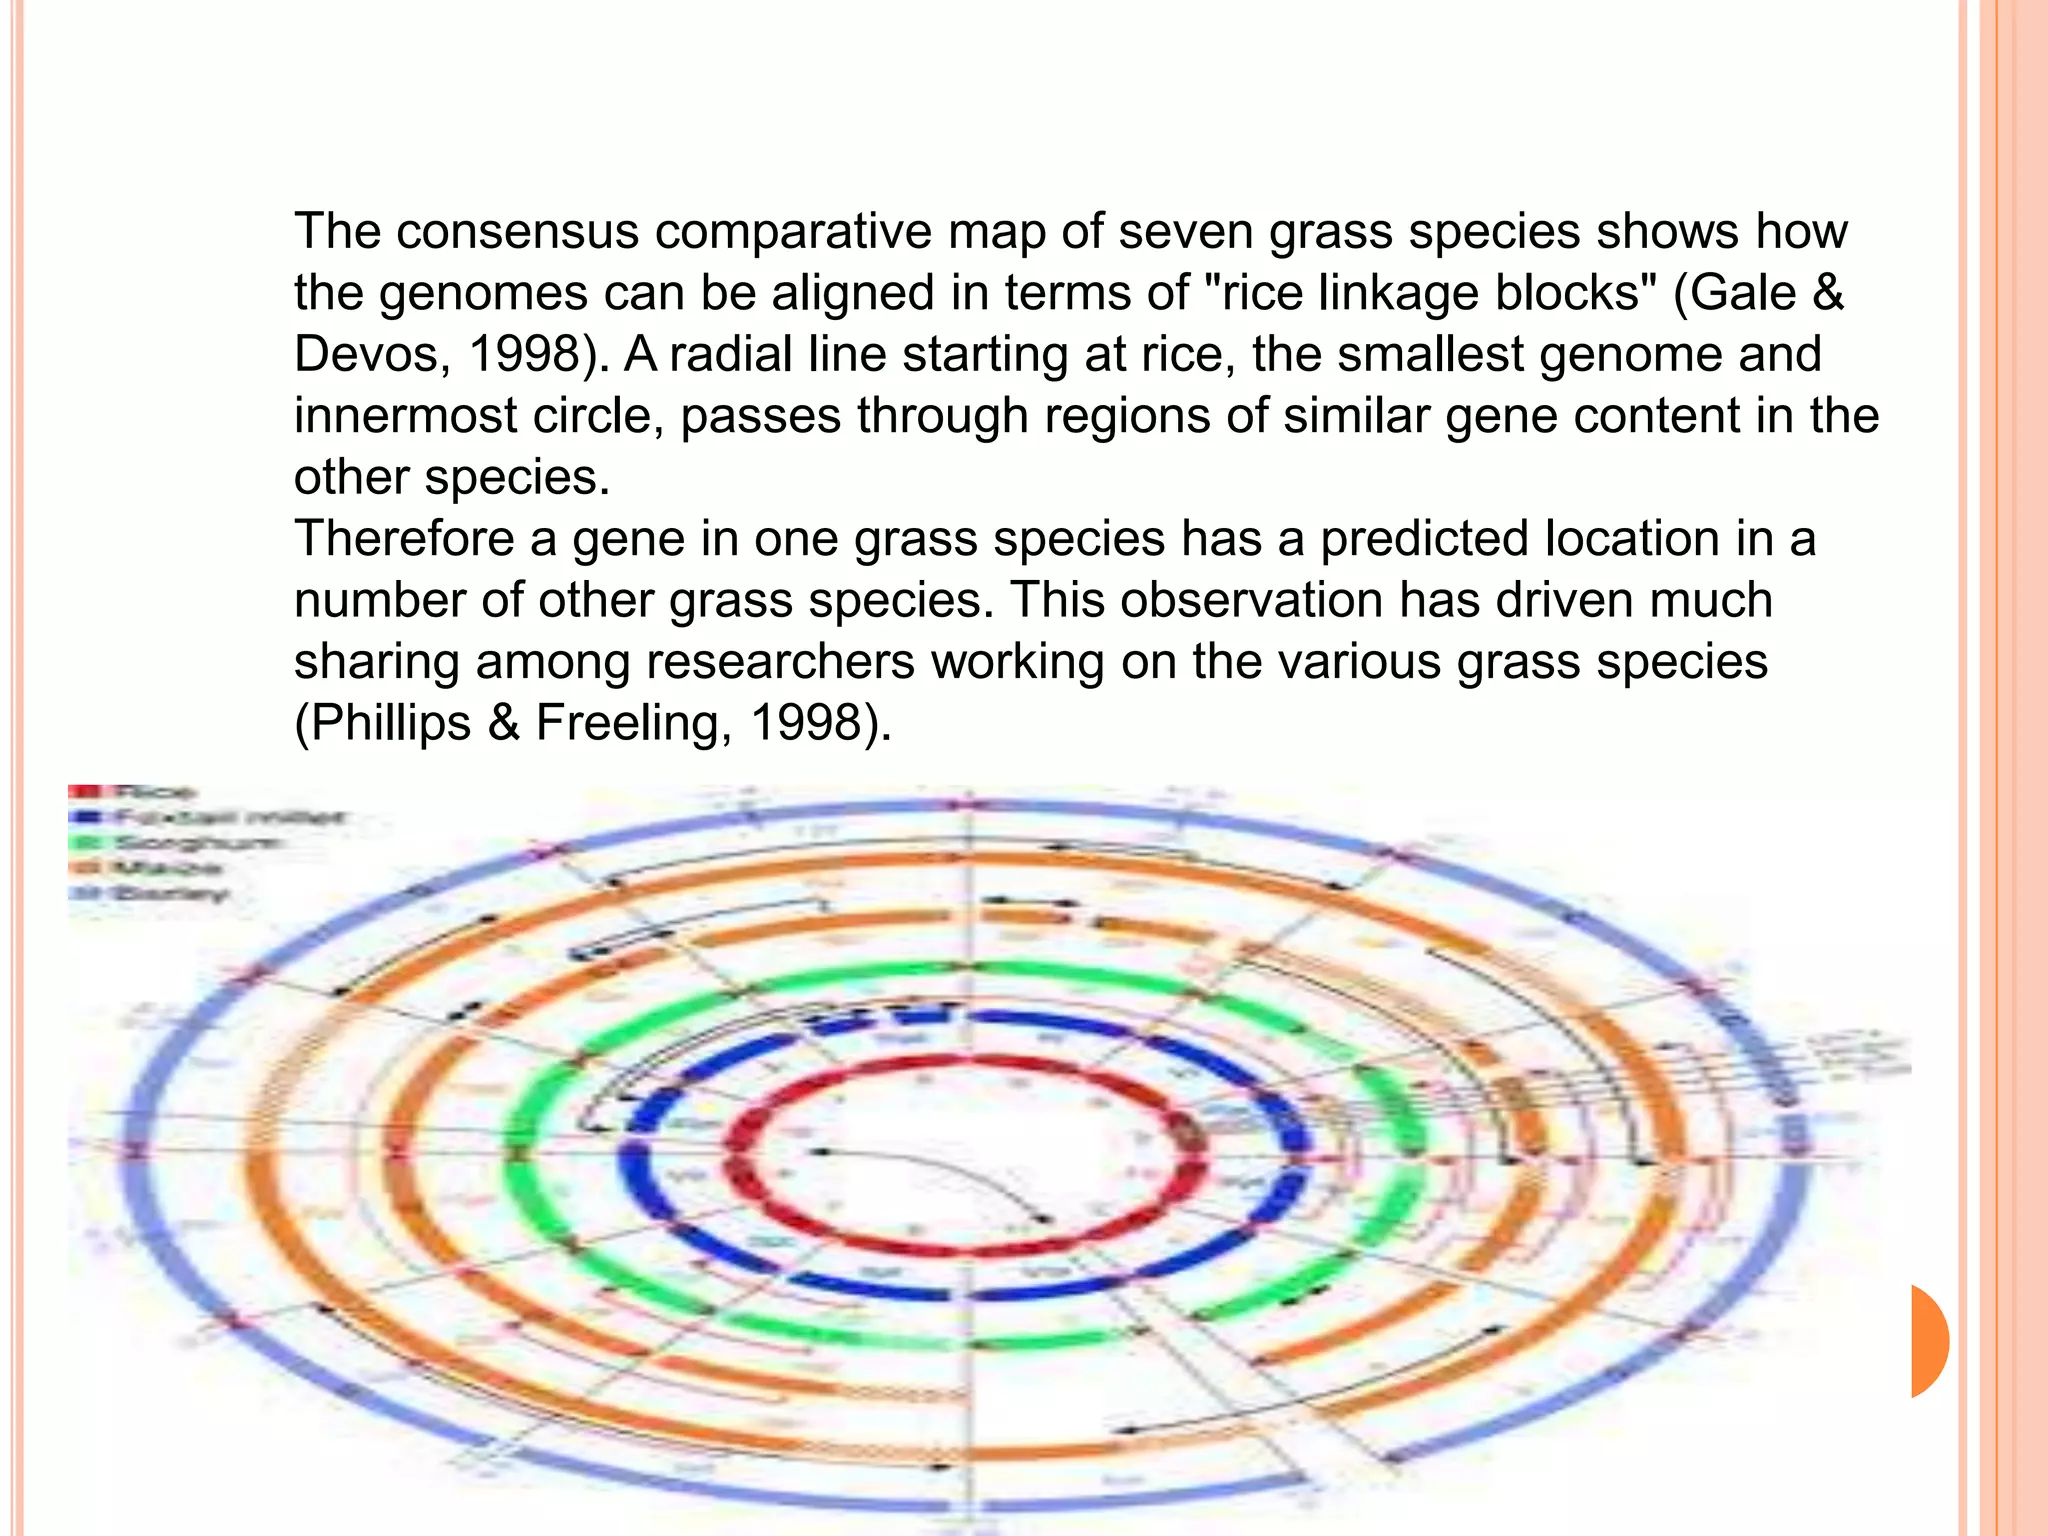
The consensus comparativemap of seven grass species shows how
the genomes can be aligned in terms of "rice linkage blocks" (Gale &
Devos, 1998). A radial line starting at rice, the smallest genome and
innermost circle, passes through regions of similar gene content in the
other species.
Therefore a gene in one grass species has a predicted location in a
number of other grass species. This observation has driven much
sharing among researchers working on the various grass species
(Phillips & Freeling, 1998).
23.
The consensus mapdemonstrated several fundamental points
regarding plant genomes: The conservation of gene order in the grasses is
good enough to make predictions of the locations of genes in these crop
species, although the level of resolution depends on the closeness of the
relationship between the species being compared.
The rice genome is more like the ancestral grass genome than those of the
other cereals. Major chromosomal rearrangements have taken place during
the evolution of the other grasses
24.
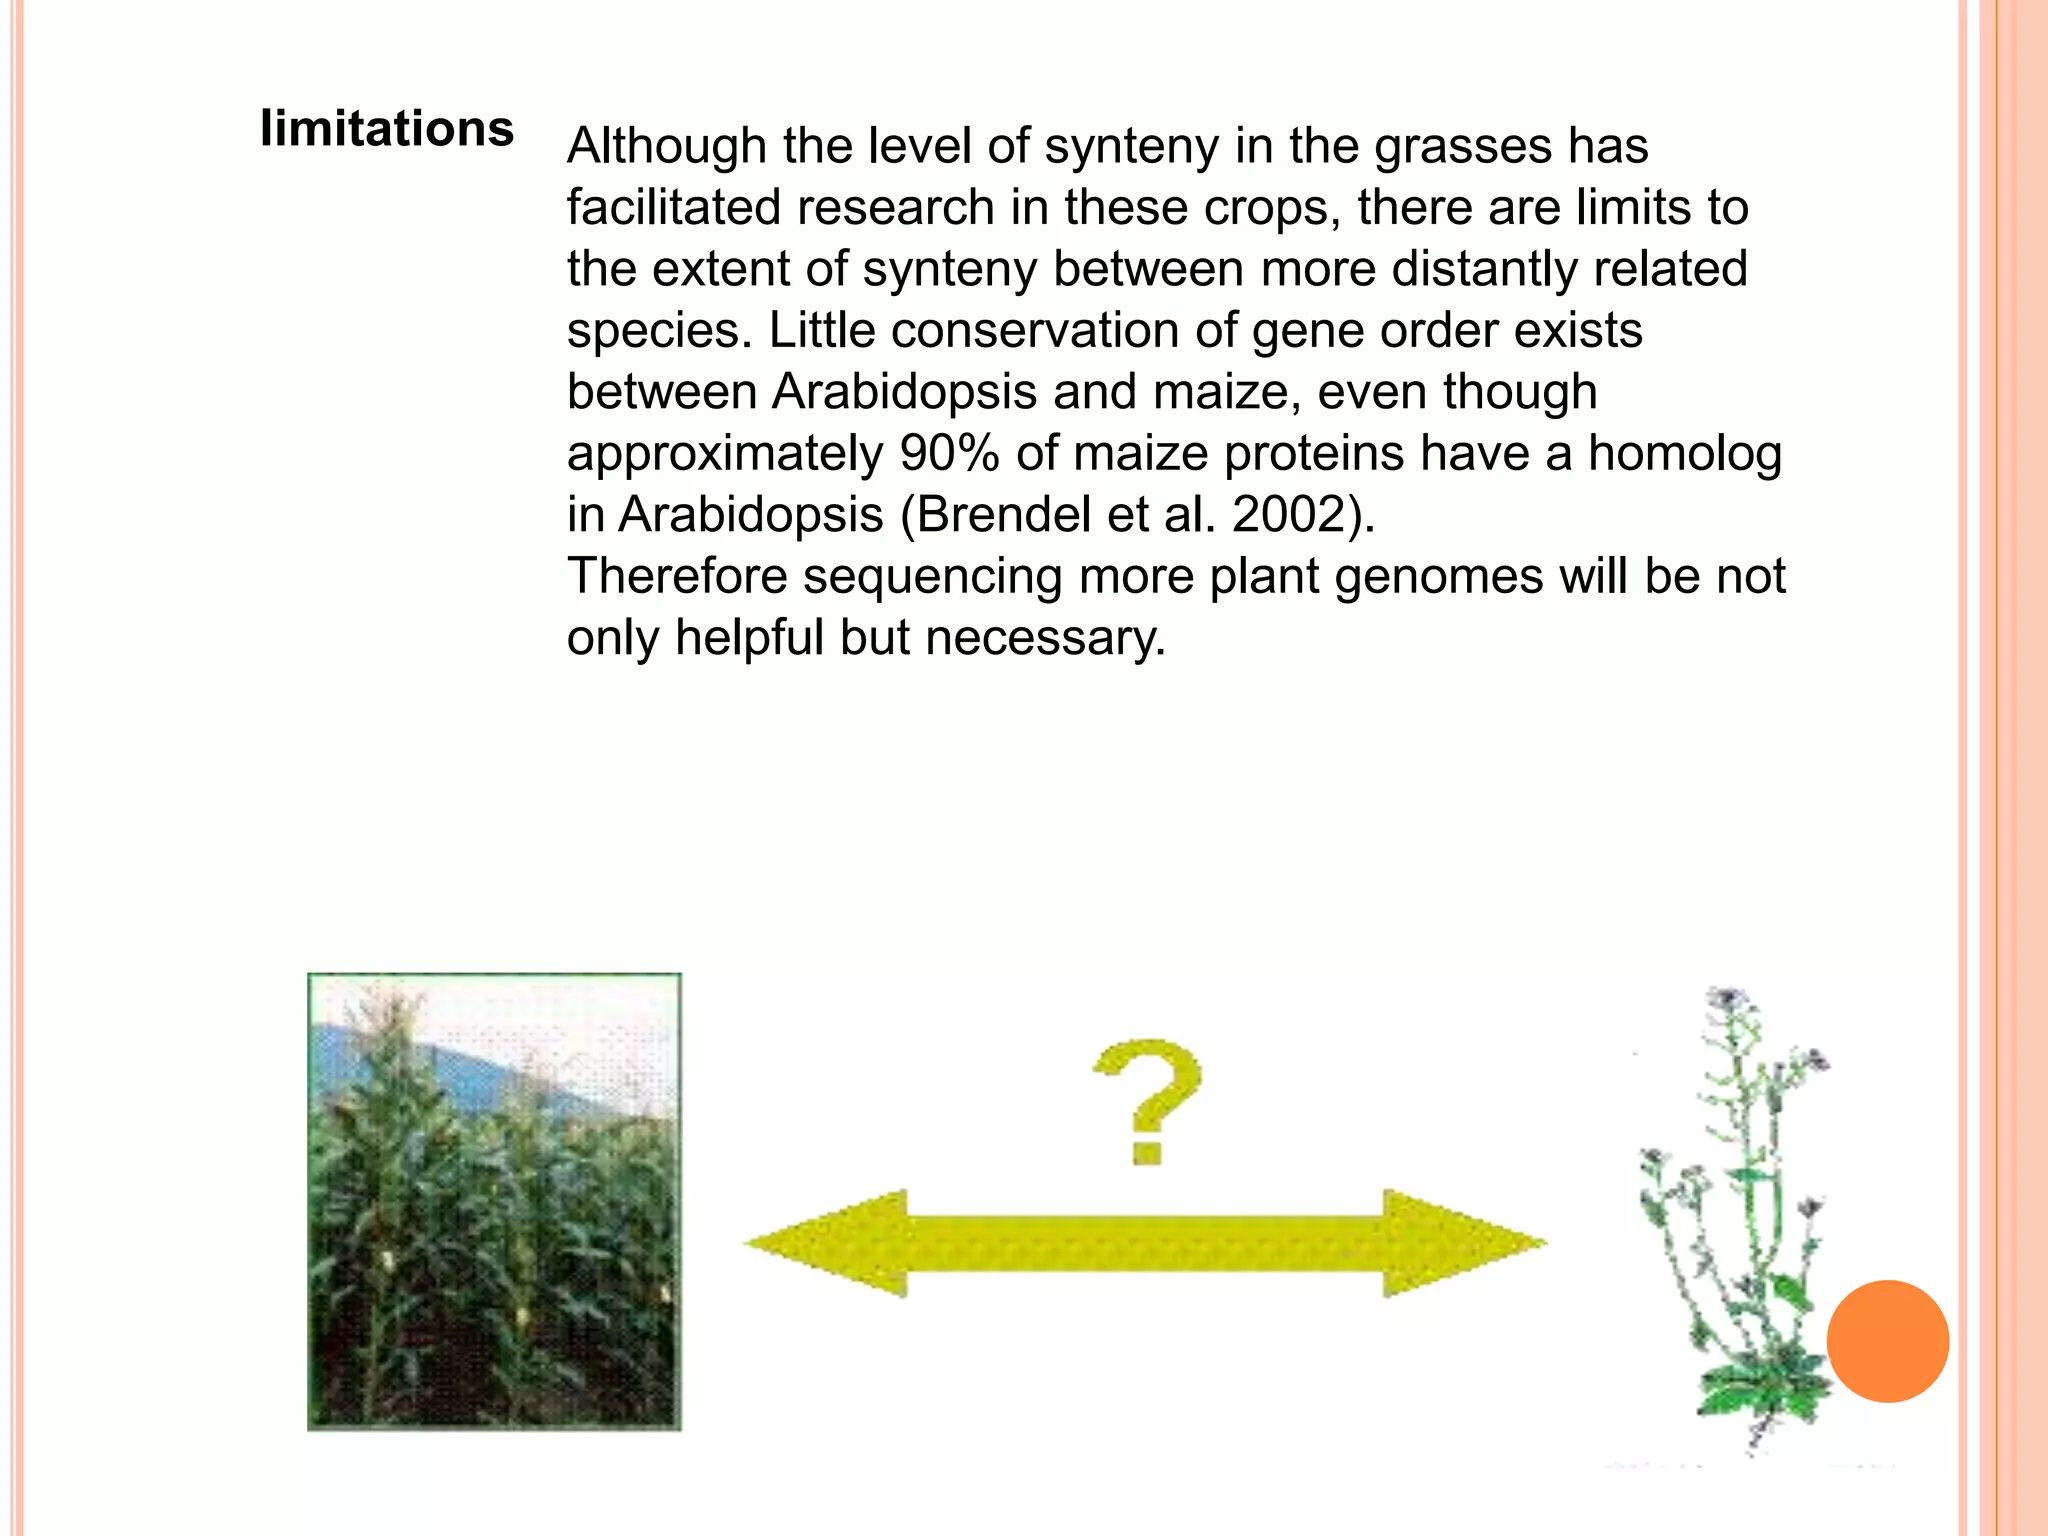
limitations Although thelevel of synteny in the grasses has
facilitated research in these crops, there are limits to
the extent of synteny between more distantly related
species. Little conservation of gene order exists
between Arabidopsis and maize, even though
approximately 90% of maize proteins have a homolog
in Arabidopsis (Brendel et al. 2002).
Therefore sequencing more plant genomes will be not
only helpful but necessary.
25.
Cultivated wheat iseither tetraploid (twice
the wild type chromosome number) or
hexaploid (triple the wild type chromosome
number). Many other crop species are
polyploid, including cotton (4x), oat (6x),
canola (4x), potato (4x), banana (3x),
sugar cane (16x) etc
26.
The future ofcomparative genomics
Miller et al. (2004) have provided a
comprehensive overview of what has been
learned from comparative genomics, and
what the future holds. Their "wish list" for
future advances includes:
Alignment software which can
automatically and accurately handle a wide
spectrum of sequences.
- Better tools to identify well-conserved
regions within long alignments.
Precise and comprehensive formulations of
the genome comparison problem (e.g.
whole genome alignment).
- Improved methods to evaluate genome-
alignment software.
- Improved tools for linking alignments to
other sequence-based information.
27.
IMPACT OF COMPARATIVEGENOMICS
The impact of comparative genomics will be far-
reaching. For example: "The genomic revolution is
having a tremendous impact on the study of natural
variation. It is making it possible finally to discover the
molecular basis of complex traits, a fundamental
question in evolutionary biology, and a question of
immense practical importance in many other fields."
(Borevitz & Nordborg, 2003)
This will not only help us understand biology better, but
aid in our exploitation of natural diversity for
crop improvement,
plant breeding efforts and
biodiversity conservation.
These are all important to the quality of life on earth.
Editor's Notes
#22 Rice–wheat genome relationships. Rice genome view showing the wheat chromosome arm location for the most similar wheat gene sequences. Each colored box represents a rice–wheat gene sequence match at ≥ 80% identity. When the wheat EST mapped to more than one wheat chromosome, the other color-coded locations are positioned adjacent to the first. Homologous wheat chromosome locations are grouped together. Rice BAC/PAC sequences that did not match any wheat sequence as well as redundant matches are omitted. The rice centromere location is indicated by `C'.