Download to read offline
![International Research Journal of Engineering and Technology (IRJET) e-ISSN: 2395-0056
Volume: 04 Issue: 07 | July -2017 www.irjet.net p-ISSN: 2395-0072
© 2017, IRJET | Impact Factor value: 5.181 | ISO 9001:2008 Certified Journal | Page 1724
Brain Tumor Classification using Support Vector Machine
N.Vani1, A.Sowmya2, N.Jayamma3
1,2,3Assistant Professor, Dept of electronics & Communication Engineering,SBIT college,Telangana,India
---------------------------------------------------------------------***---------------------------------------------------------------------
Abstract - Object detection plays a major role in many
areas like medical imaging, aerial surveillance, optimal
manipulation and analysis, surgical microscopes, etc. The
objective of this paper is to develop a model for brain
tumors detection and classification i.e., to classify whether
the tumor is cancerous or non-cancerous using SVM
algorithm. Earlier many have detected using ANN which
works on Empirical Risk Minimization. We are using
Support Vector Machine algorithm that works on structural
risk minimization to classify the images. The SVM algorithm
is applied to medical images for the tumor extraction, and a
Simulink model is developed for the tumor classification
function. This paper presents a prototype for SVM-based
object detection, which classifies the images and evaluates
whether the classified image is cancerous or non-cancerous.
Key Words: Image processing, SVM, Simulink, Object
detection
1.INTRODUCTION
Brain tumors are the most common issue in children.
Approximately 3,410 children and adolescents under age
20 are diagnosed with primary brain tumors each year.
Brain tumors, either malignant or benign, that originate in
the cells of the brain. Brain tumor detection and
segmentation in magnetic resonance images (MRI)
because it provides information associated with
anatomical structures as well as potential abnormal
tissues necessary to treatment planning and patient
follow-up. The segmentation of brain tumors can likewise
be useful for general demonstrating of neurotic brains and
the development of obsessive cerebrum brain atlases. [1]
Upgrades in database innovation, figuring execution
and man-made brainpower have added to the
improvement of clever information investigation.
The support vector machine has been created as a
hearty apparatus for order and relapse in loud, complex
spaces. Not at all like conventional strategies which limit
the observational preparing mistake. Bolster vector
machine goes for limiting an upper bound of the
speculation mistake through amplifying the edge between
isolating hyper plane and the information. This
can be viewed as a surmised usage of the Structure Risk
Minimization guideline.
By picking various types of bits, bolster vector machine
can understand Radial Basis Function (RBF), polynomial,
straight, and multi-layer preceptor classifiers.
A Simulink demonstrates is created for tumor grouping
where is characterizes whether the tumor is dangerous or
non-carcinogenic. Where Simulink is a piece chart
condition for multi area reenactment and model-based
plan. It bolsters reenactment, programmed code era and
consistent test and check of implanted frameworks.
Simulink gives a graphical proofreader, adaptable piece
libraries, and solvers for demonstrating and reenacting
dynamic frameworks,
The paper is organized as: Section 2 explains a brief
overview of SVMs and object detection in Section 2. An
overview of related SVM implementation is presented in
Section 3 and the brain tumor classification and its
evaluation are presented in Section 4. Finally, Section 5
concludes the paper, with some possible future directions.
2. Support Vector Machine
A support vector machine (SVM) is a supervised learning
algorithm based on statistical learning theory. Given a
labeled data set (training set), D= {|x,y||x data sample,
y class label}, an SVM tries to compute a mapping
function f such that f(x) = y for all samples in the data set.
This mapping function describes the relationship between
the data samples and their respective class labels; and is
used to classify new unknown data. Classification in the
context of SVMs is done using the following classification
decision function (a process called the feed-forward phase)
( ) (∑ ( ) )
in which are the alpha coefficients, are the
class labels of the support vectors, are the support
vectors, z is the input vector, K(z, ) is the chosen kernel
function, and b is the bias.
Linear : K(x, z) = x●z,
Polynomial : K(x, z) = ((x●z)+1)d , d>0,
RBF : K(x, z) = exp(-||x-z||2 /(2σ2)).
Support Vector Machines – Explores the idea of
transforming the input domain into high dimensional
space to optimize over best of the best classification
function which otherwise is capable to realize. SVM can
realize RBF and multi-layer perceptron.](https://image.slidesharecdn.com/irjet-v4i7367-170906094829/85/Brain-Tumor-Classification-using-Support-Vector-Machine-1-320.jpg)
![International Research Journal of Engineering and Technology (IRJET) e-ISSN: 2395-0056
Volume: 04 Issue: 07 | July -2017 www.irjet.net p-ISSN: 2395-0072
© 2017, IRJET | Impact Factor value: 5.181 | ISO 9001:2008 Certified Journal | Page 1724
Brain Tumor Classification using Support Vector Machine
N.Vani1, A.Sowmya2, N.Jayamma3
1,2,3Assistant Professor, Dept of electronics & Communication Engineering,SBIT college,Telangana,India
---------------------------------------------------------------------***---------------------------------------------------------------------
Abstract - Object detection plays a major role in many
areas like medical imaging, aerial surveillance, optimal
manipulation and analysis, surgical microscopes, etc. The
objective of this paper is to develop a model for brain
tumors detection and classification i.e., to classify whether
the tumor is cancerous or non-cancerous using SVM
algorithm. Earlier many have detected using ANN which
works on Empirical Risk Minimization. We are using
Support Vector Machine algorithm that works on structural
risk minimization to classify the images. The SVM algorithm
is applied to medical images for the tumor extraction, and a
Simulink model is developed for the tumor classification
function. This paper presents a prototype for SVM-based
object detection, which classifies the images and evaluates
whether the classified image is cancerous or non-cancerous.
Key Words: Image processing, SVM, Simulink, Object
detection
1.INTRODUCTION
Brain tumors are the most common issue in children.
Approximately 3,410 children and adolescents under age
20 are diagnosed with primary brain tumors each year.
Brain tumors, either malignant or benign, that originate in
the cells of the brain. Brain tumor detection and
segmentation in magnetic resonance images (MRI)
because it provides information associated with
anatomical structures as well as potential abnormal
tissues necessary to treatment planning and patient
follow-up. The segmentation of brain tumors can likewise
be useful for general demonstrating of neurotic brains and
the development of obsessive cerebrum brain atlases. [1]
Upgrades in database innovation, figuring execution
and man-made brainpower have added to the
improvement of clever information investigation.
The support vector machine has been created as a
hearty apparatus for order and relapse in loud, complex
spaces. Not at all like conventional strategies which limit
the observational preparing mistake. Bolster vector
machine goes for limiting an upper bound of the
speculation mistake through amplifying the edge between
isolating hyper plane and the information. This
can be viewed as a surmised usage of the Structure Risk
Minimization guideline.
By picking various types of bits, bolster vector machine
can understand Radial Basis Function (RBF), polynomial,
straight, and multi-layer preceptor classifiers.
A Simulink demonstrates is created for tumor grouping
where is characterizes whether the tumor is dangerous or
non-carcinogenic. Where Simulink is a piece chart
condition for multi area reenactment and model-based
plan. It bolsters reenactment, programmed code era and
consistent test and check of implanted frameworks.
Simulink gives a graphical proofreader, adaptable piece
libraries, and solvers for demonstrating and reenacting
dynamic frameworks,
The paper is organized as: Section 2 explains a brief
overview of SVMs and object detection in Section 2. An
overview of related SVM implementation is presented in
Section 3 and the brain tumor classification and its
evaluation are presented in Section 4. Finally, Section 5
concludes the paper, with some possible future directions.
2. Support Vector Machine
A support vector machine (SVM) is a supervised learning
algorithm based on statistical learning theory. Given a
labeled data set (training set), D= {|x,y||x data sample,
y class label}, an SVM tries to compute a mapping
function f such that f(x) = y for all samples in the data set.
This mapping function describes the relationship between
the data samples and their respective class labels; and is
used to classify new unknown data. Classification in the
context of SVMs is done using the following classification
decision function (a process called the feed-forward phase)
( ) (∑ ( ) )
in which are the alpha coefficients, are the
class labels of the support vectors, are the support
vectors, z is the input vector, K(z, ) is the chosen kernel
function, and b is the bias.
Linear : K(x, z) = x●z,
Polynomial : K(x, z) = ((x●z)+1)d , d>0,
RBF : K(x, z) = exp(-||x-z||2 /(2σ2)).
Support Vector Machines – Explores the idea of
transforming the input domain into high dimensional
space to optimize over best of the best classification
function which otherwise is capable to realize. SVM can
realize RBF and multi-layer perceptron.](https://image.slidesharecdn.com/irjet-v4i7367-170906094829/75/Brain-Tumor-Classification-using-Support-Vector-Machine-1-2048.jpg)

![International Research Journal of Engineering and Technology (IRJET) e-ISSN: 2395-0056
Volume: 04 Issue: 07 | July -2017 www.irjet.net p-ISSN: 2395-0072
© 2017, IRJET | Impact Factor value: 5.181 | ISO 9001:2008 Certified Journal | Page 1728
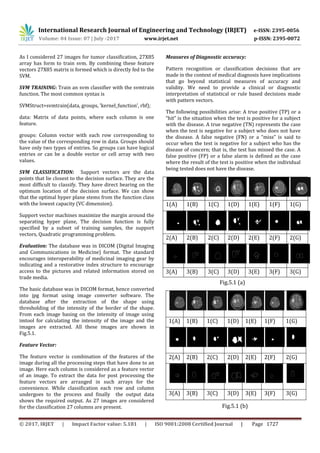
1(A) 1(B) 1(C) 1(D) 1(E) 1(F) 1(G)
2(A) 2(B) 2(C) 2(D) 2(E) 2(F) 2(G)
3(A) 3(B) 3(C) 3(D) 3(E) 3(F) 3(G)
Fig.5.1 (c)
1(A) 1(B) 1(C) 1(D) 1(E) 1(F)
2(A) 2(B) 2(C) 2(D) 2(E) 2(F)
3(A) 3(B) 3(C) 3(D) 3(E) 3(F)
Fig.5.1 (d)
Fig.5.1 Table of images
The first row of each table is the basic images, which are
converted to jpg format from DICOM format. In addition,
the second row indicates the shape extracted images of the
corresponding basic images. Finally, the third row shows
the region extracted images respectively.
SIMULINK MODEL FOR SVM CLASSIFICATION OF
BRAIN TUMORS:
F is the matrix of the feature vectors i.e., 27X85 array that
is given as input to the svm classification function.
Moreover, the corresponding output of the svm
classification. The results are shown in the command
window of the MATLAB.
Here the count value “0” is indicated as cancerous tumor
whereas count value “1” is indicated as non-cancerous
tumor.
3. CONCLUSIONS
This paper presents an prototype for object detection
with SVMs that can achieve real-time performance while
maintaining high detection accuracies. 82% of accuracy is
obtained and the positive predictive values (PPV) 81.48%,
Negative predictive value (NPV) are calculated. The True
positive cases are 22; True negative 5, False positive 5 and
False negative are 22. Furthermore, the same prototype
can be used for different application regardless of the
window size, number of support vectors, and image size.
REFERENCES
[1] C. Cortes and V. Vapnik, “Support-Vector Networks,”
Machine Learning, vol. 20, no. 3, pp. 273-297, 1995.
[2] H. Sahbi, D. Geman, and N. Boujemaa, “Face Detection
Using Coarse-to-Fine Support Vector Classifiers,”
Proc. Int’l Conf. Image Processing, pp. 925-928,
2002.](https://image.slidesharecdn.com/irjet-v4i7367-170906094829/85/Brain-Tumor-Classification-using-Support-Vector-Machine-5-320.jpg)
![International Research Journal of Engineering and Technology (IRJET) e-ISSN: 2395-0056
Volume: 04 Issue: 07 | July -2017 www.irjet.net p-ISSN: 2395-0072
© 2017, IRJET | Impact Factor value: 5.181 | ISO 9001:2008 Certified Journal | Page 1729
[3] E. Osuna, R. Freund, and F. Girosi, “Training Support
Vector Machines: An Application to Face
Detection,” Proc. IEEE Conf. Computer Vision and
Pattern Recognition, pp. 130-136, 1997.
[4] Gudivada VN and Raghavan VV_ Content_based image
retrieval systems_IEEE Computer, 28(9):18-22,1995.
[5] Chezmar JL_ Robbins SM_ Nelson RC_ Steinberg HV_
Torres WE_ and Bernardino ME_ Adrenal masses_
Characterization with T1-weighted MR imaging_
Radiology. 166(2):357-359,1988.
[6] C.Cortes and Vapnik, “Support Vector Networks,”
Machine Learning, vol. 20, no.3, pp. 273-297, 1995.
[7] V.Vapnik, The Nature of statistical learning theory.
Springer-Verlag, 1995.
BIOGRAPHIES
N.Vani working as Assistant
Professor, SBIT & done M.Tech in
VLSI. Interested in Image
Processing.
A.Sowmya working as Assistant
Professor, SBIT & done M.Tech in
ECE. Interested in Image
Processing.
N.Jayamma working as Assistant
Professor, SBIT & done M.Tech in
ES. Interested in Signal Processing.
Figure 1](https://image.slidesharecdn.com/irjet-v4i7367-170906094829/85/Brain-Tumor-Classification-using-Support-Vector-Machine-6-320.jpg)

1) The document presents a method for classifying brain tumors as cancerous or non-cancerous using support vector machines (SVM) and image processing techniques. 2) MRI images of brain tumors are preprocessed, features are extracted, and feature vectors are generated before being classified by an SVM classifier trained on labeled tumor data. 3) The SVM model achieves high accuracy in classifying tumors, which is evaluated using measures like true positives, true negatives, false positives and false negatives. This automated classification could help in diagnosis and treatment of brain tumors.