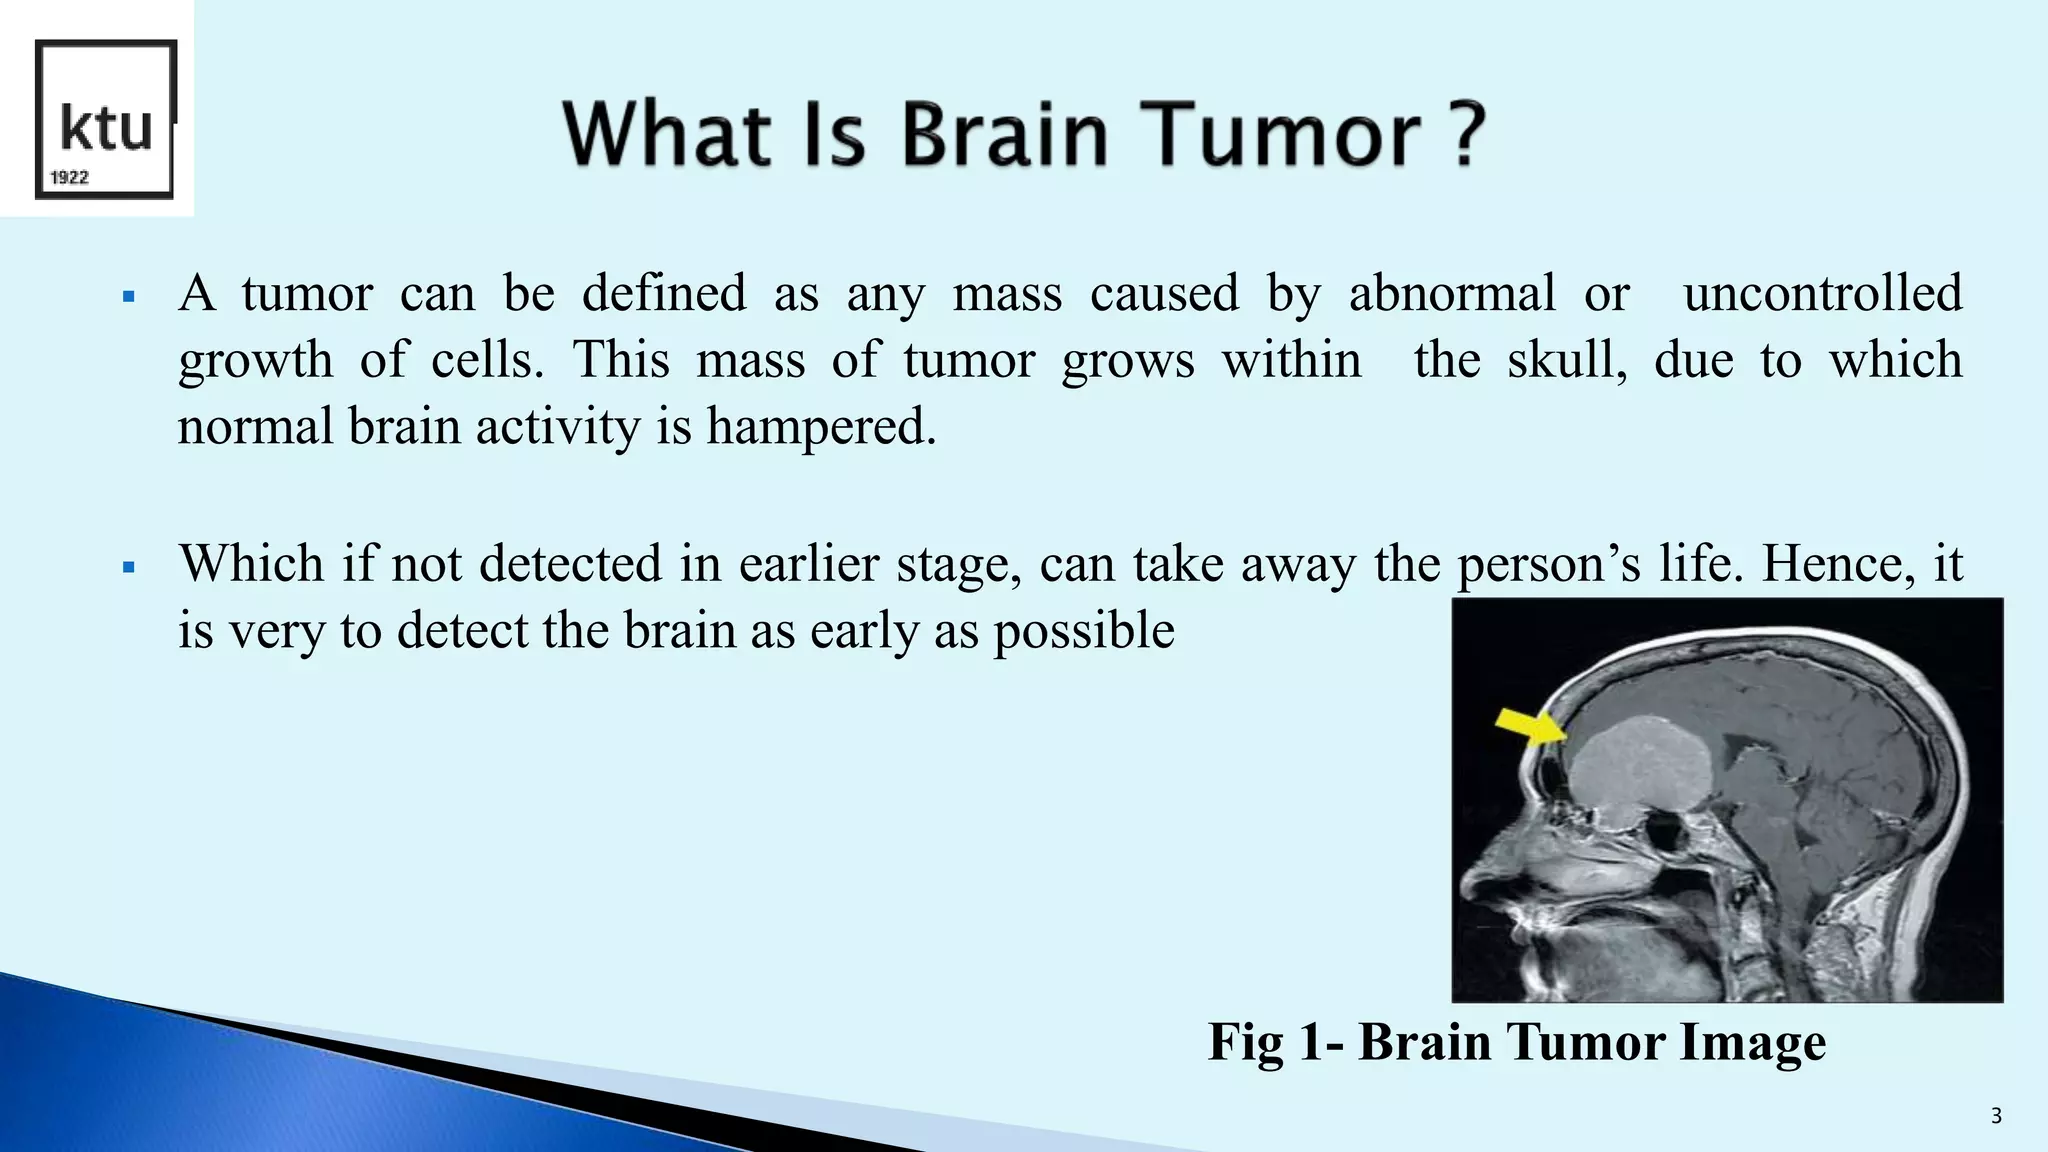
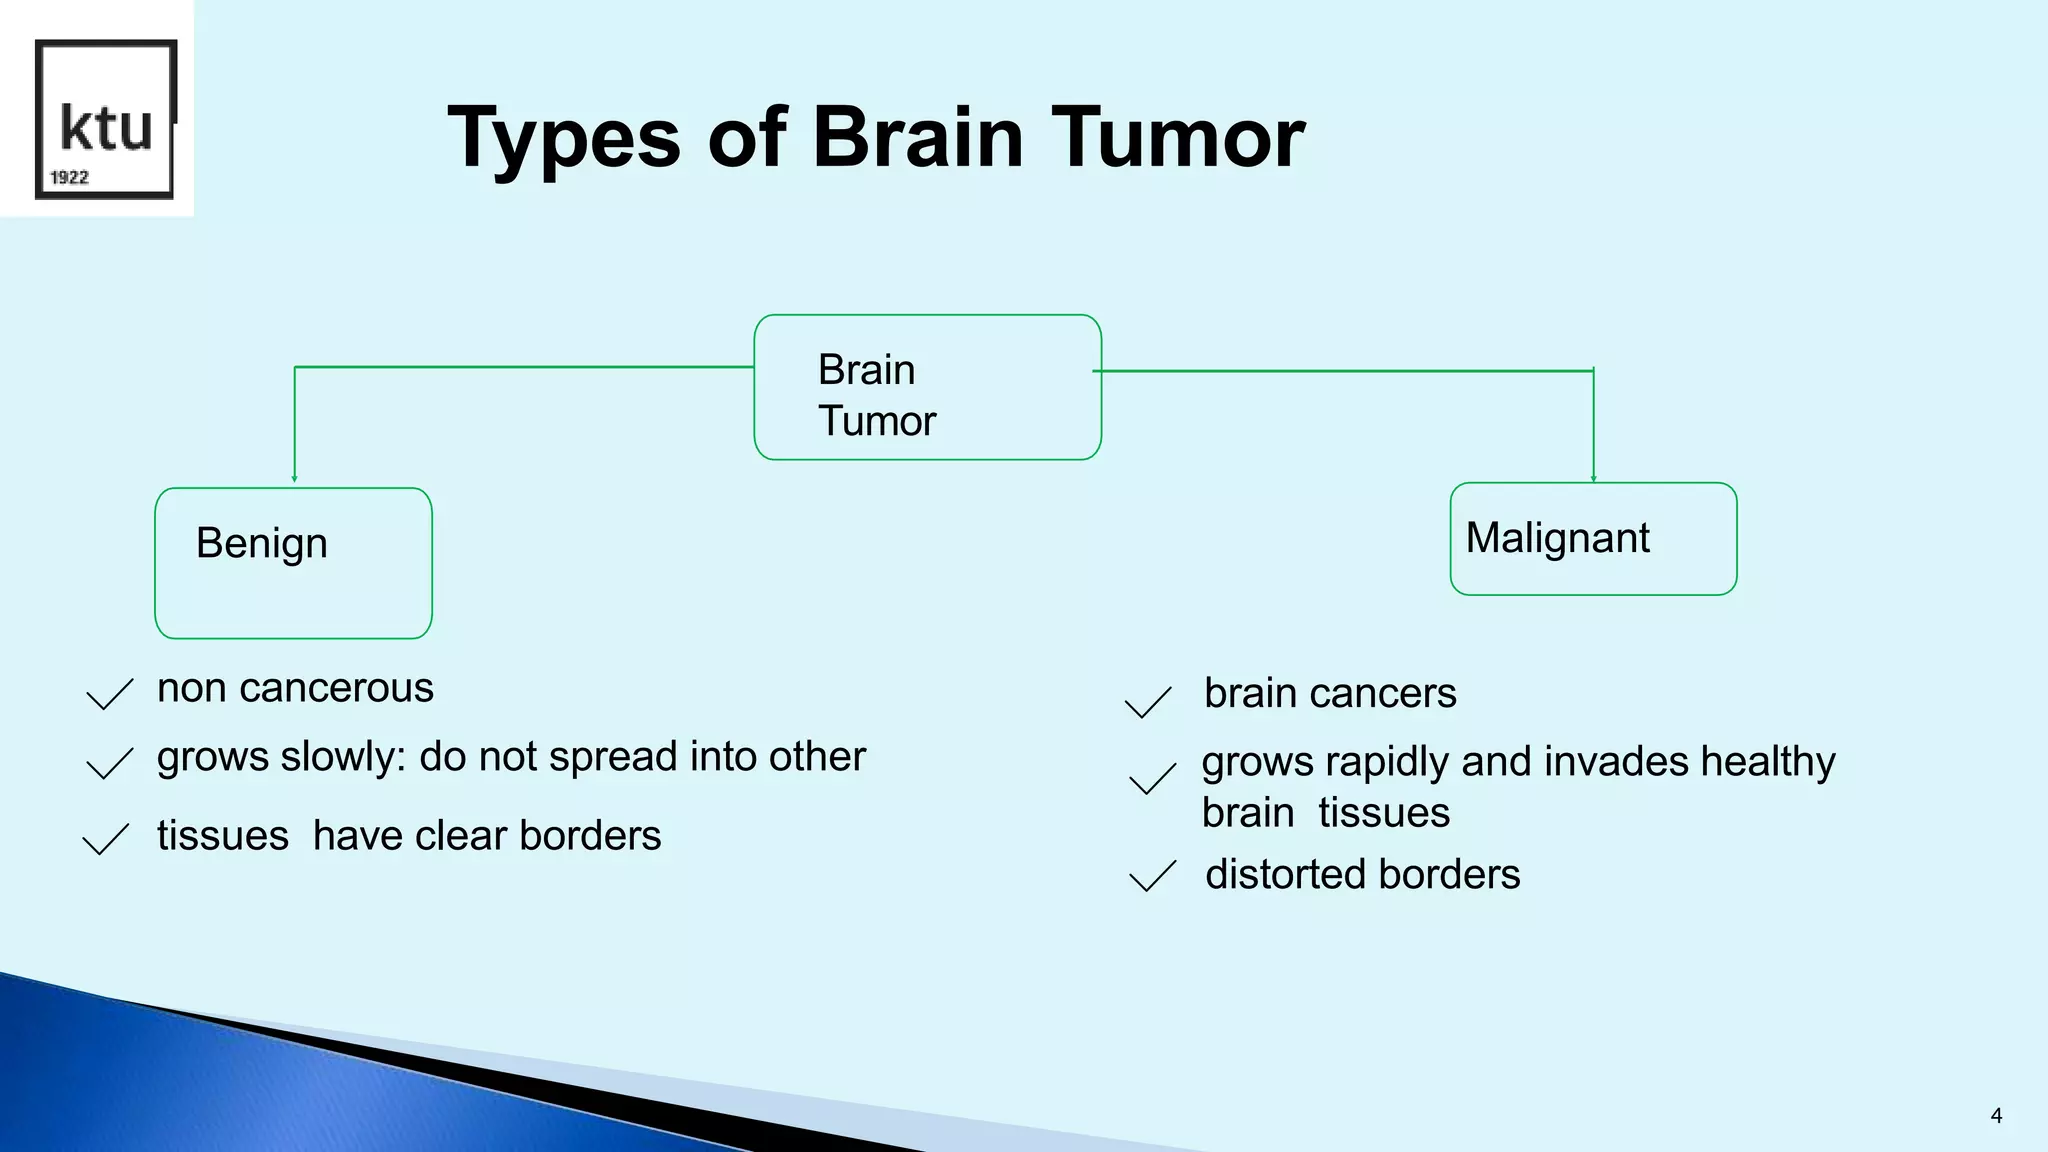
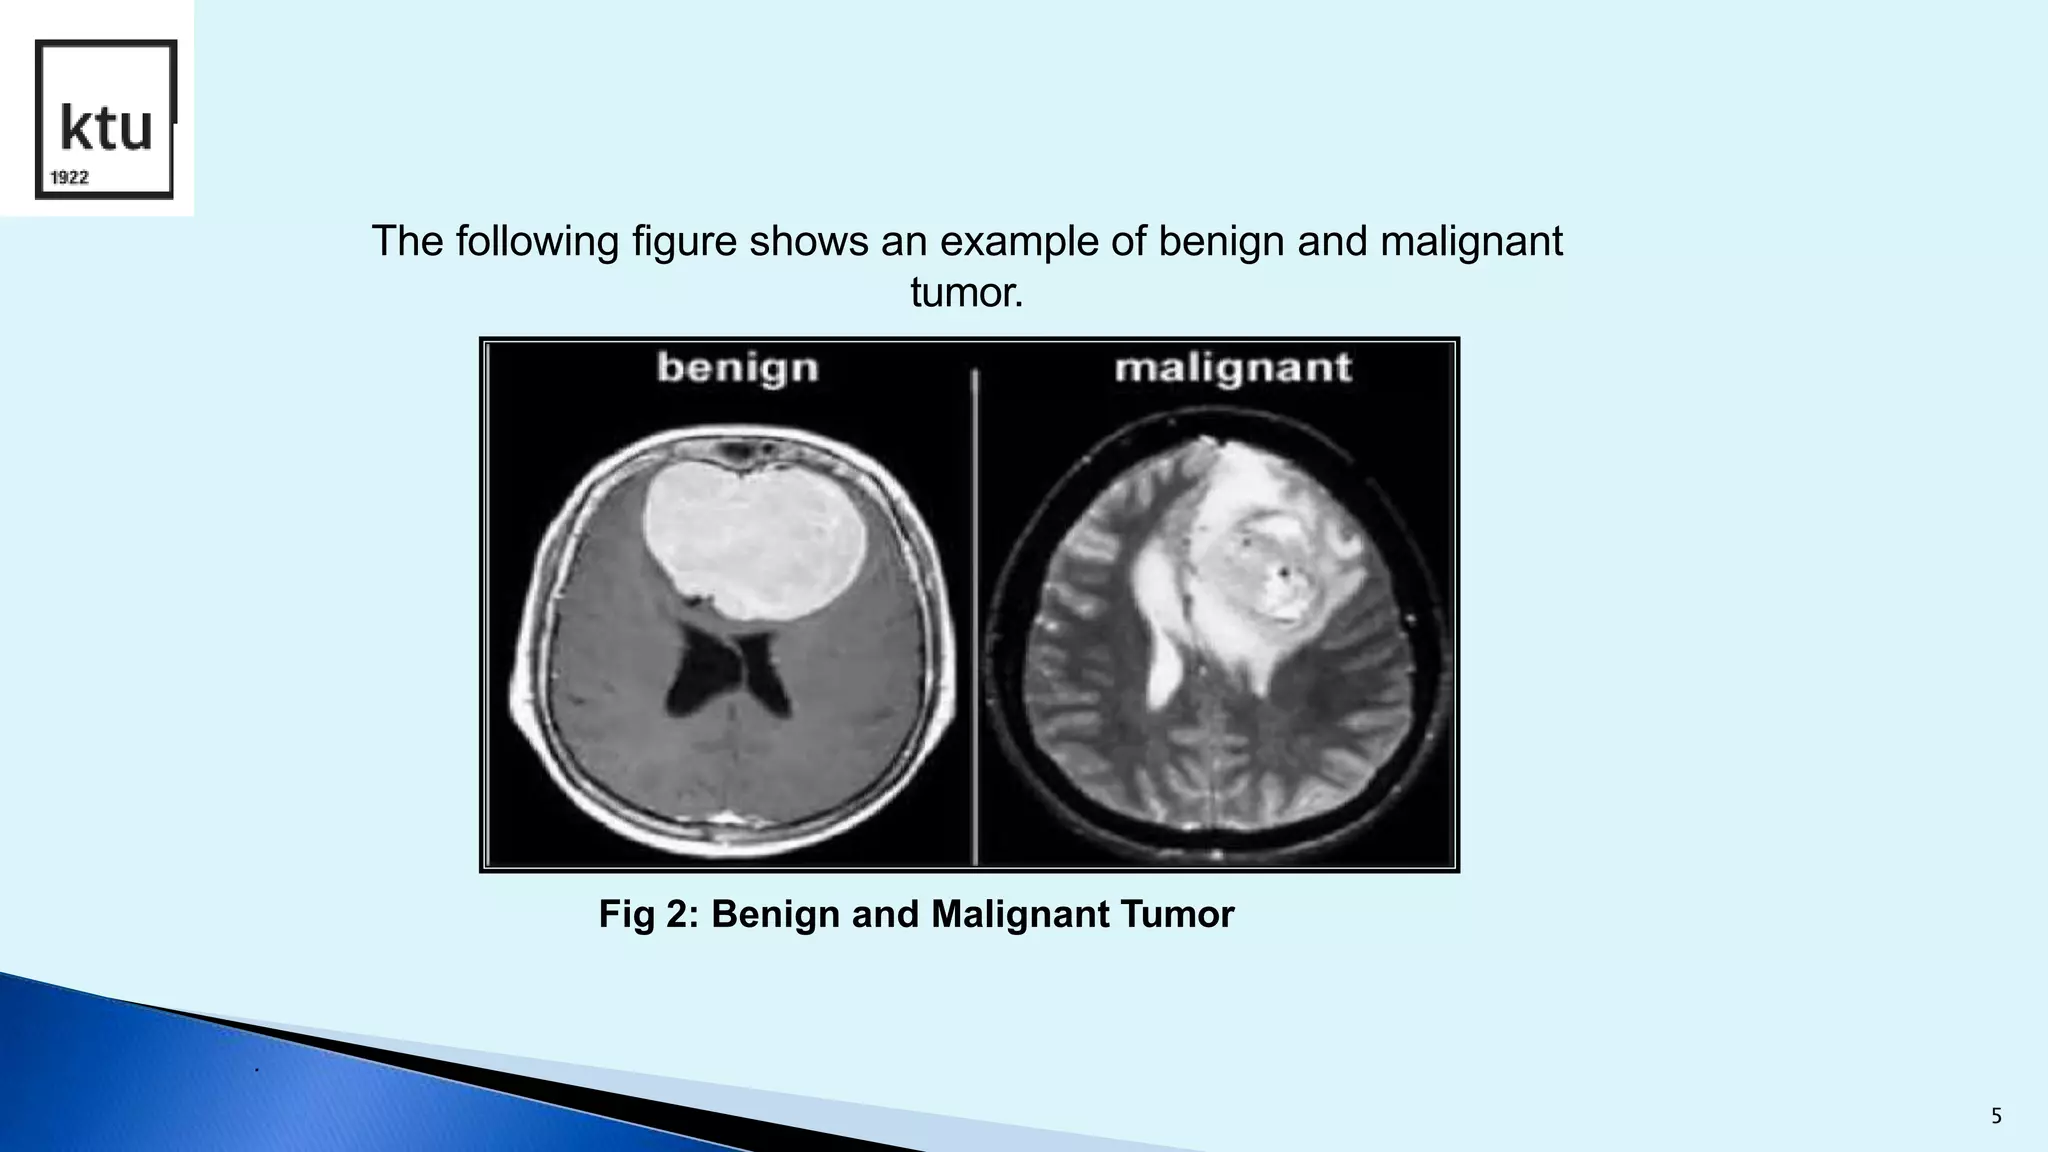
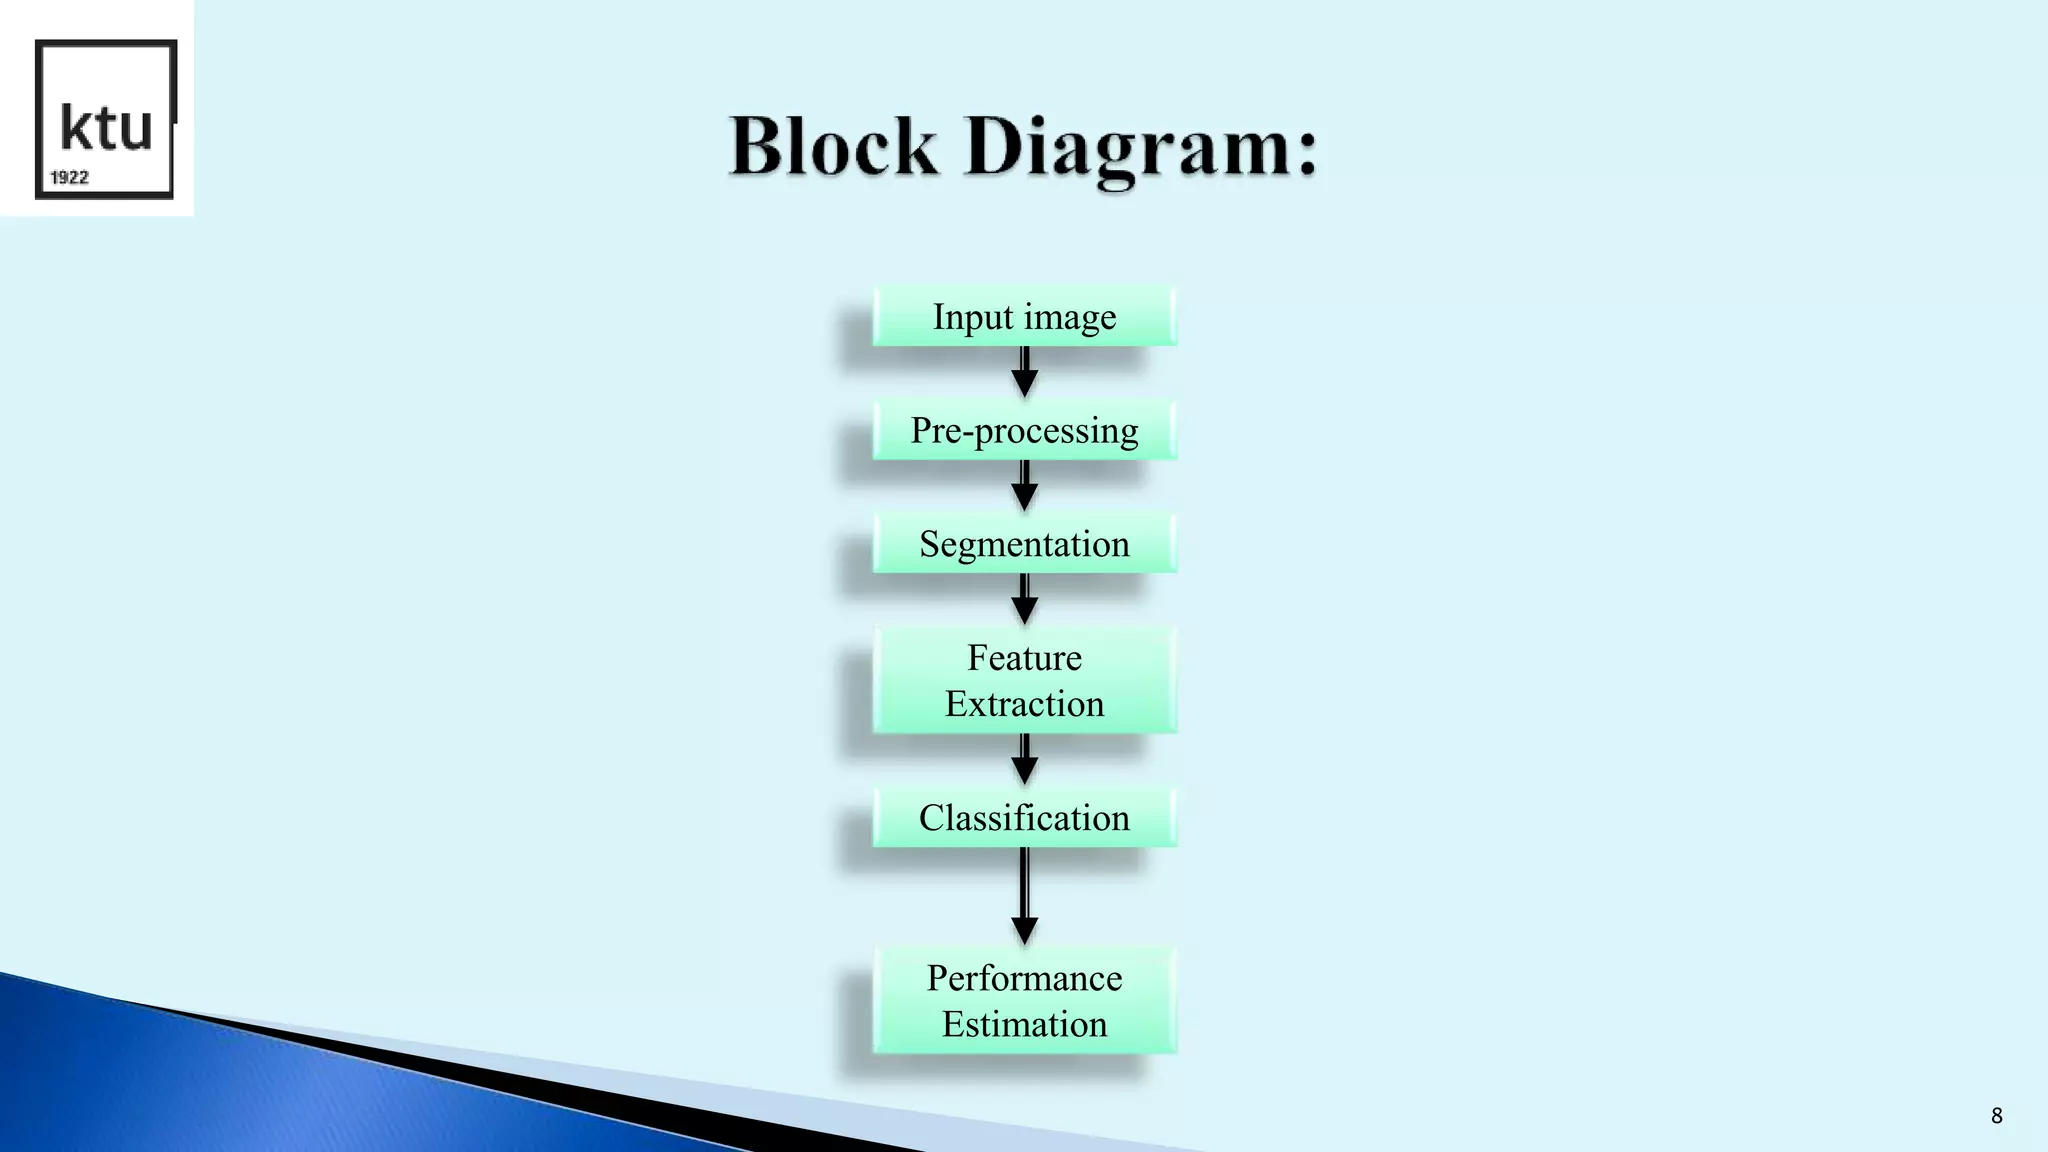
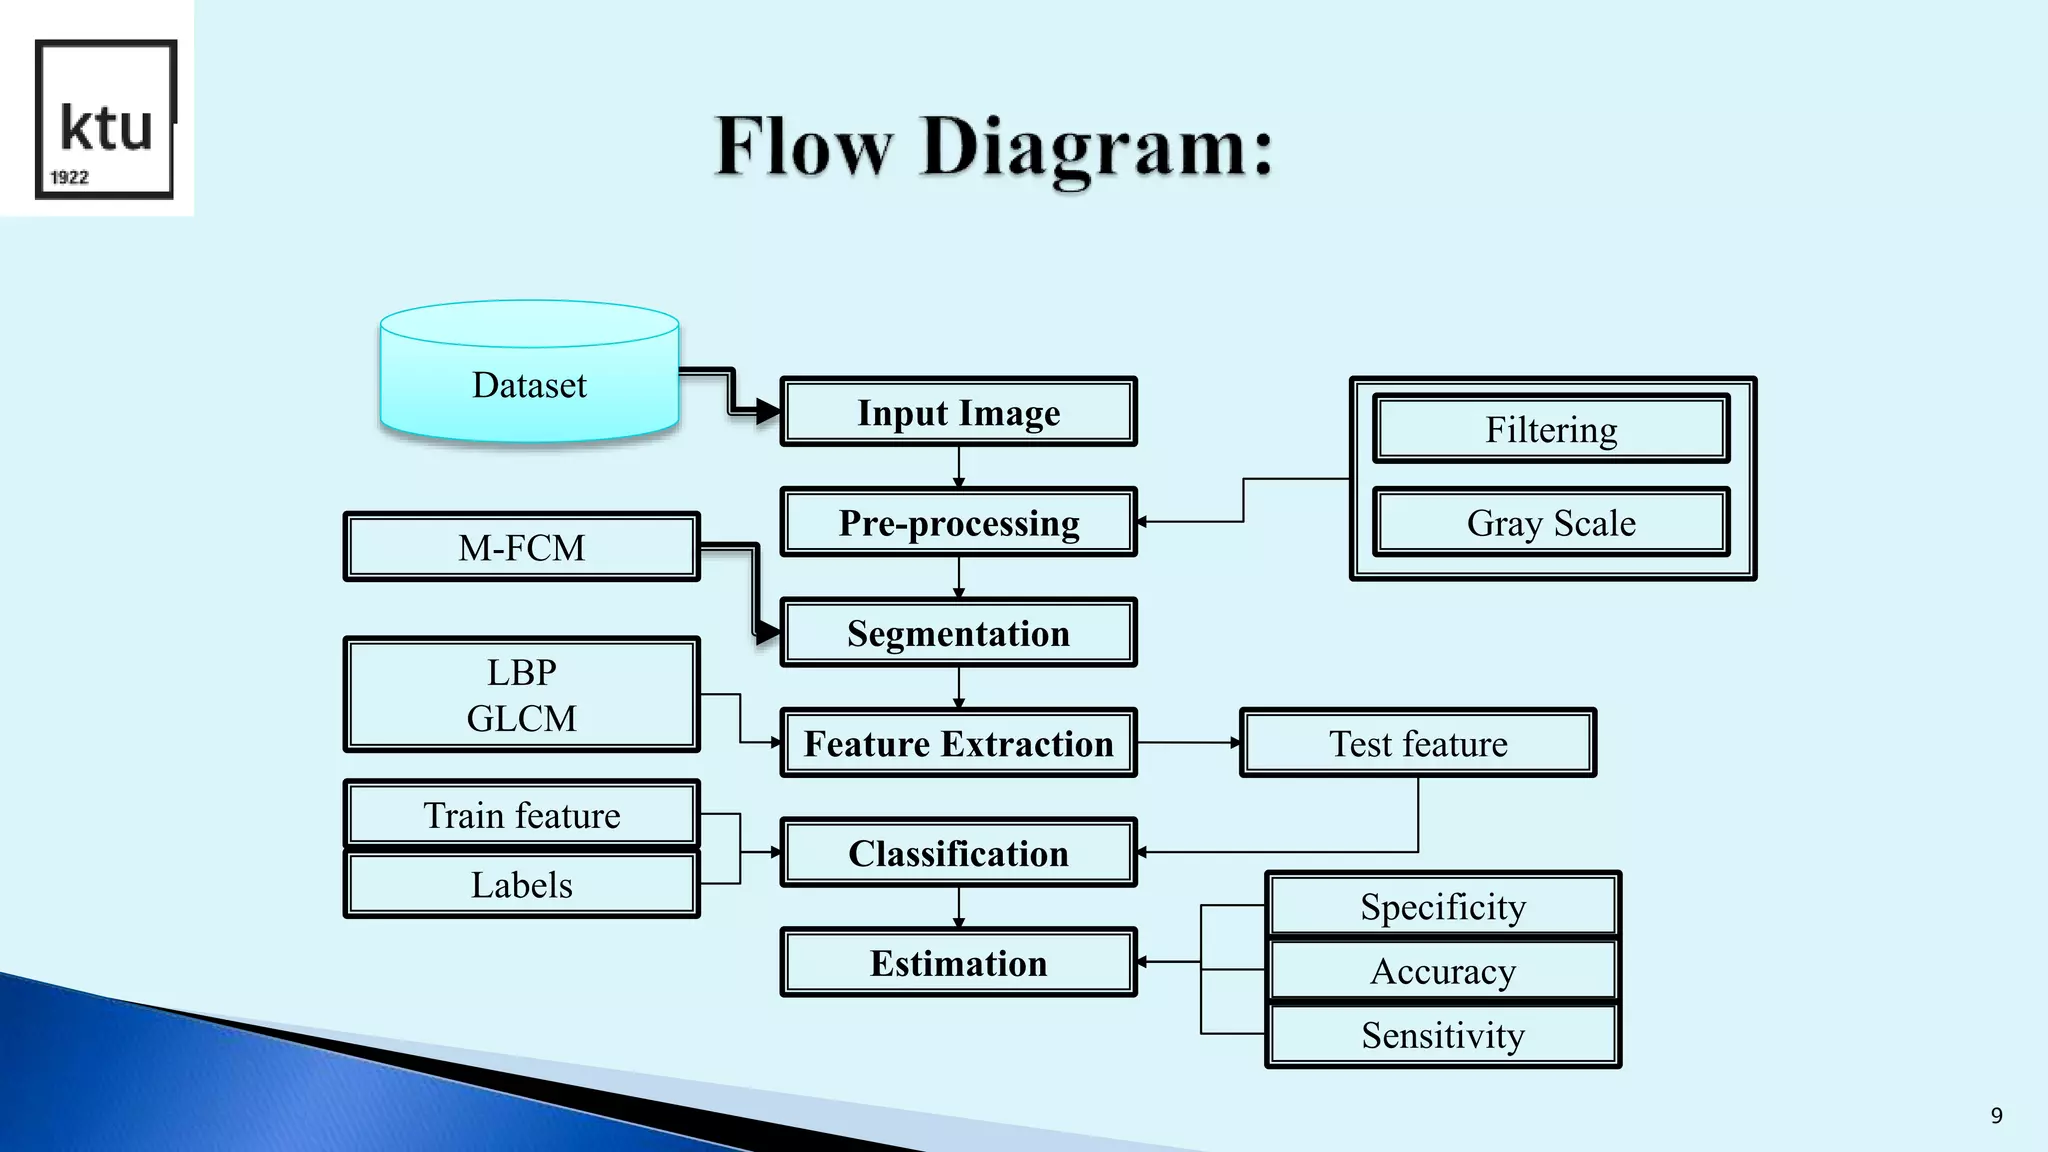
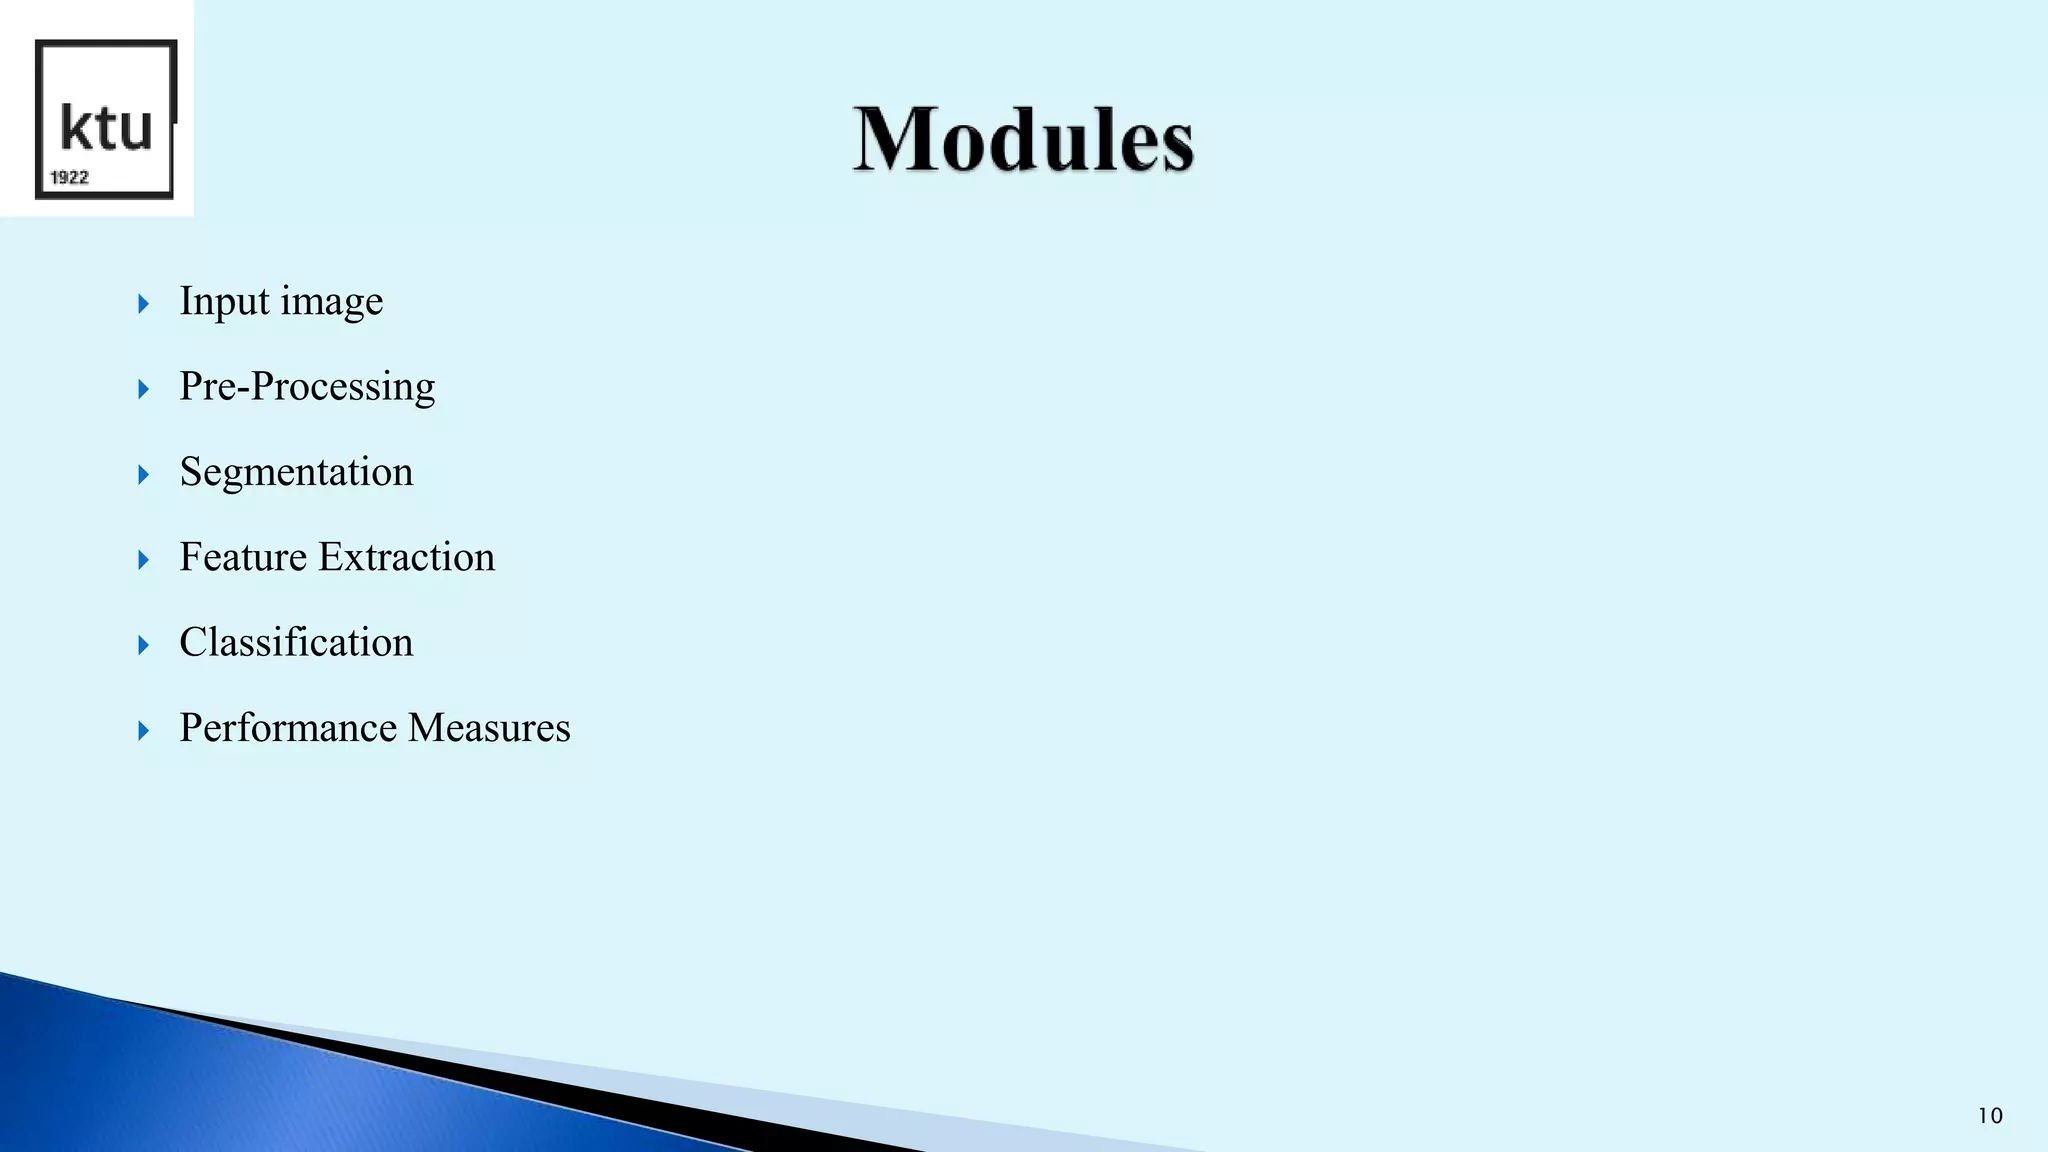
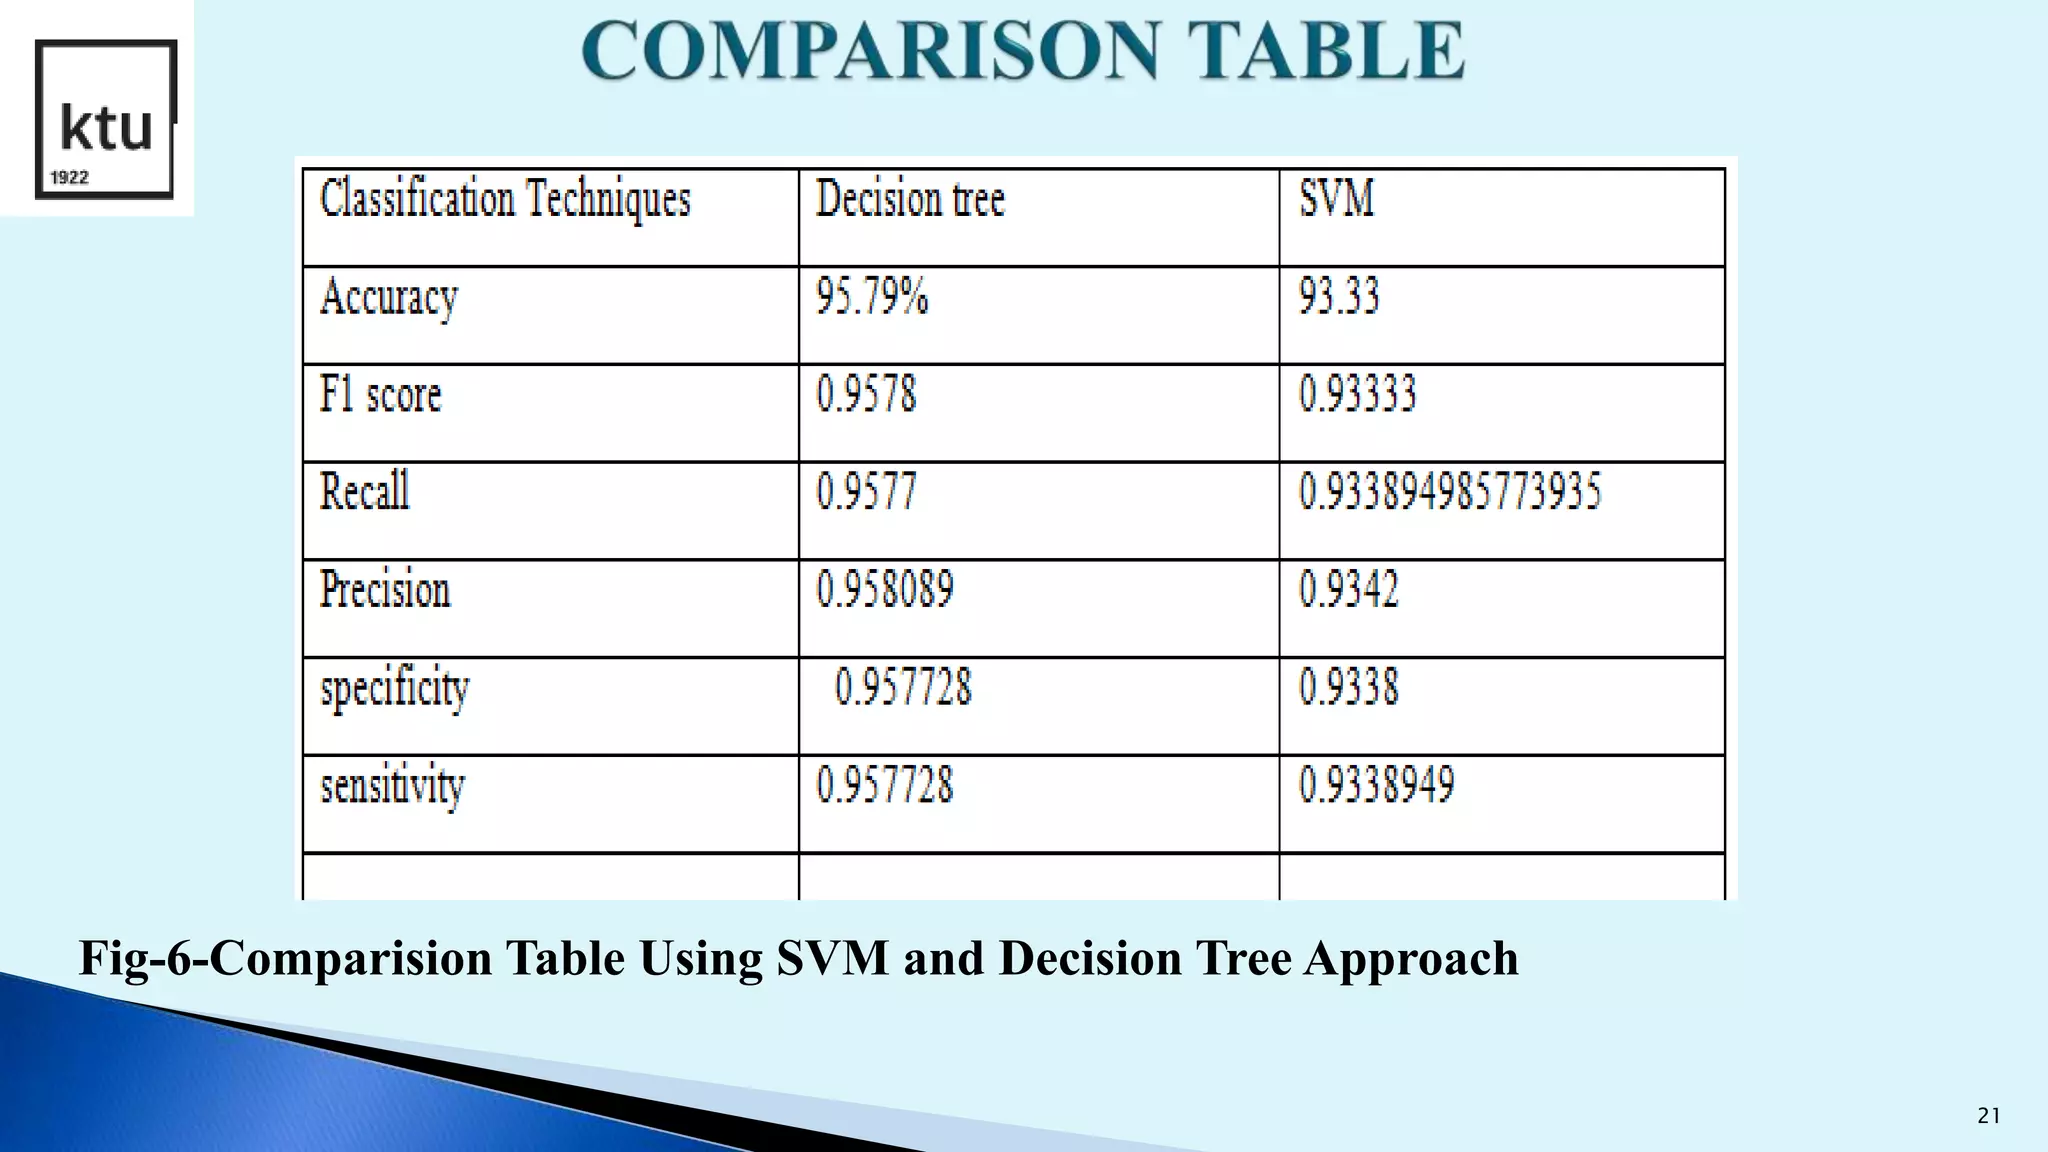
Presented By-
Niju Mathew
Supervised By:
Prof. Darius Jegelevičius
1
 Tumor is an uncontrolled growth of cancer cells in any part of the body. Tumors
are of different types and have different characteristics and different treatments.
 At present, brain tumors are classified as primary brain tumors and metastatic
brain tumors.
 The former begin in the brain and tend to stay in the brain, the latter begin as a
cancer elsewhere in the body and spreading to the brain. Brain tumor
segmentation is one of the crucial procedures in surgical and treatment planning.
 A tumor can be defined as any mass caused by abnormal or uncontrolled
growth of cells. This mass of tumor grows within the skull, due to which
normal brain activity is hampered.
 Which if not detected in earlier stage, can take away the person’s life. Hence, it
is very to detect the brain as early as possible
Fig 1- Brain Tumor Image
3
Types of Brain Tumor
Brain
Tumor
Benign Malignant
non cancerous
grows slowly: do not spread into other
tissues have clear borders
brain cancers
grows rapidly and invades healthy
brain tissues
distorted borders
4
The following figure shows an example of benign and malignant
tumor.
Fig 2: Benign and Malignant Tumor
.
5
 The main objective of this process is to, identify the cancerous region in MRI brain and to classify the
severity of that brain.
 To improve the efficiency of the process.
6
 The system proposed a novel semi-automatic segmentation method based on population and
individual statistical information to segment brain lesion in magnetic resonance (MR) images.
 The probability of each pixel belonging to the foreground (tumor) and the back ground is estimated by
the morphological is used.
 A combined algorithm of LBP is constructed followed by these probabilities and it is extracts the
features from the image.
 It can easily be realized that the full or semi-automatic segmentation and SVM classification methods
are in fact region segmentation methods.
7
Input image
Pre-processing
Segmentation
Feature
Extraction
Classification
Performance
Estimation
8
Input Image
Pre-processing
Filtering
Gray Scale
Segmentation
Feature Extraction
Classification
Estimation
LBP
GLCM
Test feature
Train feature
Labels
Accuracy
Sensitivity
Specificity
M-FCM
Dataset
9
 Input image
 Pre-Processing
 Segmentation
 Feature Extraction
 Classification
 Performance Measures
10
 Read an image into the workspace, using the imread command. The example reads one of the sample
images included with the toolbox, an image, and stores it in an array named I . imread infers from the
file that the graphics file format is Tagged Image File Format (TIFF).
 Display the image, using the imshow function. You can also view an image in the Image Viewer app.
The imtool function opens the Image Viewer app which presents an integrated environment for
displaying images and performing some common image processing tasks.
 The Image Viewer app provides all the image display capabilities of imshow but also provides access
to several other tools for navigating and exploring images, such as scroll bars, the Pixel Region tool,
Image Information tool, and the Contrast Adjustment tool.
11
 Noise Filtering:
 Image processing is basically the use of computer algorithms to perform image processing on digital
images.
 Digital image processing is a part of digital signal processing.
 Digital image processing has many significant advantages over analog image processing.
 Image processing allows a much wider range of algorithms to be applied to the input data and can
avoid problems such as the build-up of noise and signal distortion during processing of images.
 Wavelet transforms have become a very powerful tool for de-noising an image.
12
 Local binary patterns (LBP) is a type of visual descriptor used for classification in computer
vision. LBP is the particular case of the Texture Spectrum .
 It has since been found to be a powerful feature for texture classification; it has further been
determined that when LBP is combined with the Histogram of oriented gradients (HOG)
descriptor.
 it improves the detection performance considerably on some datasets. A comparison of several
improvements of the original LBP in the field of background subtraction was made in 2015 by
Silva et al. A full survey of the different versions of LBP can be found in Bouwmans et al.
13
 In machine learning, support-vector machines (SVMs, also support-vector networks)
are supervised learning models with associated learning algorithms that analyze data
for classification and regression analysis.
 One of the widely used algorithm for regression as well for the classification problem
we used supervised machine learning algorithm known as support vector machine
(SVM).
 In this technique feature extracted are plotted in n dimensional space then
classification performed by creating a hyperplane between classes
14
 The accuracy, sensitivity and specificity of the classifier is measured.
 The accuracy represents the efficiency of the process.
 The sensitivity shows how the algorithm gives correct classification.
 The specificity shows how the algorithm rejects the wrongly classification results.
 The performance of the process is measured based on the calculation of Accuracy, Area under curve of
the process.
 True positive = correctly identified, False positive = incorrectly identified, True negative = correctly
rejected, False negative = incorrectly rejected.
15
 Accuracy: The accuracy of a test is its ability to differentiate the patient and healthy cases correctly.
To estimate the accuracy of a test, we should calculate the proportion of true positive and true negative
in all evaluated cases. Mathematically, this can be stated as:
Accuracy = (TP+TN) / (TP+TN+FP+FN);
16
 Sensitivity: The sensitivity of a test is its ability to determine the patient cases correctly. To estimate it,
we should calculate the proportion of true positive in patient cases. Mathematically, this can be stated
as:
Sensitivity = (TP) / (TP + FN)
 Specificity: The specificity of a test is its ability to determine the healthy cases correctly. To estimate
it, we should calculate the proportion of true negative in healthy cases. Mathematically, this can be
stated as:
Specificity = (TN) / (TN + FP)
17
Fig-3 Segmented Image Results 18
Fig-4 Image Results of Decision Tree Approach Using Perform Analysis Method
19
Fig-5- Image Results of SVM Using Perform Analysis Method
20
Fig-6-Comparision Table Using SVM and Decision Tree Approach
21
 For future work, to get better accuracy rate and less error rate a Hybrid
SVM algorithm is to be proposed.
 And for more future work it can also be tested for tumor detection of other
parts of the body.
 The proposed frame work can be used as a quick guidance tool for the
radiologists
22
23

Final ppt

  • 1.
    Presented By- Niju Mathew SupervisedBy: Prof. Darius Jegelevičius 1
  • 2.
     Tumor isan uncontrolled growth of cancer cells in any part of the body. Tumors are of different types and have different characteristics and different treatments.  At present, brain tumors are classified as primary brain tumors and metastatic brain tumors.  The former begin in the brain and tend to stay in the brain, the latter begin as a cancer elsewhere in the body and spreading to the brain. Brain tumor segmentation is one of the crucial procedures in surgical and treatment planning.
  • 3.
     A tumorcan be defined as any mass caused by abnormal or uncontrolled growth of cells. This mass of tumor grows within the skull, due to which normal brain activity is hampered.  Which if not detected in earlier stage, can take away the person’s life. Hence, it is very to detect the brain as early as possible Fig 1- Brain Tumor Image 3
  • 4.
    Types of BrainTumor Brain Tumor Benign Malignant non cancerous grows slowly: do not spread into other tissues have clear borders brain cancers grows rapidly and invades healthy brain tissues distorted borders 4
  • 5.
    The following figureshows an example of benign and malignant tumor. Fig 2: Benign and Malignant Tumor . 5
  • 6.
     The mainobjective of this process is to, identify the cancerous region in MRI brain and to classify the severity of that brain.  To improve the efficiency of the process. 6
  • 7.
     The systemproposed a novel semi-automatic segmentation method based on population and individual statistical information to segment brain lesion in magnetic resonance (MR) images.  The probability of each pixel belonging to the foreground (tumor) and the back ground is estimated by the morphological is used.  A combined algorithm of LBP is constructed followed by these probabilities and it is extracts the features from the image.  It can easily be realized that the full or semi-automatic segmentation and SVM classification methods are in fact region segmentation methods. 7
  • 8.
  • 9.
    Input Image Pre-processing Filtering Gray Scale Segmentation FeatureExtraction Classification Estimation LBP GLCM Test feature Train feature Labels Accuracy Sensitivity Specificity M-FCM Dataset 9
  • 10.
     Input image Pre-Processing  Segmentation  Feature Extraction  Classification  Performance Measures 10
  • 11.
     Read animage into the workspace, using the imread command. The example reads one of the sample images included with the toolbox, an image, and stores it in an array named I . imread infers from the file that the graphics file format is Tagged Image File Format (TIFF).  Display the image, using the imshow function. You can also view an image in the Image Viewer app. The imtool function opens the Image Viewer app which presents an integrated environment for displaying images and performing some common image processing tasks.  The Image Viewer app provides all the image display capabilities of imshow but also provides access to several other tools for navigating and exploring images, such as scroll bars, the Pixel Region tool, Image Information tool, and the Contrast Adjustment tool. 11
  • 12.
     Noise Filtering: Image processing is basically the use of computer algorithms to perform image processing on digital images.  Digital image processing is a part of digital signal processing.  Digital image processing has many significant advantages over analog image processing.  Image processing allows a much wider range of algorithms to be applied to the input data and can avoid problems such as the build-up of noise and signal distortion during processing of images.  Wavelet transforms have become a very powerful tool for de-noising an image. 12
  • 13.
     Local binarypatterns (LBP) is a type of visual descriptor used for classification in computer vision. LBP is the particular case of the Texture Spectrum .  It has since been found to be a powerful feature for texture classification; it has further been determined that when LBP is combined with the Histogram of oriented gradients (HOG) descriptor.  it improves the detection performance considerably on some datasets. A comparison of several improvements of the original LBP in the field of background subtraction was made in 2015 by Silva et al. A full survey of the different versions of LBP can be found in Bouwmans et al. 13
  • 14.
     In machinelearning, support-vector machines (SVMs, also support-vector networks) are supervised learning models with associated learning algorithms that analyze data for classification and regression analysis.  One of the widely used algorithm for regression as well for the classification problem we used supervised machine learning algorithm known as support vector machine (SVM).  In this technique feature extracted are plotted in n dimensional space then classification performed by creating a hyperplane between classes 14
  • 15.
     The accuracy,sensitivity and specificity of the classifier is measured.  The accuracy represents the efficiency of the process.  The sensitivity shows how the algorithm gives correct classification.  The specificity shows how the algorithm rejects the wrongly classification results.  The performance of the process is measured based on the calculation of Accuracy, Area under curve of the process.  True positive = correctly identified, False positive = incorrectly identified, True negative = correctly rejected, False negative = incorrectly rejected. 15
  • 16.
     Accuracy: Theaccuracy of a test is its ability to differentiate the patient and healthy cases correctly. To estimate the accuracy of a test, we should calculate the proportion of true positive and true negative in all evaluated cases. Mathematically, this can be stated as: Accuracy = (TP+TN) / (TP+TN+FP+FN); 16
  • 17.
     Sensitivity: Thesensitivity of a test is its ability to determine the patient cases correctly. To estimate it, we should calculate the proportion of true positive in patient cases. Mathematically, this can be stated as: Sensitivity = (TP) / (TP + FN)  Specificity: The specificity of a test is its ability to determine the healthy cases correctly. To estimate it, we should calculate the proportion of true negative in healthy cases. Mathematically, this can be stated as: Specificity = (TN) / (TN + FP) 17
  • 18.
  • 19.
    Fig-4 Image Resultsof Decision Tree Approach Using Perform Analysis Method 19
  • 20.
    Fig-5- Image Resultsof SVM Using Perform Analysis Method 20
  • 21.
    Fig-6-Comparision Table UsingSVM and Decision Tree Approach 21
  • 22.
     For futurework, to get better accuracy rate and less error rate a Hybrid SVM algorithm is to be proposed.  And for more future work it can also be tested for tumor detection of other parts of the body.  The proposed frame work can be used as a quick guidance tool for the radiologists 22
  • 23.