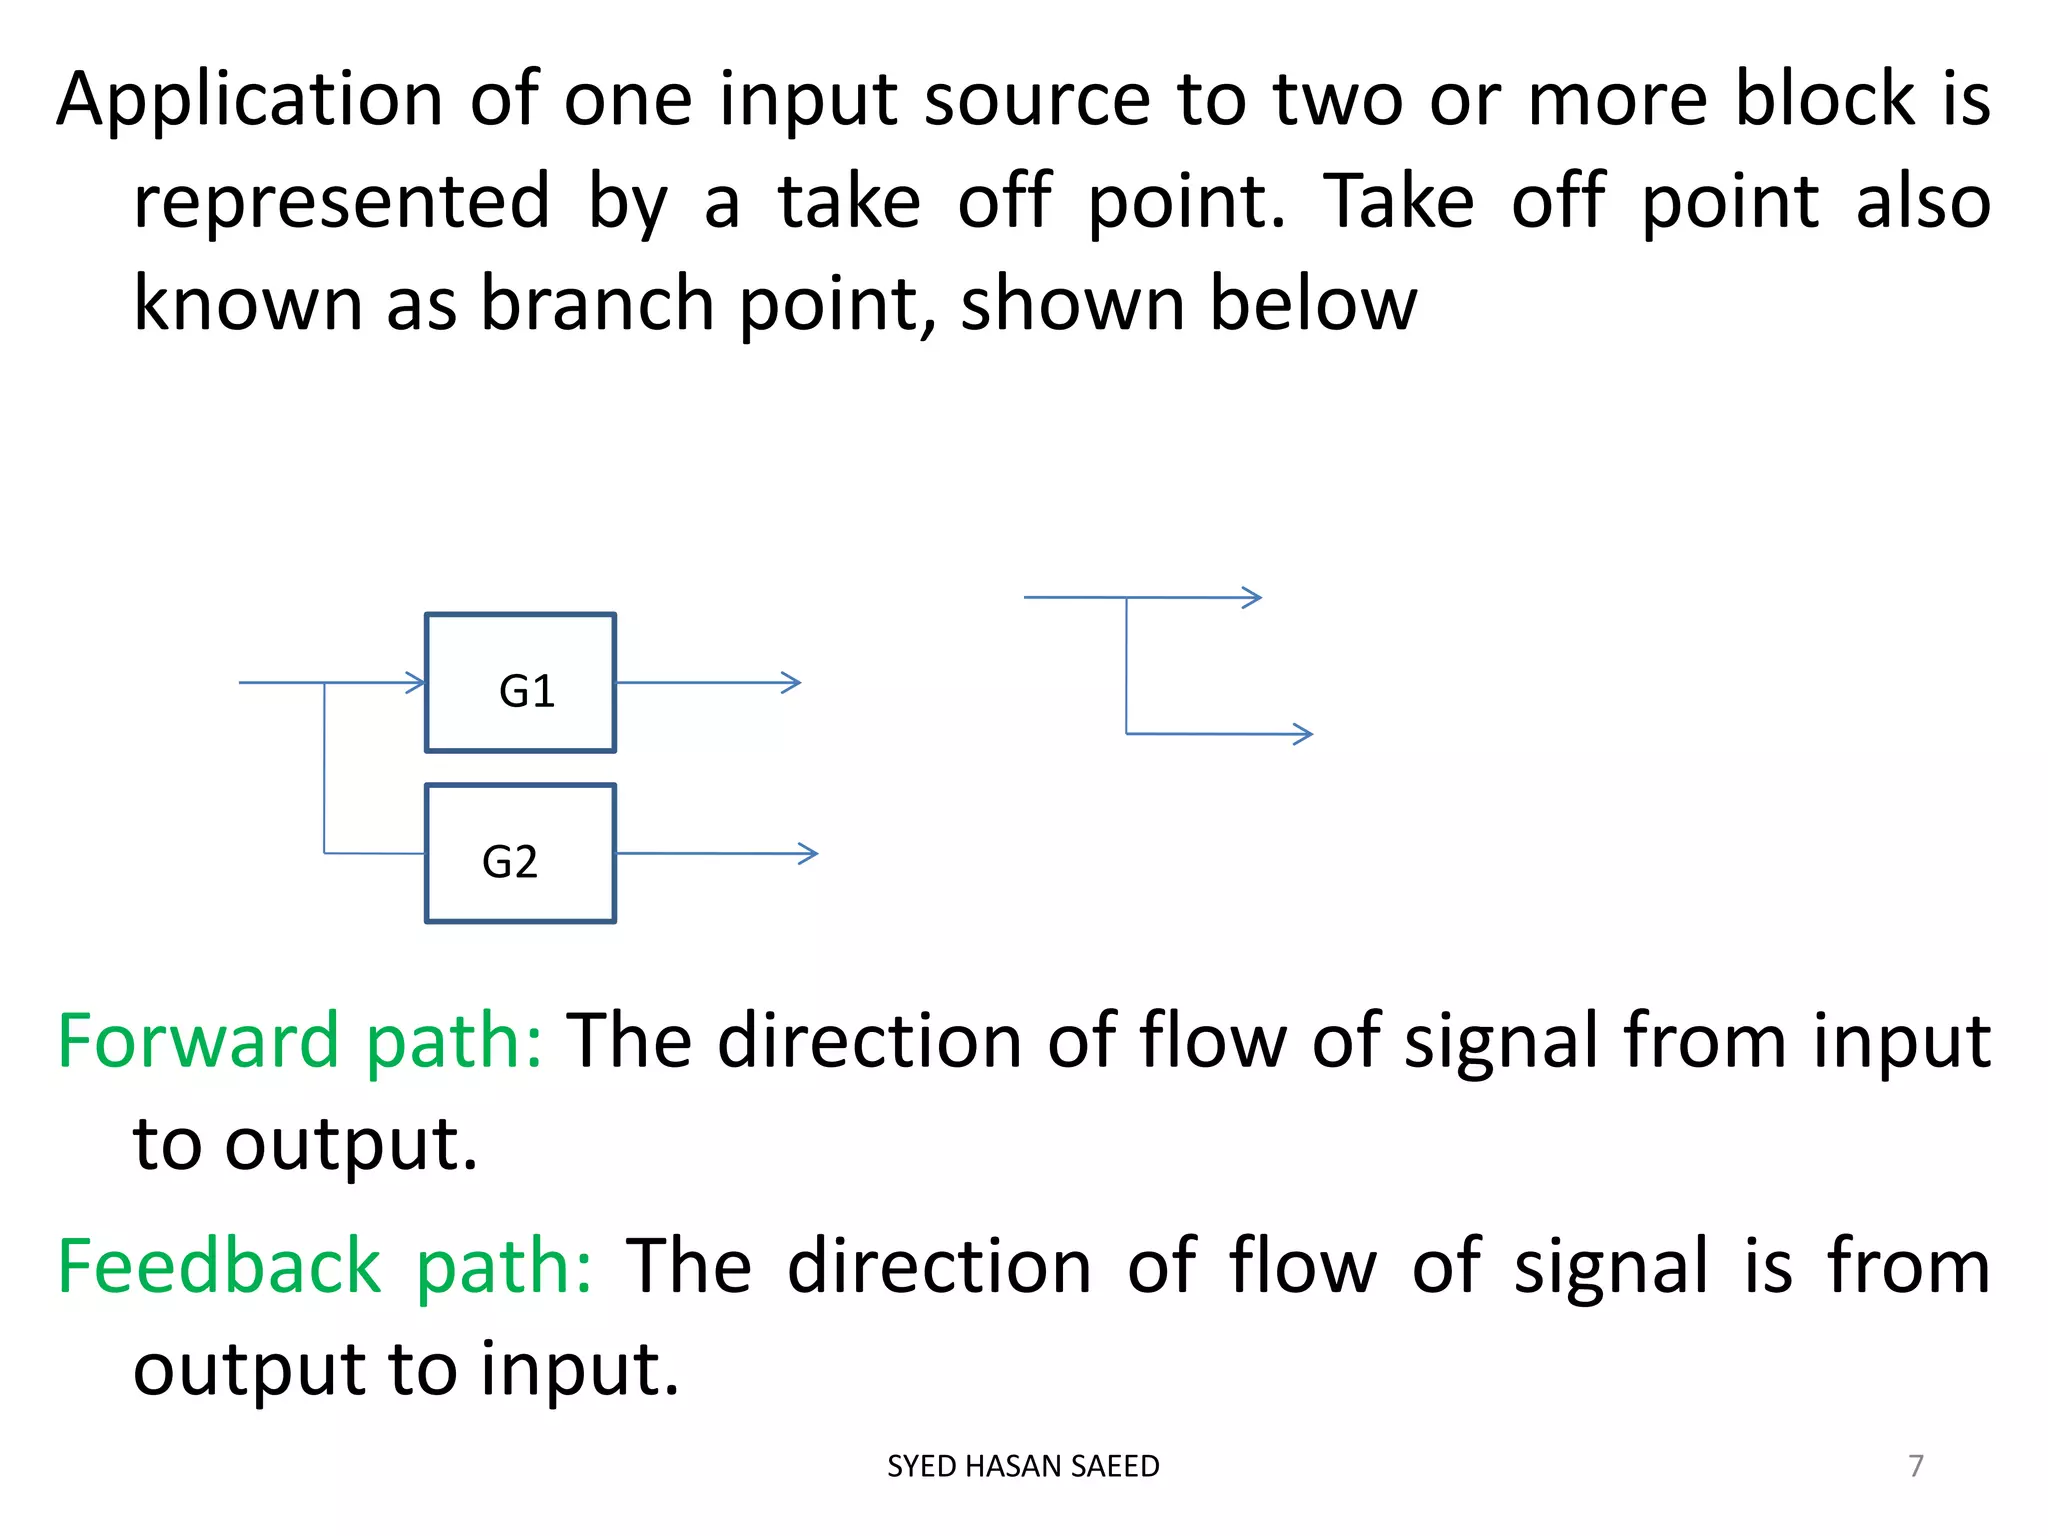
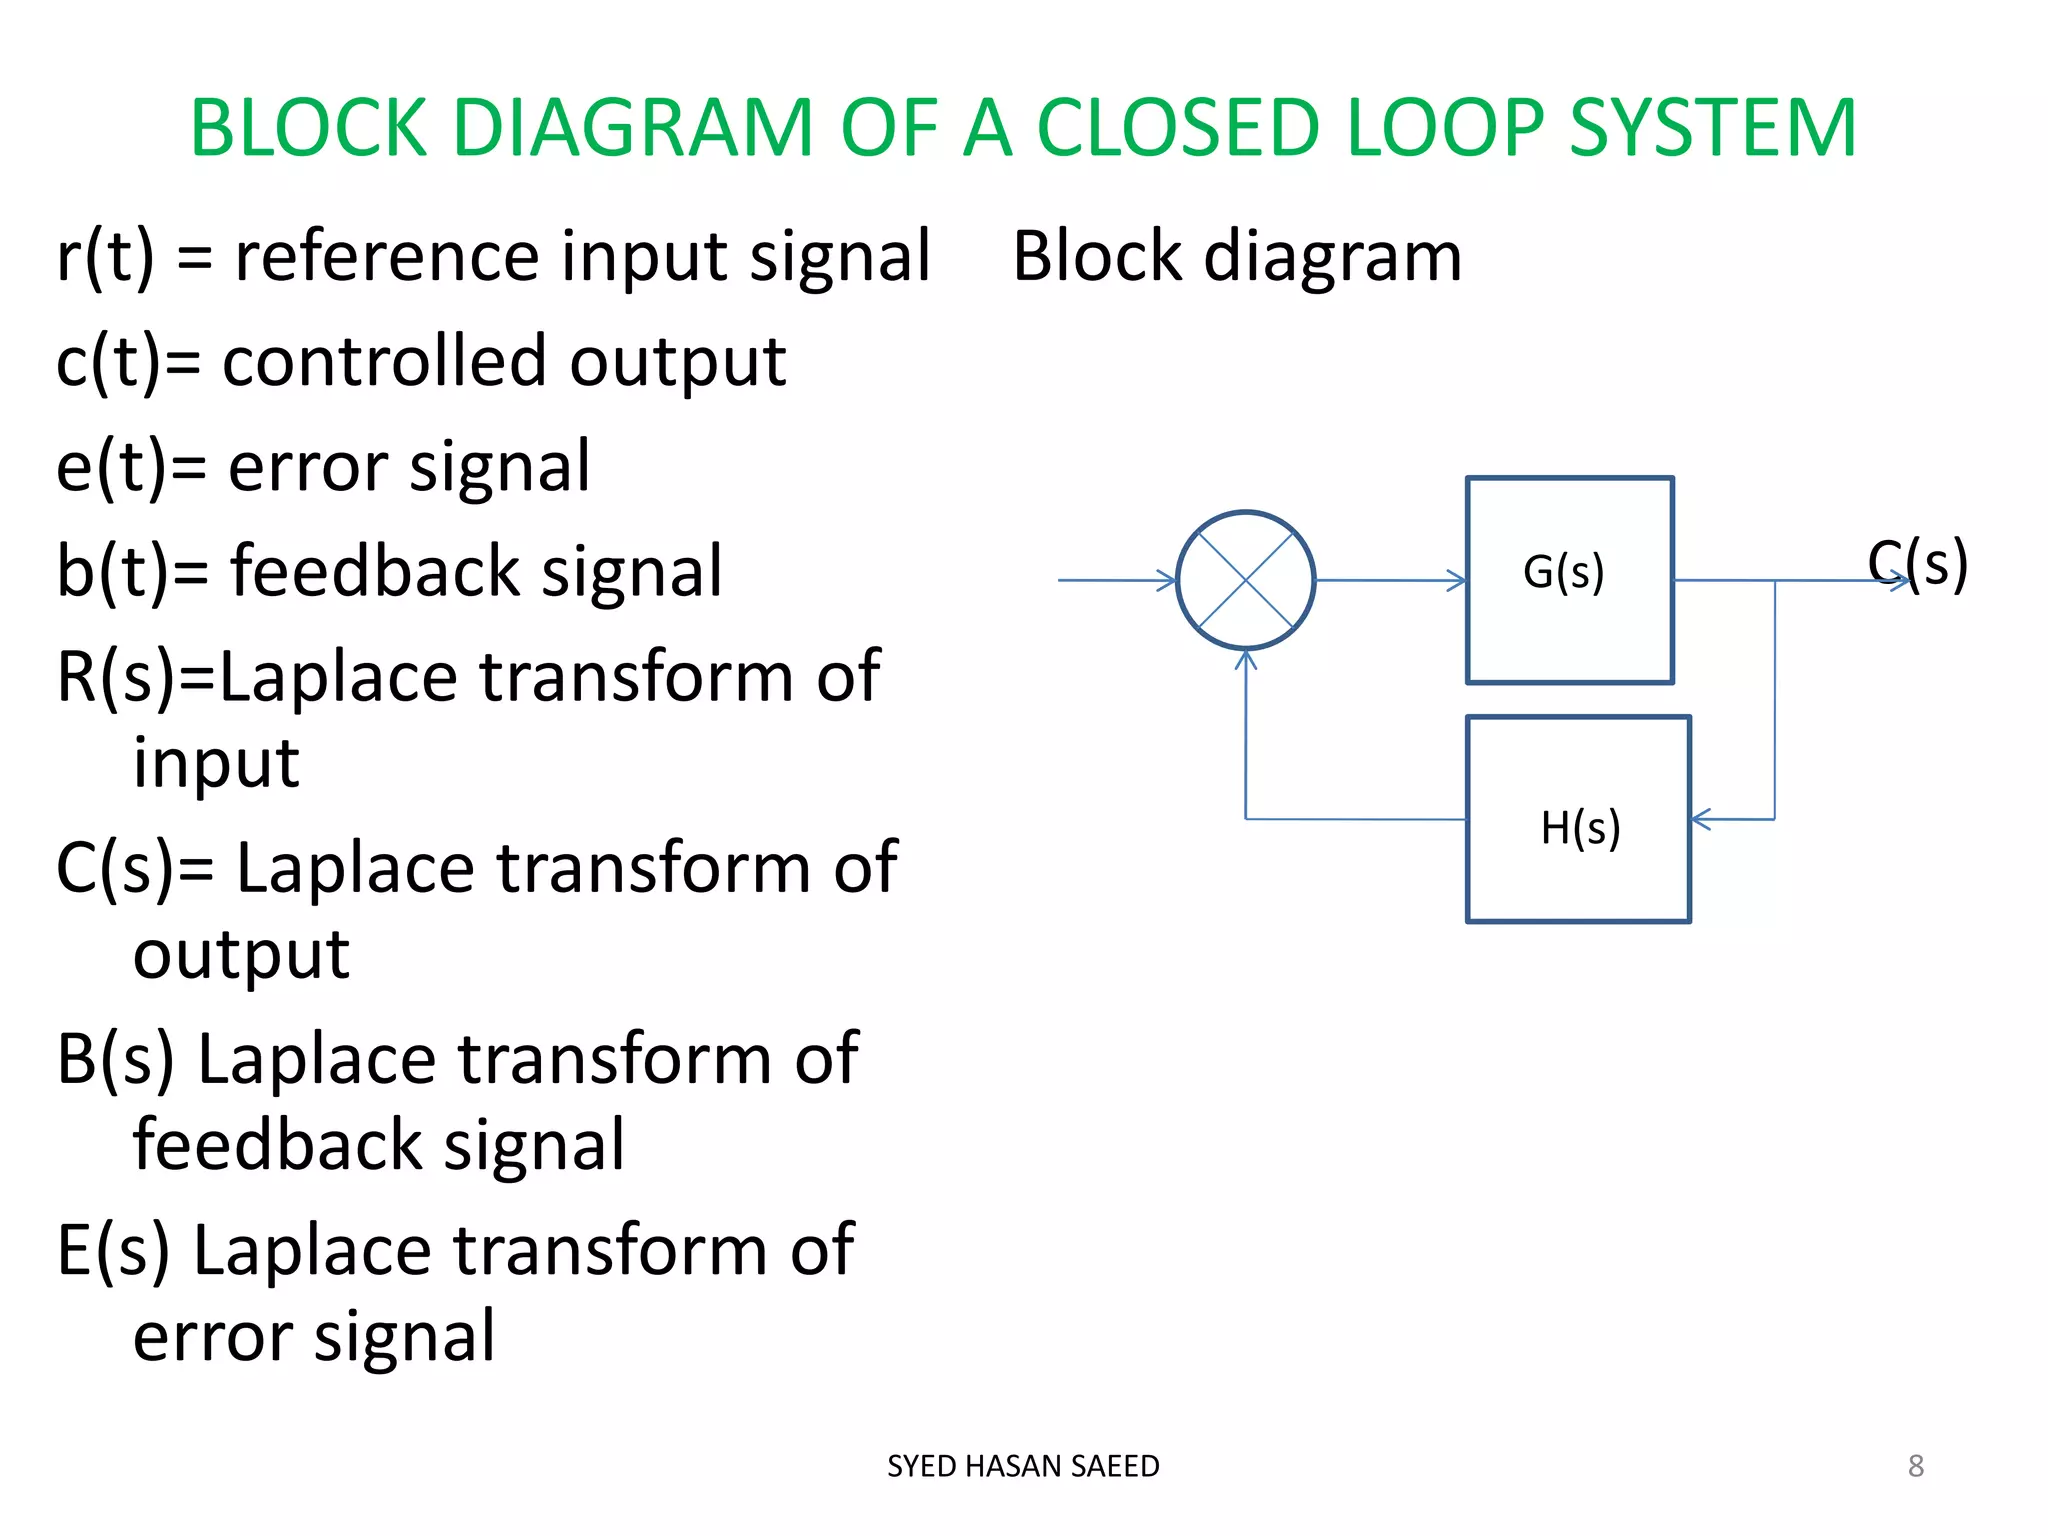
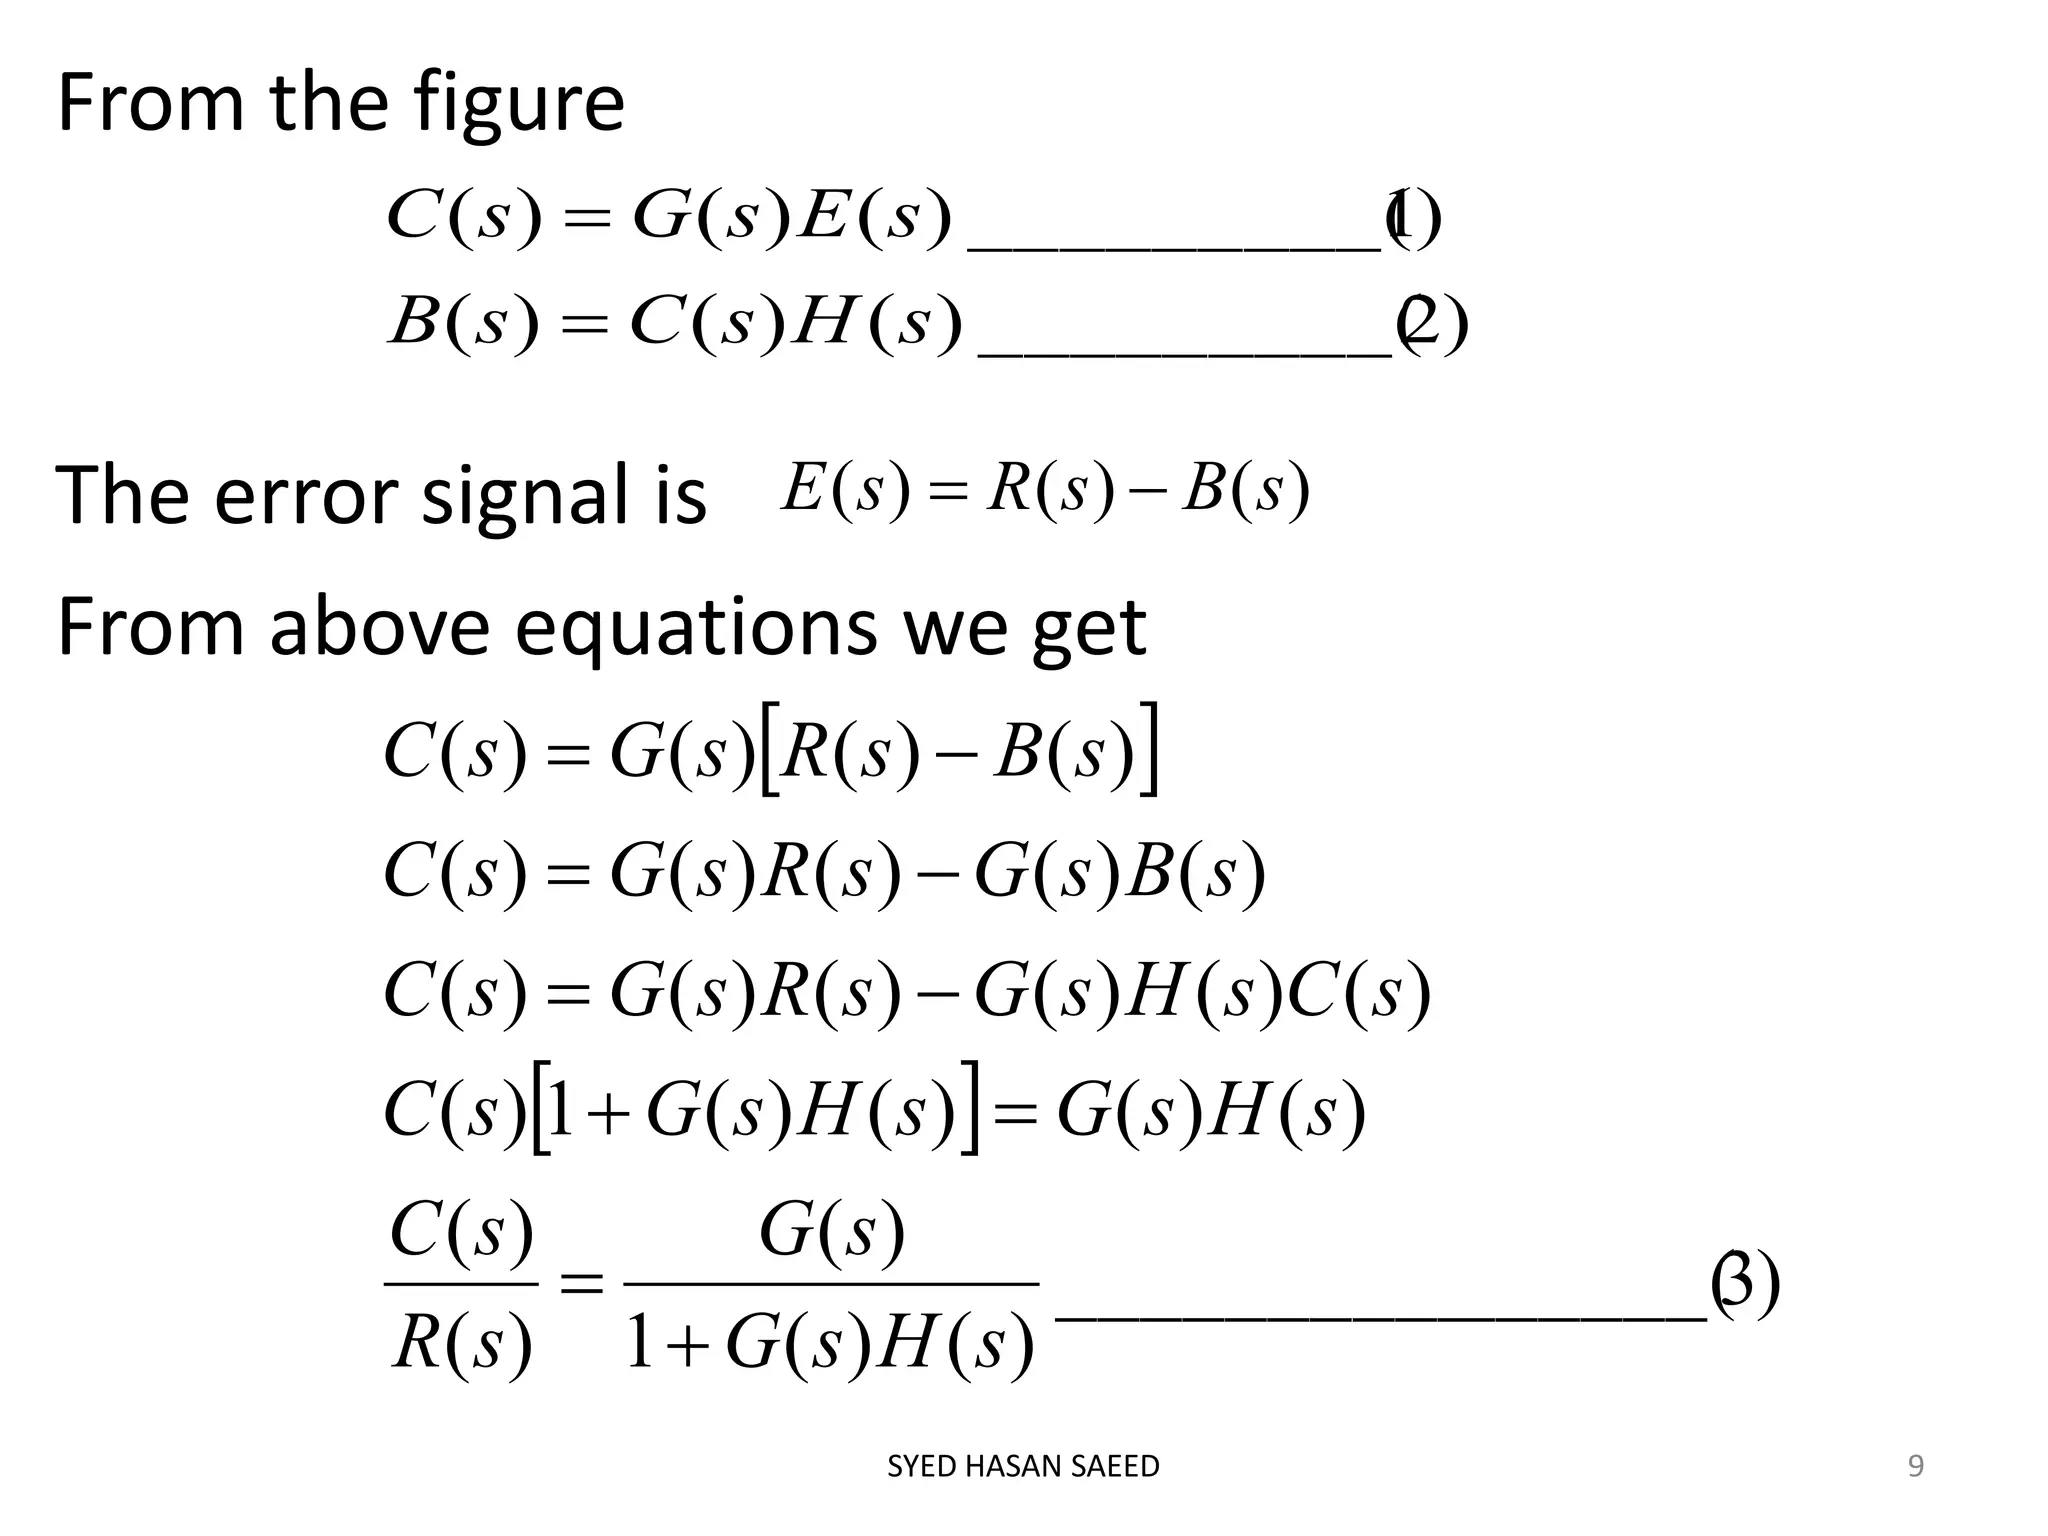
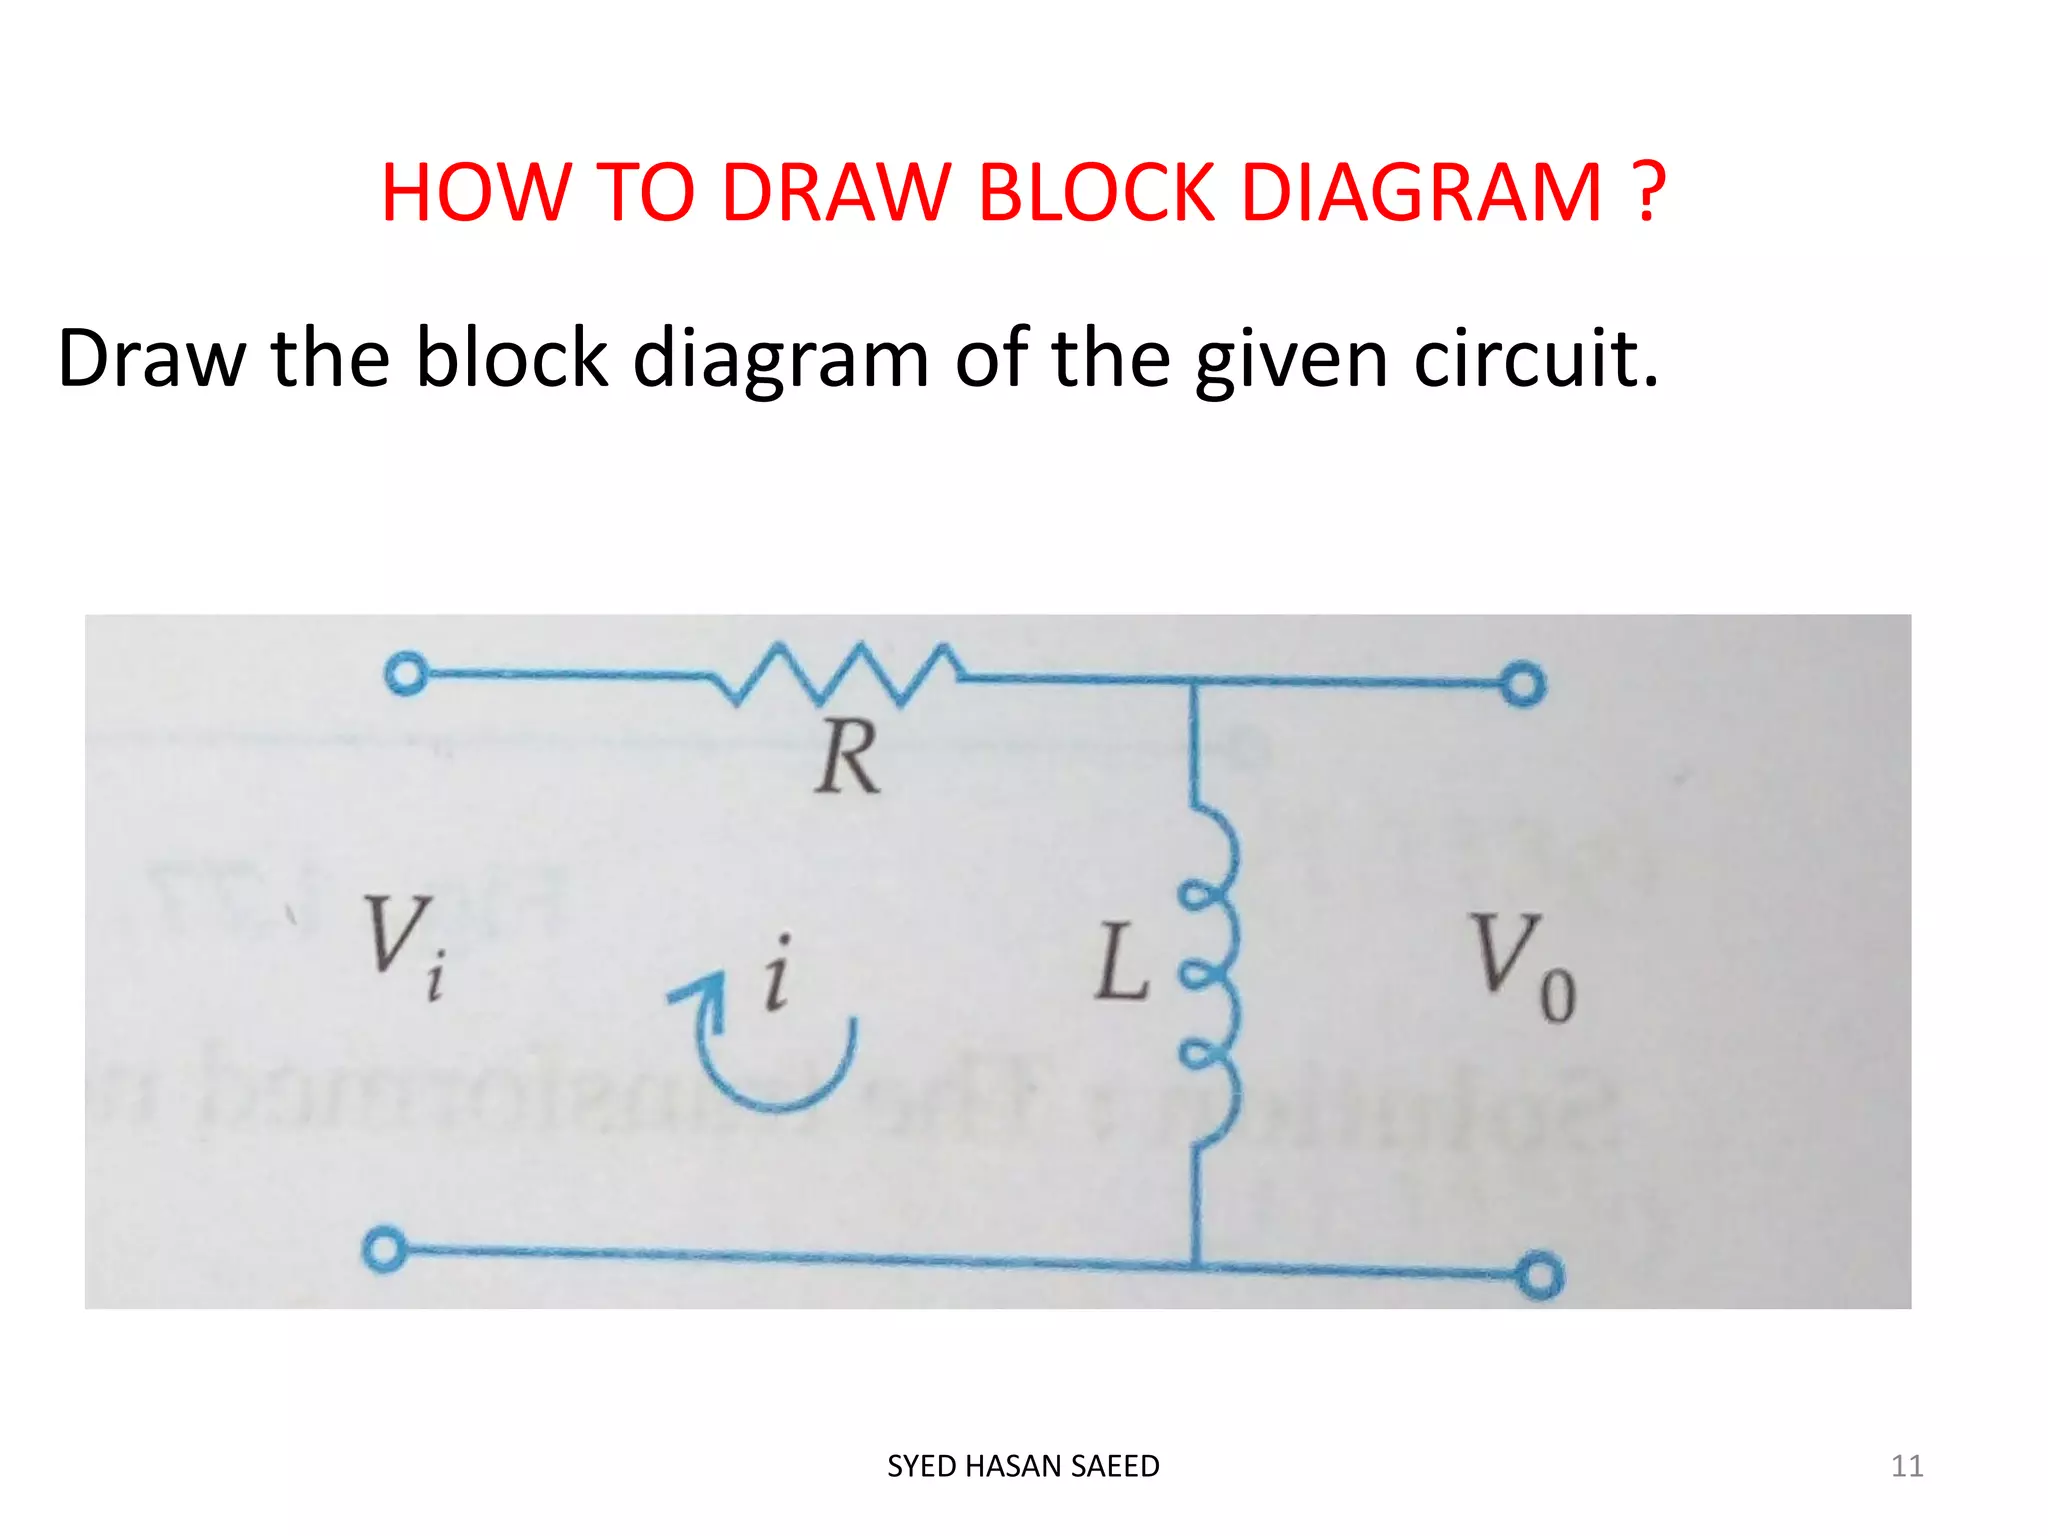
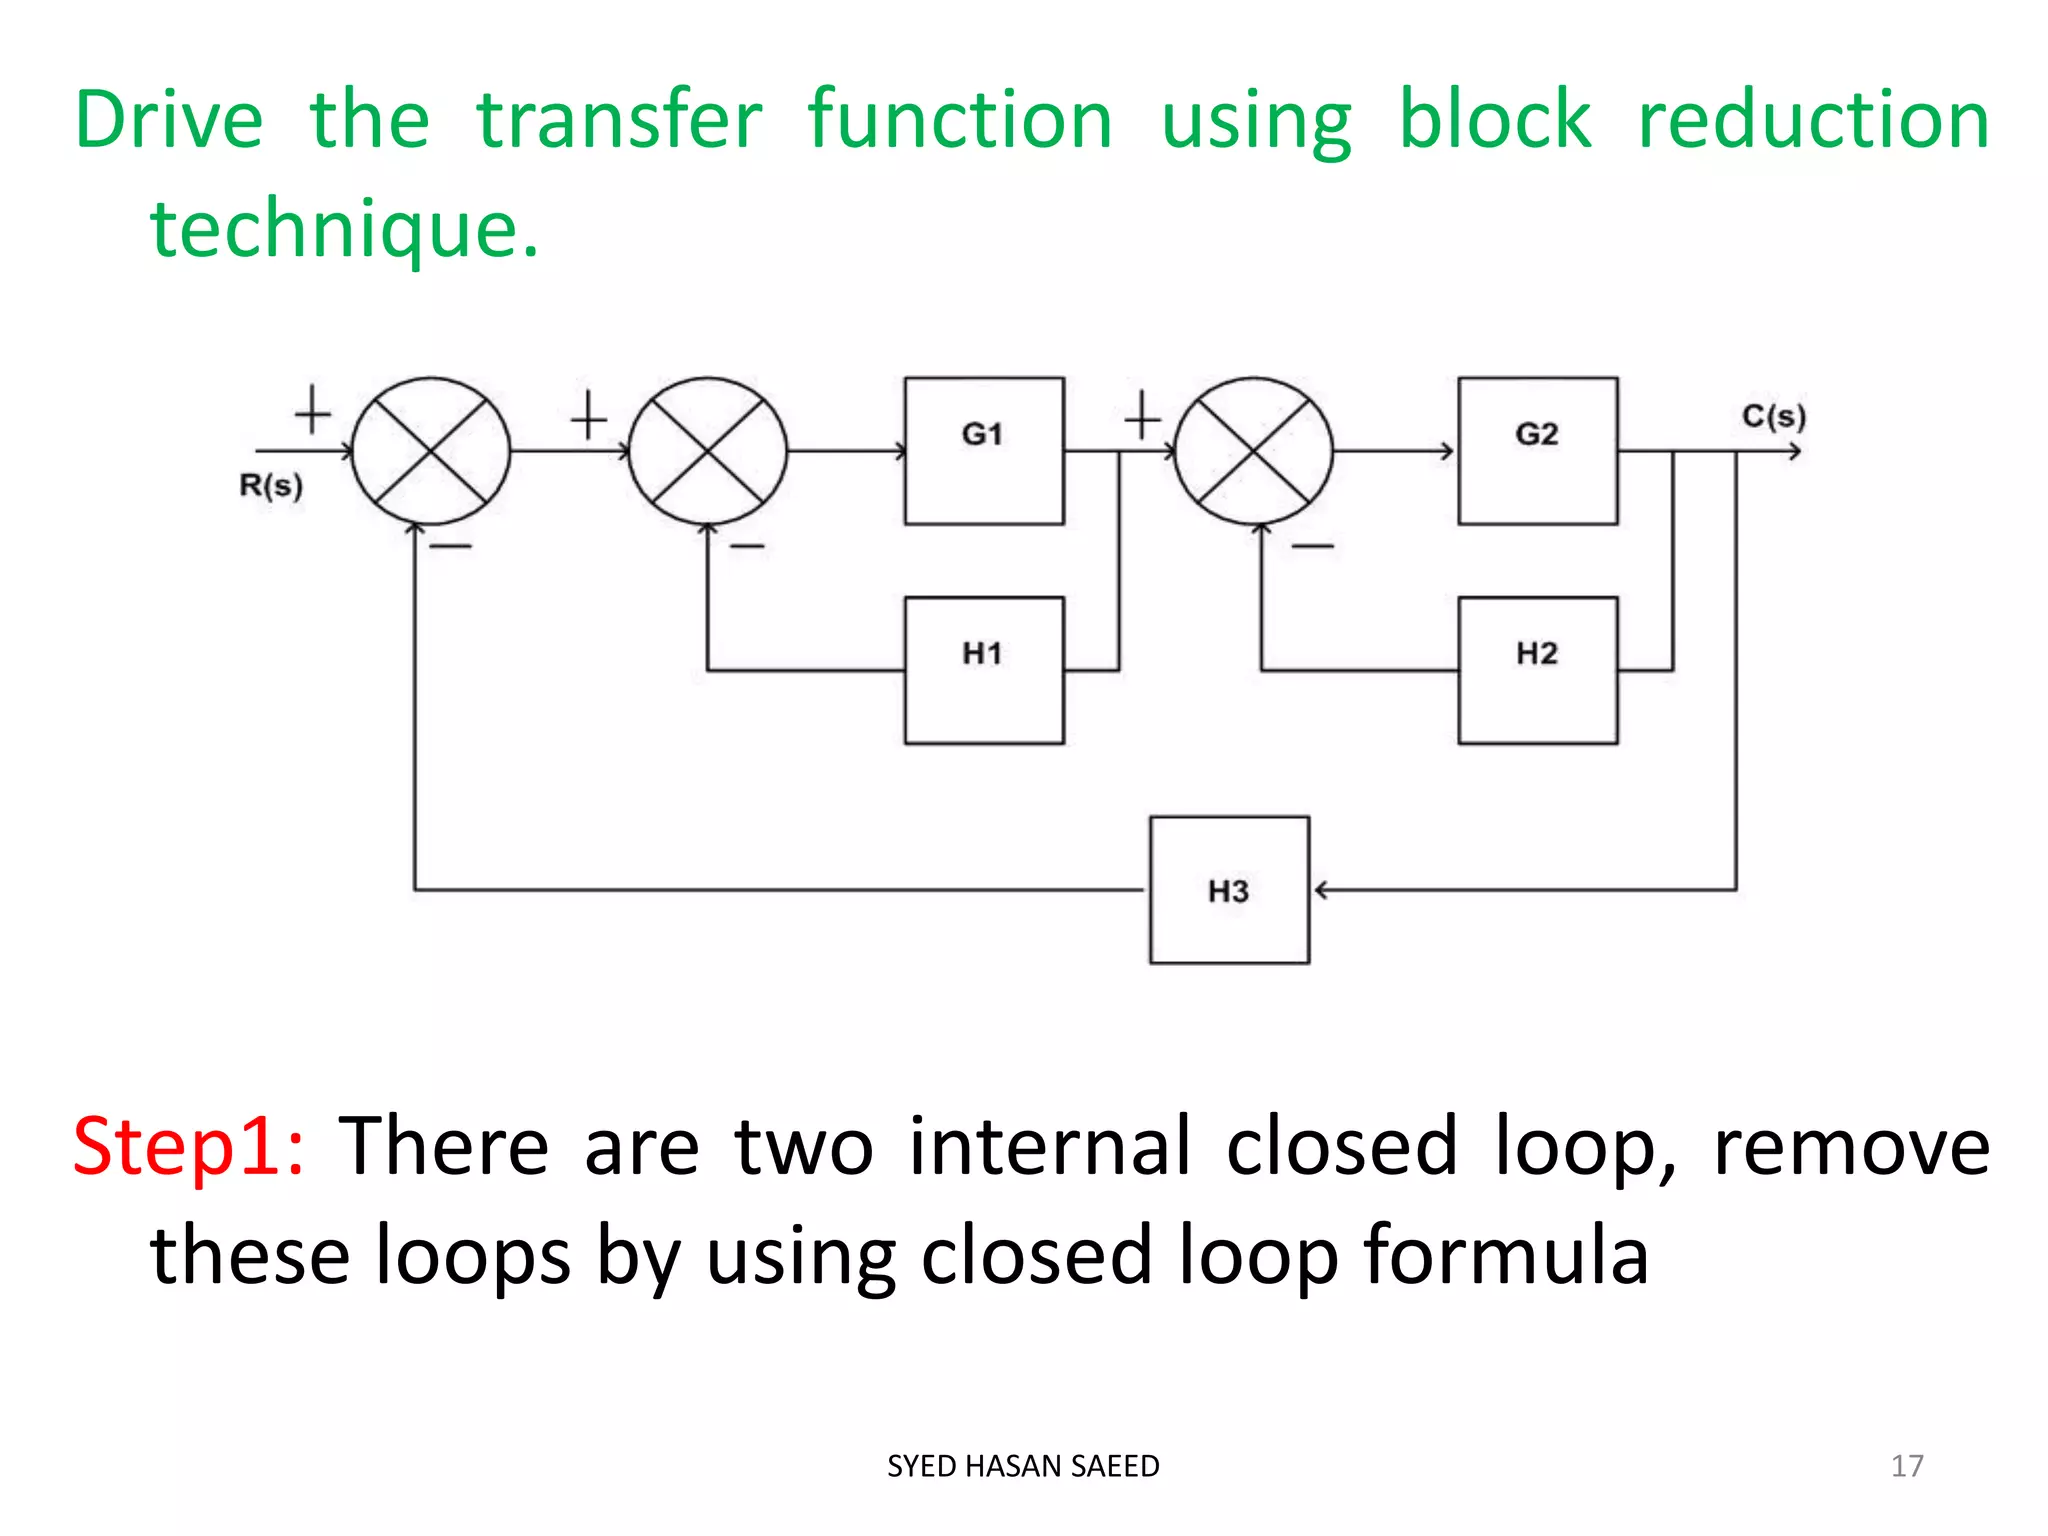
OUTLINE
 Advantages and disadvantages of block diagram.
 Terminology.
 Closed loop.
 How to draw the block diagram.
 Block reduction Technique.
SYED HASAN SAEED 1
BLOCK DIAGRAM REPRESENTATION
BLOCK DIAGRAM:
a. Block diagram is a pictorial representation of the
system.
b. Block diagram represent the relationship
between input and output.
c. Any complicated system can be represented by
connecting the different block.
d. Each block is completely characterized by a
transfer function.
SYED HASAN SAEED 2
ADVANTAGES OF BLOCK DIAGRAM:
a. A block may represent a single component or a
group of components.
b. Performance of a system can be determined by
block diagram.
c. Block diagram is helpful for designing and
analysis of a system.
d. Construction of block diagram is simple for any
complicated system.
e. The operation of any system can be easily
observed by block diagram representation.
SYED HASAN SAEED 3
DISADVANTAGES OF BLOCK DIAGRAM:
a. Source of energy is not shown in the diagram.
b. Block diagram does not give any information
about the physical construction of the system.
c. Applicable only for linear time invariant system.
d. It requires more time.
e. It is not a systematic method.
f. For a given system, the block diagram is not
unique.
SYED HASAN SAEED 4
Following figure shows the different components of
block diagram
Input R(s) C(s) output
The arrow pointing towards block indicates input
R(s) and arrow head leading away from the block
represent the output C(s).
or
SYED HASAN SAEED 5
Transfer
Function
G(S)
)(
)(
)(
sR
sC
sG )()()( sRsGsC 
The flow of system variables from one block to
another block is represented by the arrow. In
addition to this, the sum of the signals or the
difference of the signals are represented by a
summing point as shown in figure.
A + C=A+B
+
B
The plus or minus sign at each arrow head indicates
whether the signal is to be added or subtracted.
SYED HASAN SAEED 6
Application of one input source to two or more block is
represented by a take off point. Take off point also
known as branch point, shown below
Forward path: The direction of flow of signal from input
to output.
Feedback path: The direction of flow of signal is from
output to input.
SYED HASAN SAEED 7
G1
G2
BLOCK DIAGRAM OF A CLOSED LOOP SYSTEM
r(t) = reference input signal
c(t)= controlled output
e(t)= error signal
b(t)= feedback signal
R(s)=Laplace transform of
input
C(s)= Laplace transform of
output
B(s) Laplace transform of
feedback signal
E(s) Laplace transform of
error signal
Block diagram
C(s)
SYED HASAN SAEED 8
G(s)
H(s)
From the figure
The error signal is
From above equations we get
SYED HASAN SAEED 9
)2_________()()()(
)1_________()()()(
sHsCsB
sEsGsC


)()()( sBsRsE 
 
 
)3______(__________
)()(1
)(
)(
)(
)()()()(1)(
)()()()()()(
)()()()()(
)()()()(
sHsG
sG
sR
sC
sHsGsHsGsC
sCsHsGsRsGsC
sBsGsRsGsC
sBsRsGsC






Equation (3) is for negative feedback.
For positive feedback equation (3) becomes
SYED HASAN SAEED 10
)()(1
)(
)(
)(
sHsG
sG
sR
sC


HOW TO DRAW BLOCK DIAGRAM ?
Draw the block diagram of the given circuit.
SYED HASAN SAEED 11
Apply KVL
Laplace Transform of equations (1) & (2) with initial
condition zero.
SYED HASAN SAEED 12
)2(
)1(


dt
di
Lv
dt
di
LRiv
o
i
)5()()(
)4())(()(
)3()()()(



ssLIsV
sLRsIsV
ssLIRsIsV
o
i
i
From equations (4) & (5)
From fig.
Laplace transform of above equations
SYED HASAN SAEED 13
)7(
)6(




dt
di
Lv
R
vv
i
o
oi
 
)9()()(
)8()()(
1
)(


ssLIsV
sVsV
R
sI
o
oi
sLR
sL
sV
sV
i
o


)(
)(
Vi(s) Vi(s)-Vo(s) I(s)
+
-
Vo(s)
SYED HASAN SAEED 14
1/R
SYED HASAN SAEED 15
BLOCK DIAGRAM REDUCTION
SYED HASAN SAEED 16
Note: Above table is from my own book “Automatic Control System, published by Kataria & Sons, Delhi
Drive the transfer function using block reduction
technique.
Step1: There are two internal closed loop, remove
these loops by using closed loop formula
SYED HASAN SAEED 17
Step 2: Two blocks are cascade
Step 3: Again it is a closed loop
R(s) C(s)
Step 4: required transfer function
SYED HASAN SAEED 18
21212312211
21
1 HHGGGHGHGHG
GG

21213212211
21
1)(
)(
HHGGHGGHGHG
GG
sR
sC


THANK YOU
SYED HASAN SAEED 19

Block diagram representation 3

  • 1.
    OUTLINE  Advantages anddisadvantages of block diagram.  Terminology.  Closed loop.  How to draw the block diagram.  Block reduction Technique. SYED HASAN SAEED 1
  • 2.
    BLOCK DIAGRAM REPRESENTATION BLOCKDIAGRAM: a. Block diagram is a pictorial representation of the system. b. Block diagram represent the relationship between input and output. c. Any complicated system can be represented by connecting the different block. d. Each block is completely characterized by a transfer function. SYED HASAN SAEED 2
  • 3.
    ADVANTAGES OF BLOCKDIAGRAM: a. A block may represent a single component or a group of components. b. Performance of a system can be determined by block diagram. c. Block diagram is helpful for designing and analysis of a system. d. Construction of block diagram is simple for any complicated system. e. The operation of any system can be easily observed by block diagram representation. SYED HASAN SAEED 3
  • 4.
    DISADVANTAGES OF BLOCKDIAGRAM: a. Source of energy is not shown in the diagram. b. Block diagram does not give any information about the physical construction of the system. c. Applicable only for linear time invariant system. d. It requires more time. e. It is not a systematic method. f. For a given system, the block diagram is not unique. SYED HASAN SAEED 4
  • 5.
    Following figure showsthe different components of block diagram Input R(s) C(s) output The arrow pointing towards block indicates input R(s) and arrow head leading away from the block represent the output C(s). or SYED HASAN SAEED 5 Transfer Function G(S) )( )( )( sR sC sG )()()( sRsGsC 
  • 6.
    The flow ofsystem variables from one block to another block is represented by the arrow. In addition to this, the sum of the signals or the difference of the signals are represented by a summing point as shown in figure. A + C=A+B + B The plus or minus sign at each arrow head indicates whether the signal is to be added or subtracted. SYED HASAN SAEED 6
  • 7.
    Application of oneinput source to two or more block is represented by a take off point. Take off point also known as branch point, shown below Forward path: The direction of flow of signal from input to output. Feedback path: The direction of flow of signal is from output to input. SYED HASAN SAEED 7 G1 G2
  • 8.
    BLOCK DIAGRAM OFA CLOSED LOOP SYSTEM r(t) = reference input signal c(t)= controlled output e(t)= error signal b(t)= feedback signal R(s)=Laplace transform of input C(s)= Laplace transform of output B(s) Laplace transform of feedback signal E(s) Laplace transform of error signal Block diagram C(s) SYED HASAN SAEED 8 G(s) H(s)
  • 9.
    From the figure Theerror signal is From above equations we get SYED HASAN SAEED 9 )2_________()()()( )1_________()()()( sHsCsB sEsGsC   )()()( sBsRsE      )3______(__________ )()(1 )( )( )( )()()()(1)( )()()()()()( )()()()()( )()()()( sHsG sG sR sC sHsGsHsGsC sCsHsGsRsGsC sBsGsRsGsC sBsRsGsC      
  • 10.
    Equation (3) isfor negative feedback. For positive feedback equation (3) becomes SYED HASAN SAEED 10 )()(1 )( )( )( sHsG sG sR sC  
  • 11.
    HOW TO DRAWBLOCK DIAGRAM ? Draw the block diagram of the given circuit. SYED HASAN SAEED 11
  • 12.
    Apply KVL Laplace Transformof equations (1) & (2) with initial condition zero. SYED HASAN SAEED 12 )2( )1(   dt di Lv dt di LRiv o i )5()()( )4())(()( )3()()()(    ssLIsV sLRsIsV ssLIRsIsV o i i
  • 13.
    From equations (4)& (5) From fig. Laplace transform of above equations SYED HASAN SAEED 13 )7( )6(     dt di Lv R vv i o oi   )9()()( )8()()( 1 )(   ssLIsV sVsV R sI o oi sLR sL sV sV i o   )( )(
  • 14.
  • 15.
  • 16.
    BLOCK DIAGRAM REDUCTION SYEDHASAN SAEED 16 Note: Above table is from my own book “Automatic Control System, published by Kataria & Sons, Delhi
  • 17.
    Drive the transferfunction using block reduction technique. Step1: There are two internal closed loop, remove these loops by using closed loop formula SYED HASAN SAEED 17
  • 18.
    Step 2: Twoblocks are cascade Step 3: Again it is a closed loop R(s) C(s) Step 4: required transfer function SYED HASAN SAEED 18 21212312211 21 1 HHGGGHGHGHG GG  21213212211 21 1)( )( HHGGHGGHGHG GG sR sC  
  • 19.