Downloaded 312 times

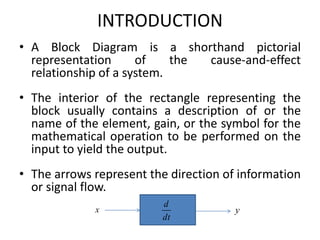
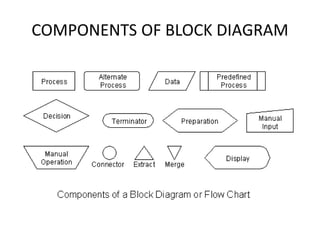
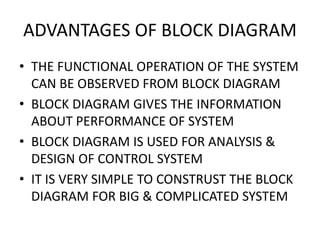
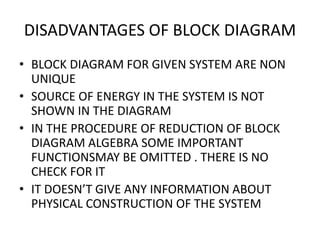
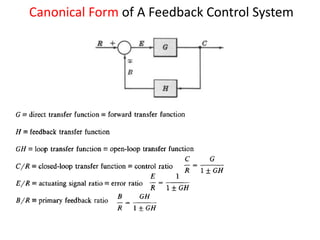
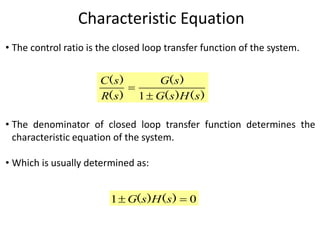
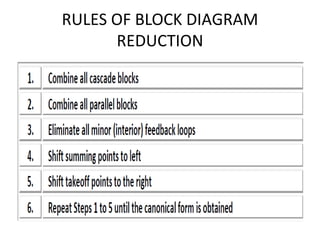
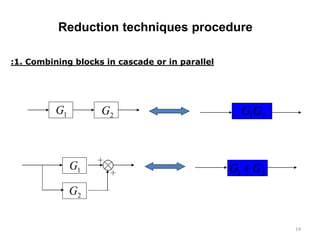
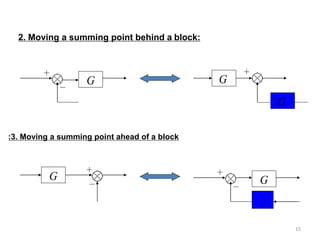
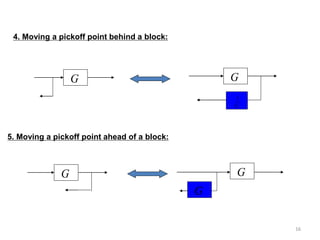
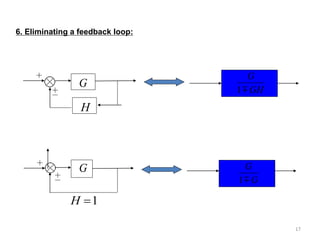
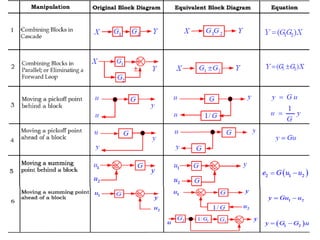


This document discusses block diagram representation. It begins by defining a block diagram as a pictorial representation of the cause-and-effect relationship of a system. Block diagrams show the components, direction of information flow with arrows, and can describe the function of each block. Block diagrams are useful for analyzing and designing control systems, but do not provide unique representations or show the physical construction or energy sources of a system. The document also discusses techniques for reducing block diagrams, such as combining or moving blocks.