This document discusses signal flow graphs and Mason's gain formula. It begins by explaining how to convert a block diagram into an equivalent signal flow graph by labeling summing points and take-off points, assigning nodes, and connecting nodes with associated gains. An example is provided. Mason's rule for reducing a signal flow graph to a transfer function is introduced. It uses the net gain formula that considers forward paths, loop gains, and non-touching loops. Another example applies Mason's rule to calculate the transfer function. In the end, some references on the topic are listed.
![References
1] Control Systems Engineering I. J. Nagrath & M Gopal New Age
International Publication(5th Edition)
2] https://bit.ly/2EZVYDY
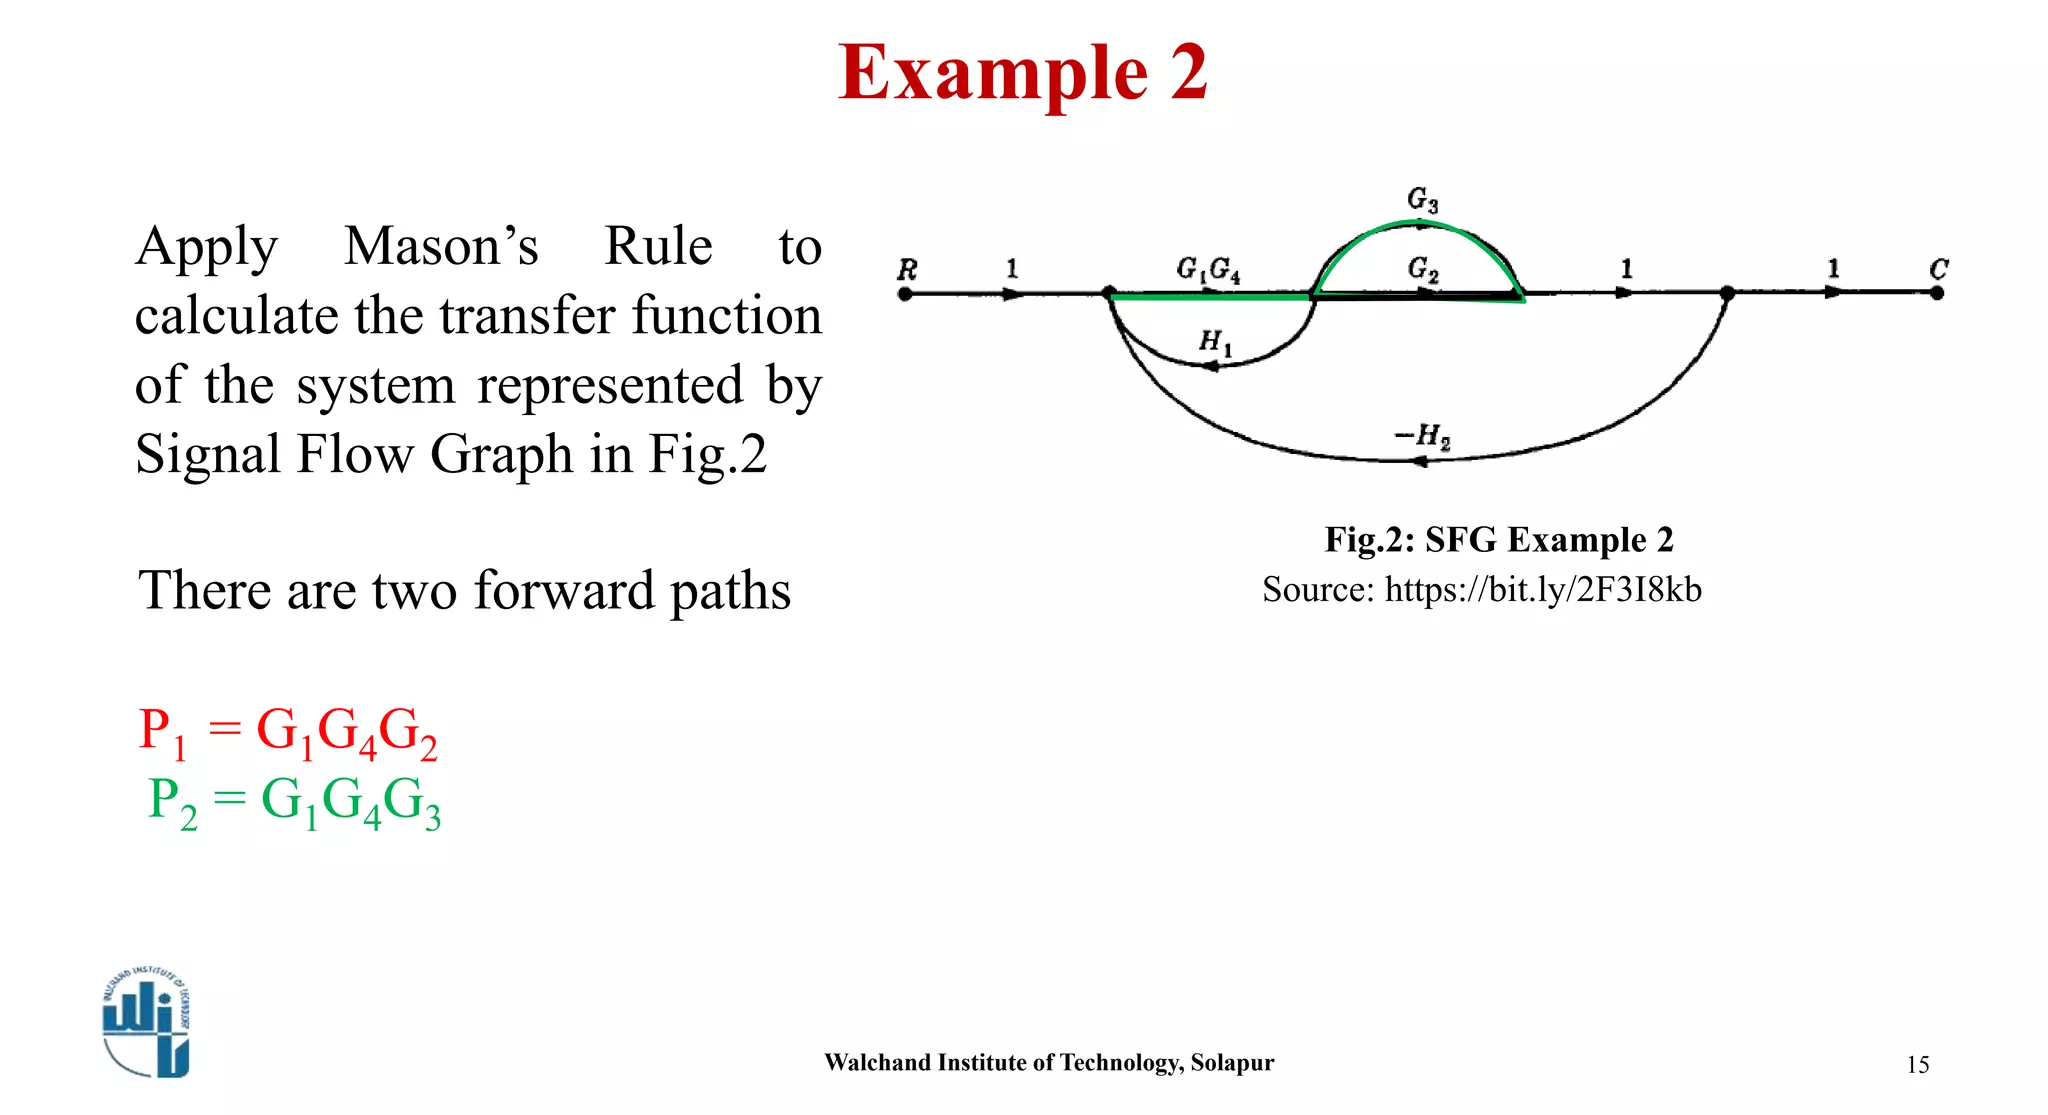
3] https://bit.ly/2F3I8kb
4] http://electricalacademia.com/control-systems/signal-flow-graphs-and
masons-gain-formula/
19Walchand Institute of Technology, Solapur](https://image.slidesharecdn.com/csppt5-190625043252/75/SFG-and-Mason-s-Gain-Formula-19-2048.jpg)