Download as PDF, PPTX
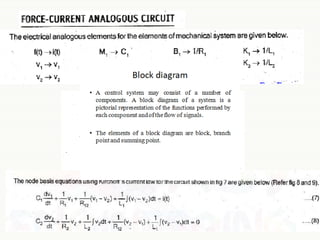
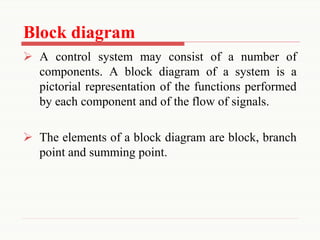
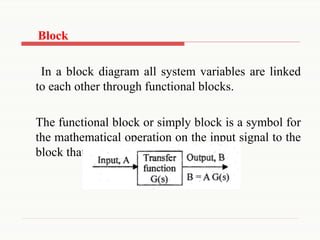
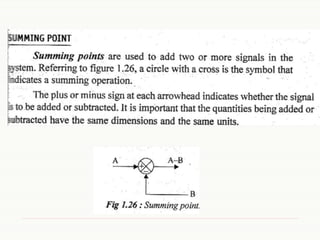
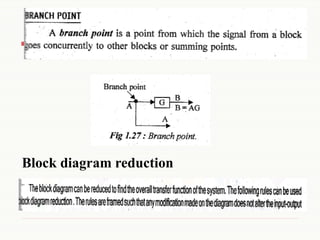
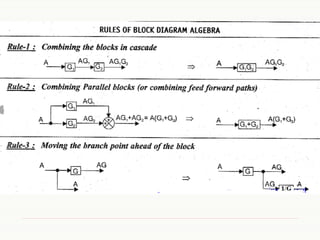
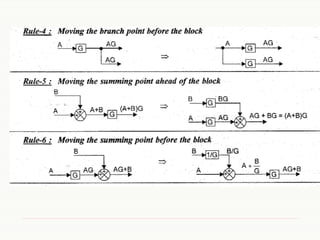
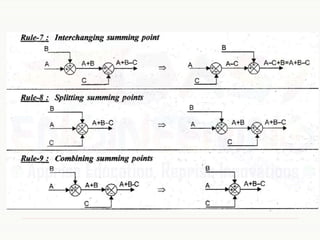
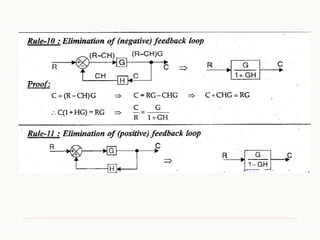
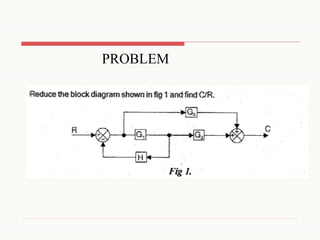
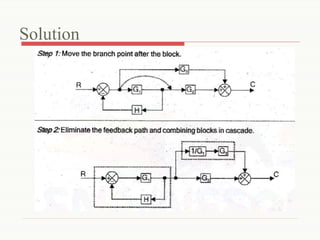
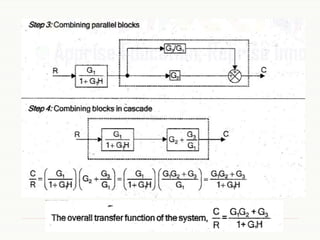
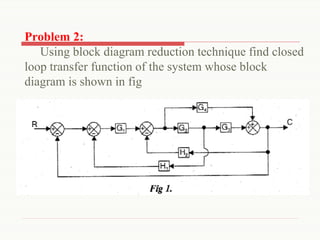
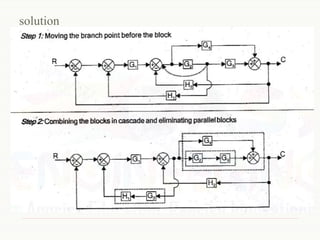
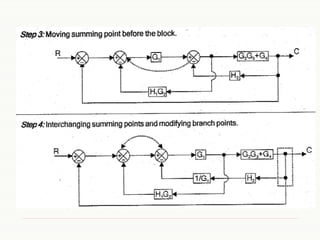
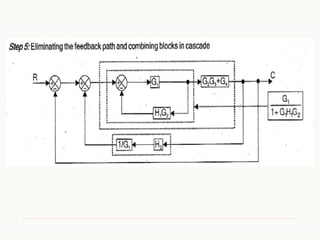
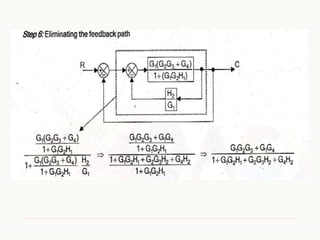
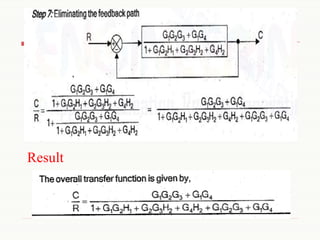
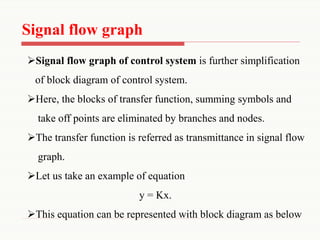
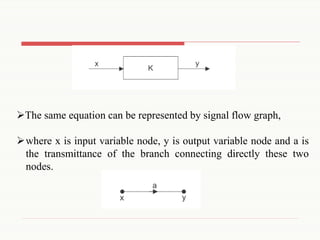

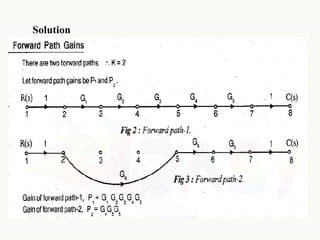
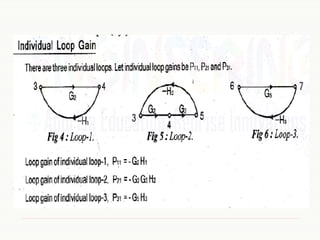
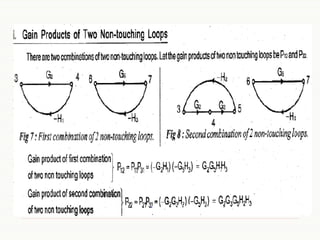
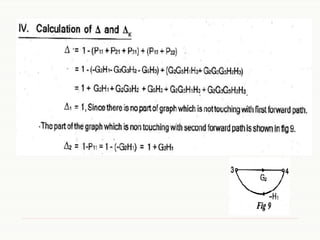
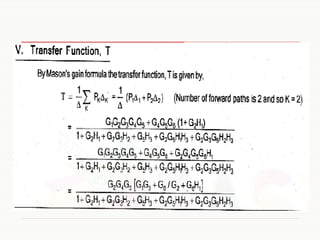
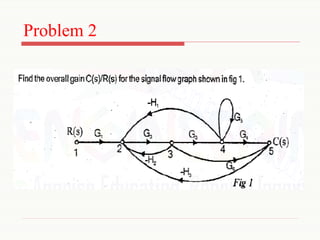
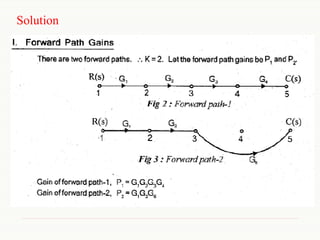
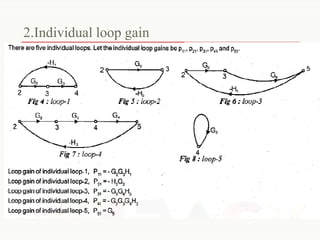


This document discusses block diagram reduction techniques and signal flow graphs. It defines a block diagram as a pictorial representation of the functions and signal flows in a control system. Block diagram reduction techniques can be used to simplify block diagrams and find closed loop transfer functions. Signal flow graphs further simplify block diagrams by removing blocks and using branches and nodes instead, with transfer functions called transmittances. Examples are given of representing equations as block diagrams and signal flow graphs. Problems are presented and solved as examples of using these techniques.