Download as PDF, PPTX


![[[Credit line to be added]]
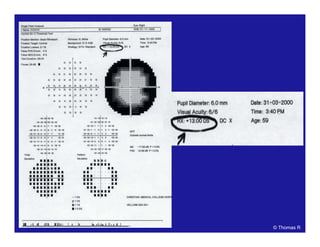
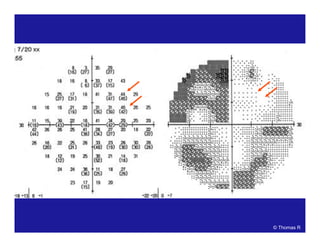
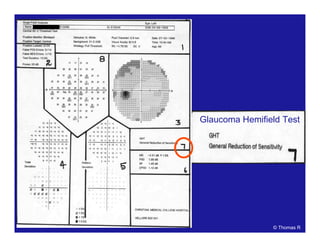
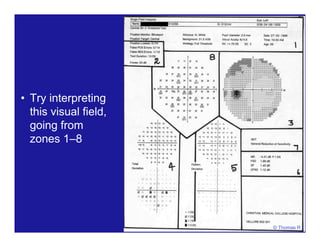
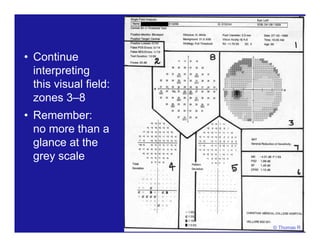
Probability
plots
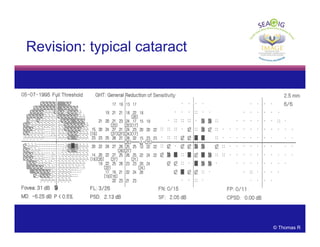
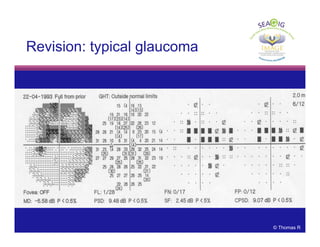
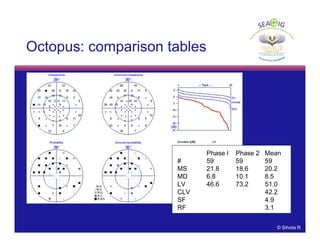
Comparison
tables
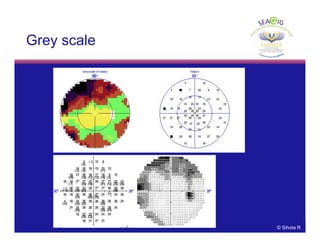
Grey scale
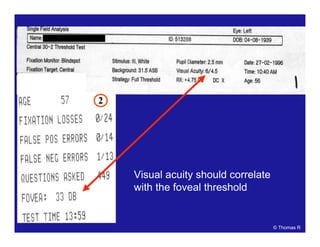
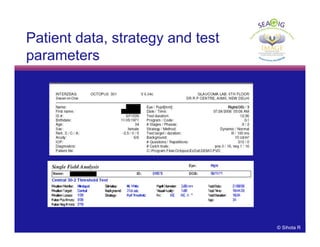
Patient data
and refraction
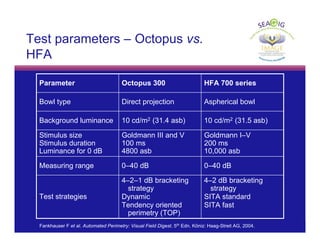
Strategy and
test parameters
Actual values
Bebie (defect)
curve
Deviation
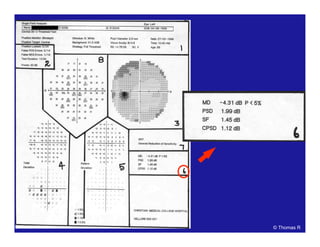
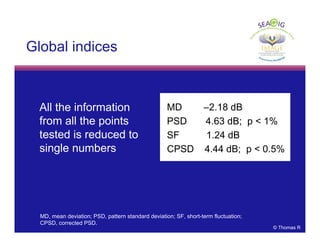
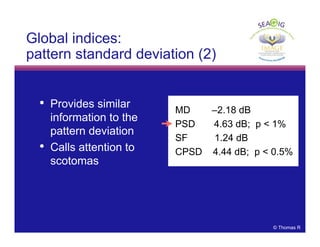
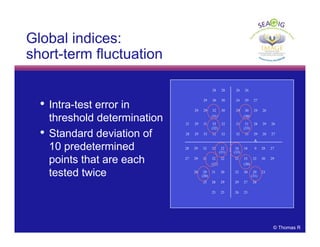
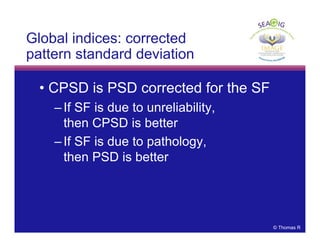
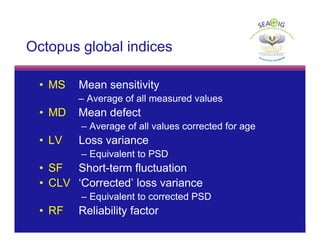
Global indices
RP: permission
requested](https://image.slidesharecdn.com/autoperinm-130613000312-phpapp02/85/Auto-perimetry-108-320.jpg)
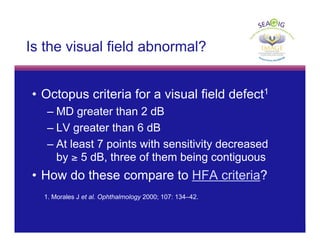
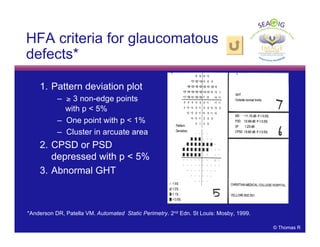
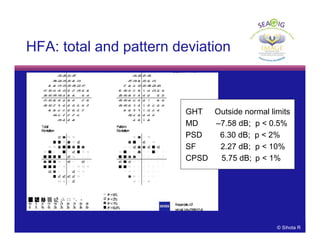

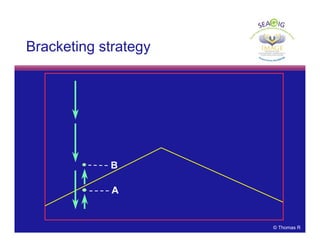
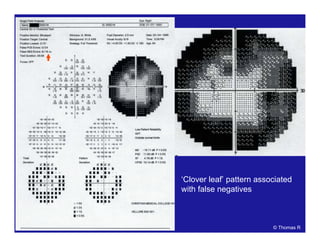
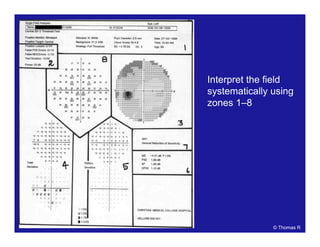
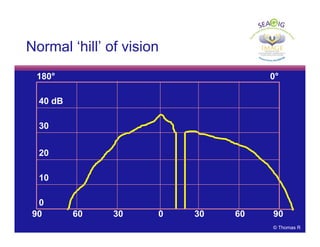
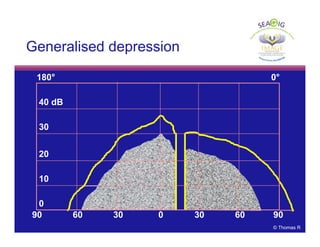
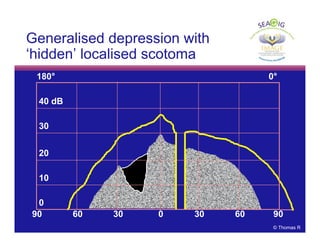
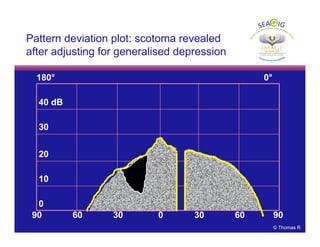
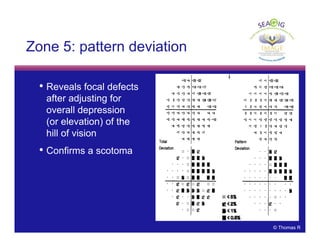
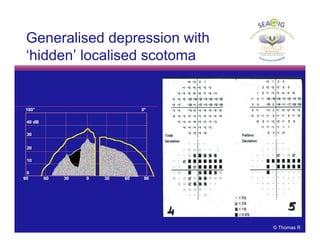
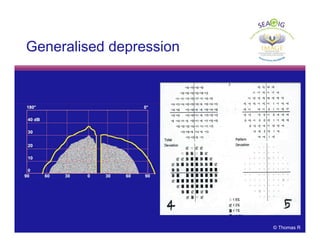
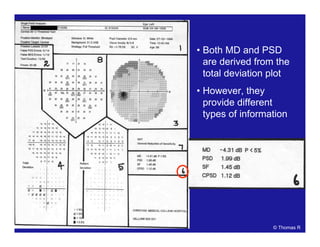
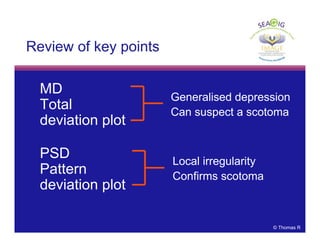
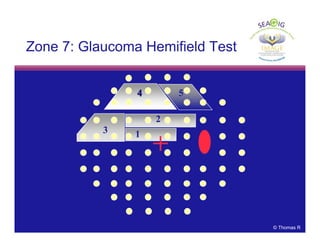
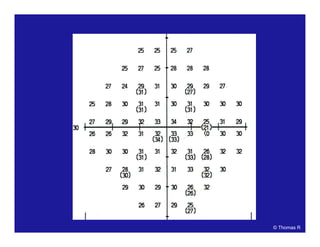
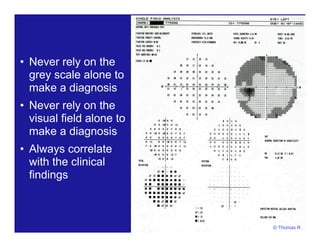
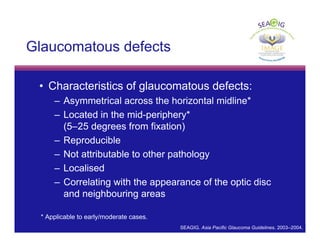
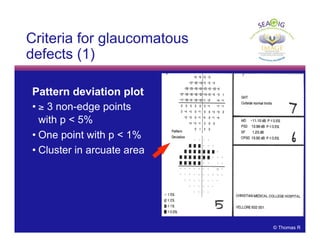
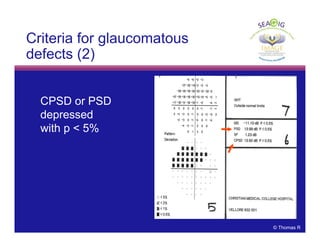
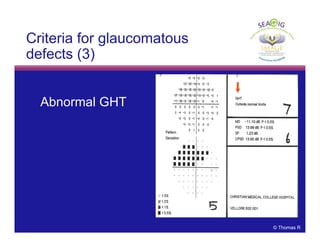
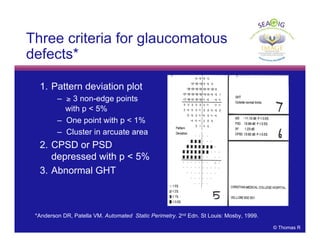
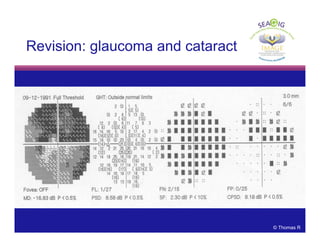
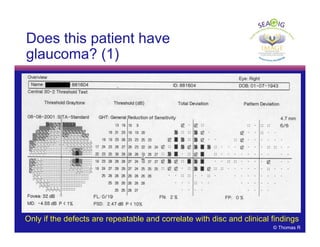
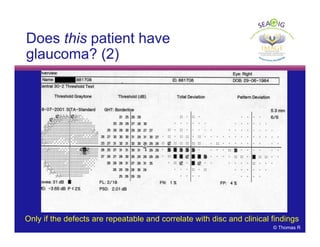
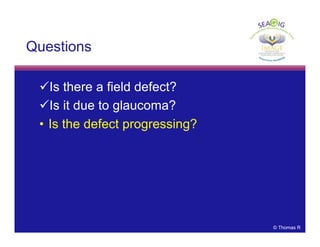
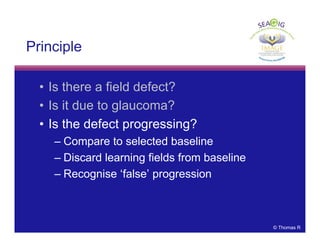
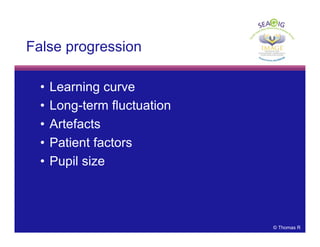
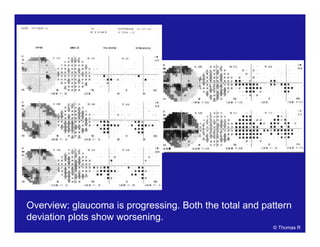
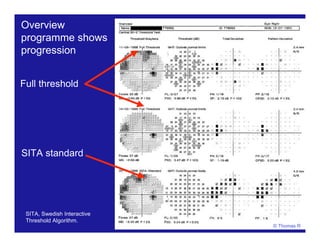
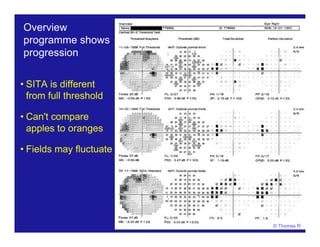
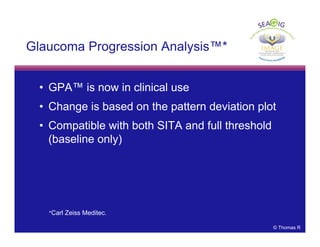
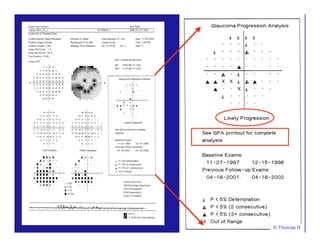
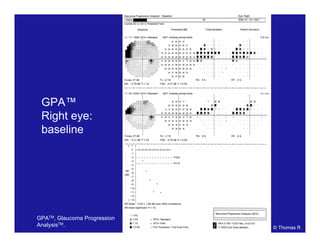
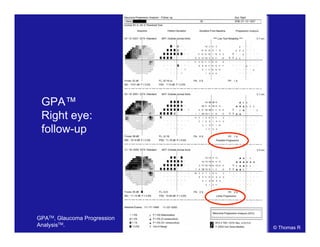
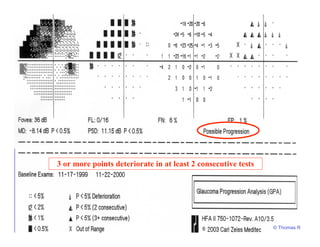
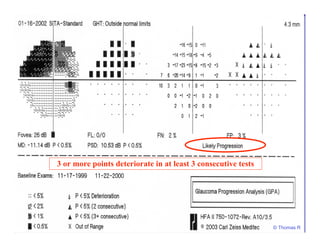
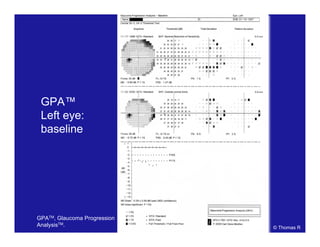
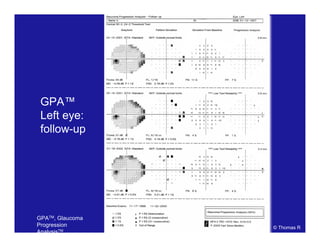
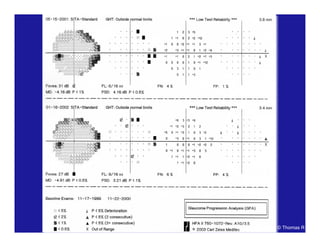
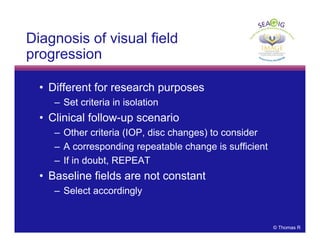
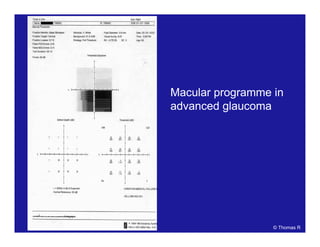
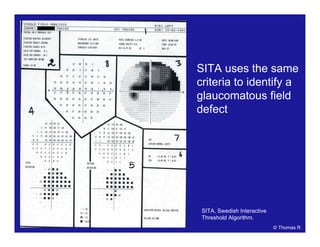
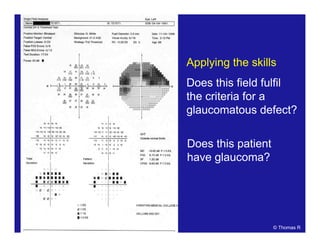
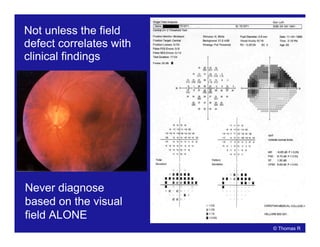
This document discusses automated perimetry and the interpretation of visual field tests. It covers perimeter logic and identifying field defects, criteria for glaucomatous defects, and detecting glaucomatous progression. Key points include interpreting visual fields systematically using total and pattern deviation plots in 8 zones, criteria for identifying glaucomatous defects including abnormalities in the pattern deviation plot, global indices, and techniques for detecting progression such as the overview program and Glaucoma Progression Analysis. Interpretation requires correlating results with clinical findings and considering factors like learning effects and fluctuation.


![PERI-PROSTHETIC FRACTURE NAIL-PLATE CONSTRUCT [NPC].pptx](https://cdn.slidesharecdn.com/ss_thumbnails/drarunkumardrmohamedashrafperiprostheticfrasturenail-plateconstructnpc-260209164459-7e9d15a1-thumbnail.jpg?width=640&height=640&fit=bounds)
