Downloaded 955 times

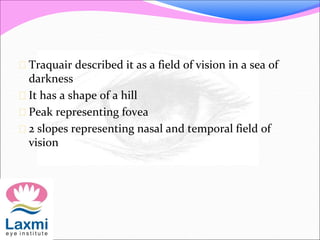


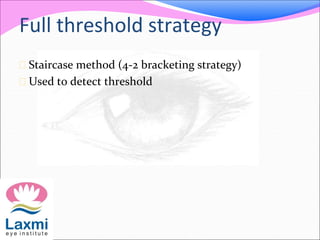


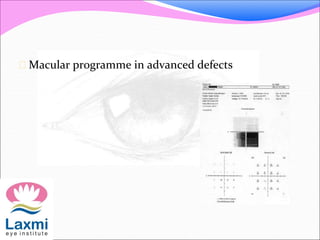


Automated perimetry is an important diagnostic test used to map the visual field and detect progression of diseases like glaucoma. There are two main types - kinetic perimetry where a stimulus is moved and static perimetry where stimulus intensity is varied at fixed points. Static perimetry provides a more accurate 3D representation of the visual field. Different testing strategies like full threshold, threshold, and suprathreshold are used to detect visual field defects. Automated perimetry generates various indices to analyze results and detect progression of defects over time through comparison to baseline tests. Care must be taken to avoid sources of error and false indications of change.