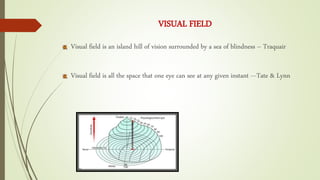
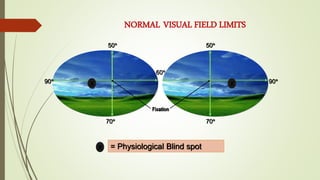
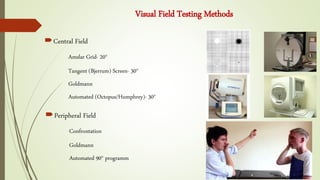
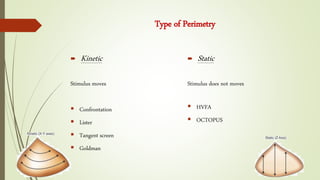
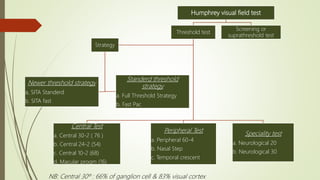
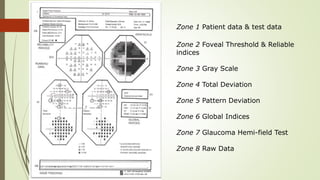
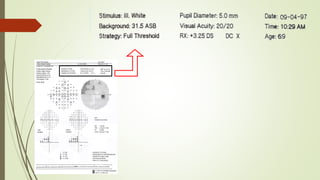
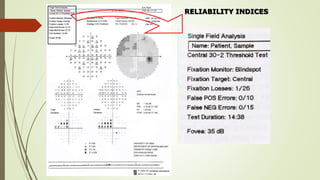
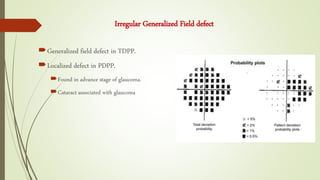
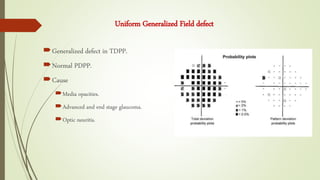
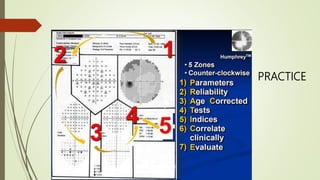
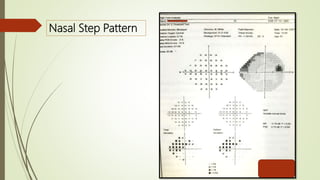
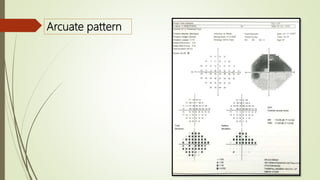
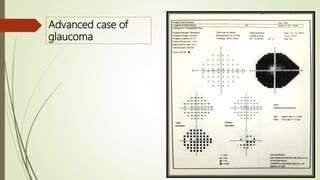
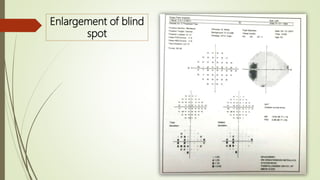
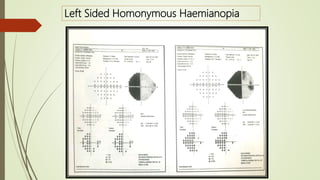
PERIMETRY
&
HUMPHREY VISUAL FIELD ASSAY
Lt Col A.K.M. Rashed-Ul-Hasan
Long Term Fellow Trainee(Glaucoma)
CMH Dhaka
VISUAL FIELD
Visual field is an island hill of vision surrounded by a sea of blindness – Traquair
Visual field is all the space that one eye can see at any given instant ---Tate & Lynn
60
50 50
90 90
70 70
Fixation
X X
= Physiological Blind spot
X
NORMAL VISUAL FIELD LIMITS
Visual Field Testing Methods
Central Field
Amslar Grid- 20°
Tangent (Bjerrum) Screen- 30°
Goldmann
Automated (Octopus/Humphrey)- 30°
Peripheral Field
Confrontation
Goldmann
Automated 90° programm
Location of Visual Field Defects
Peripheral
> 30º
 Central
5º or less from the point of fixation
Paracentral
>5º – 30º
Ceacal
Paraceacal
Periceacal
Centroceacal
Perimetry is defined simply as the study of the visual field .
PERIMETRY & PERIMETER
Perimeter is an instrument designed for perimetry.
 Kinetic
Stimulus moves
 Confrontation
 Lister
 Tangent screen
 Goldman
Type of Perimetry
 Static
Stimulus does not moves
 HVFA
 OCTOPUS
Static Kinetic
 VFD detect earlier with 20% defect
 Area fixed but stimulus varies in intensity
 3D
 Computarized
 Threshold type
 Less error
 Both glaucoma and neurological
 VFD detect earlier with 40% defect
 Intensity fixed but stimulus moves from non-seeing to
seeing area
 2D
 Not Computarized
 Non Threshold type
 More error
 Good for neurological, periphery of field & adv glaucoma
Role of Perimetry
1.To diagnose clinical conditions.
A) Ocular- Glaucoma, Optic nerve disorders.
B) CNS conditions- Optic nerve pathway disorders.
CNS Tumors.
Occipital lobe disorders.
2. To manage glaucoma.
To set target IOP
Follow up.
Different types of Automated Perimetry
THRESHOLD
If a particular intensity of light is shown 100 times and if it is
appreciated 50 times then that particular intensity of light is
termed as threshold.
Determination of threshold
APOSTILB (Asb)
 Absolute units of light intensity / brightness
 Humphrey : 1 - 10,000 asb
 Goldman & Octopus : 1 - 1000 asb
DECIBEL (dB)
 Tenth of logarithm unit ( 1 dB = 0.1 log unit )
 Relative units of light intensity
Higher the dB lower intensity of light stimulus high retinal sensitivity.
0 dB = 10,000 asb
10 dB = 1,000 asb
20 dB = 100 asb
30 dB = 10 asb
40 dB = 1 asb
0 dB = Brightest light = low retinal sensitivity.
40 dB = Dimmest light = high retinal sensitivity.
Humphrey visual field test
Threshold test
Central Test
a. Central 30-2 ( 76 )
b. Central 24-2 (54)
c. Central 10-2 (68)
d. Macular progm (16)
Peripheral Test
a. Peripheral 60-4
b. Nasal Step
c. Temporal crescent
Speciality test
a. Neurological 20
b. Neurological 30
Strategy
Standerd threshold
strategy
a. Full Threshold Strategy
b. Fast Pac
Newer threshold strategy
a, SITA Standerd
b. SITA fast
Screening or
suprathreshold test
NB: Central 30º : 66% of ganglion cell & 83% visual cortex
Interpretation
Zone 1 Patient data & test data
Zone 2 Foveal Threshold & Reliable
indices
Zone 3 Gray Scale
Zone 4 Total Deviation
Zone 5 Pattern Deviation
Zone 6 Global Indices
Zone 7 Glaucoma Hemi-field Test
Zone 8 Raw Data
0.2 second duration
The effect of size of pupil:
 Pupil should be 3-4 mm
 Constricted pupil
 Diffuse visual field depression
 Edge scotoma
 Very important in follow up test
RELIABILITY INDICES
 Central :
Yellow light at centre of bowl.
 Small diamond :
Below the central target
Macular degeneration
 Large diamond :
When central fixation lost
Central scotoma
 Bottom LED:
Superior field test
Fixation of target
Fixation loss
 Indicates steadiness of gaze during the
test
 >20% is unreliable
 5% Stimulus is presented over blind spot
False positive
>15% is unreliable (SITA Standard)
>33% is unreliable (Full threshold)
 Trigger Happy
Abnormally pale
False Negative
>15% is unreliable (SITA Standard)
>33% is unreliable (Full threshold)
 Fatigue, inattention, malingering
Clover leaf patern
Gaze Tracker
Upward spikes: indicating eye movements
Downward spikes: indicating blinking during stimulus presentation.
Total Deviation plots
1. Numeric value in upper plot
Diff. in dB between the patients test results and the age corrected normal values a
each tested point in the visual Field.
Value is abnormal : if >5 dB less than normal .
2. Gray scale symbols in lower plot
translates values of upper plot, Darker the symbols, more the depth of defect
3. Generalized depression:
A. Media opacities
B. Refractive error
C. Miosis
Pattern Deviation
 It is derived from total deviation values and
adjusted to demonstrates the localized defect.
P Value
Global Indices
It’s the summary values that represent distilled statistical information.
Used to monitor progression of glaucomatous damage
Consist :
1. VFI: Patient’s overall VF function.
2. MD: Overall sensitivity of the field.
3. PSD: Focal loss within the field.
Glaucoma Hemifield Test
Compare 5 zone of upper field with mirror image of lower field to see asymmetric field
loss in glaucoma.
5 comments
1. Outside normal limit
2. Borderline
3. General reduction of sensitivity
4. Abnormal high sensitivity
5. With in normal limit
Localized Field defect
 The TDPP and PDPP looks similar.
 Causes-
Early glaucomatous ON damage
AION
ON pathway defect
Occipital lobe infarcts
Generalized field defect in TDPP.
Localized defect in PDPP.
Found in advance stage of glaucoma.
Cataract associated with glaucoma
Irregular Generalized Field defect
Generalized defect in TDPP.
Normal PDPP.
Cause
Media opacities.
Advanced and end stage glaucoma.
Optic neuritis.
Uniform Generalized Field defect
PRACTICE
Nasal Step Pattern
Arcuate pattern
Advanced case of
glaucoma
Enlargement of blind
spot
Left Sided Homonymous Haemianopia
Bi-nasal hemianopia
Bi-temporal hemianopia
AION
Upper Haemiretinal Vein Occlusion
Tubular field
defect due to RP
Toxoplasma
choroidoretinitis
Glaucomatous Field Defect
Progression of field defects in POAG
 Initially observed in Bjerrum’s area ( 10 ˚ -25 ˚ from fixation)
Generalised contraction of field
Baring of blind spot : exclusion of the blind spot from the central
field due to inward curve of the outer boundary of 30° central field
(Fig A)
Small wing-shaped paracentral scotoma (Fig B)
Seidel’s scotoma : paracental scotoma joins the blind spot (Fig C)
Arcuate or Bjerrum’s scotoma: by the extension of Seidel’s
scotoma in an area either above or below the fixation point to
reach the horizontal line (Fig D)
Ring or double arcuate scotoma & Roenne's central nasal
step : when the two arcuate scotomas join (Fig E)
Advanced glaucomatous field defects : Tubulur vision
Perimetry & Humprey visual field assay (HVFA)

Perimetry & Humprey visual field assay (HVFA)

  • 1.
    PERIMETRY & HUMPHREY VISUAL FIELDASSAY Lt Col A.K.M. Rashed-Ul-Hasan Long Term Fellow Trainee(Glaucoma) CMH Dhaka
  • 2.
    VISUAL FIELD Visual fieldis an island hill of vision surrounded by a sea of blindness – Traquair Visual field is all the space that one eye can see at any given instant ---Tate & Lynn
  • 3.
    60 50 50 90 90 7070 Fixation X X = Physiological Blind spot X NORMAL VISUAL FIELD LIMITS
  • 4.
    Visual Field TestingMethods Central Field Amslar Grid- 20° Tangent (Bjerrum) Screen- 30° Goldmann Automated (Octopus/Humphrey)- 30° Peripheral Field Confrontation Goldmann Automated 90° programm
  • 5.
    Location of VisualField Defects Peripheral > 30º  Central 5º or less from the point of fixation Paracentral >5º – 30º Ceacal Paraceacal Periceacal Centroceacal
  • 6.
    Perimetry is definedsimply as the study of the visual field . PERIMETRY & PERIMETER Perimeter is an instrument designed for perimetry.
  • 7.
     Kinetic Stimulus moves Confrontation  Lister  Tangent screen  Goldman Type of Perimetry  Static Stimulus does not moves  HVFA  OCTOPUS
  • 8.
    Static Kinetic  VFDdetect earlier with 20% defect  Area fixed but stimulus varies in intensity  3D  Computarized  Threshold type  Less error  Both glaucoma and neurological  VFD detect earlier with 40% defect  Intensity fixed but stimulus moves from non-seeing to seeing area  2D  Not Computarized  Non Threshold type  More error  Good for neurological, periphery of field & adv glaucoma
  • 9.
    Role of Perimetry 1.Todiagnose clinical conditions. A) Ocular- Glaucoma, Optic nerve disorders. B) CNS conditions- Optic nerve pathway disorders. CNS Tumors. Occipital lobe disorders. 2. To manage glaucoma. To set target IOP Follow up.
  • 10.
    Different types ofAutomated Perimetry
  • 11.
    THRESHOLD If a particularintensity of light is shown 100 times and if it is appreciated 50 times then that particular intensity of light is termed as threshold.
  • 12.
  • 13.
    APOSTILB (Asb)  Absoluteunits of light intensity / brightness  Humphrey : 1 - 10,000 asb  Goldman & Octopus : 1 - 1000 asb
  • 14.
    DECIBEL (dB)  Tenthof logarithm unit ( 1 dB = 0.1 log unit )  Relative units of light intensity Higher the dB lower intensity of light stimulus high retinal sensitivity.
  • 15.
    0 dB =10,000 asb 10 dB = 1,000 asb 20 dB = 100 asb 30 dB = 10 asb 40 dB = 1 asb 0 dB = Brightest light = low retinal sensitivity. 40 dB = Dimmest light = high retinal sensitivity.
  • 16.
    Humphrey visual fieldtest Threshold test Central Test a. Central 30-2 ( 76 ) b. Central 24-2 (54) c. Central 10-2 (68) d. Macular progm (16) Peripheral Test a. Peripheral 60-4 b. Nasal Step c. Temporal crescent Speciality test a. Neurological 20 b. Neurological 30 Strategy Standerd threshold strategy a. Full Threshold Strategy b. Fast Pac Newer threshold strategy a, SITA Standerd b. SITA fast Screening or suprathreshold test NB: Central 30º : 66% of ganglion cell & 83% visual cortex
  • 17.
  • 18.
    Zone 1 Patientdata & test data Zone 2 Foveal Threshold & Reliable indices Zone 3 Gray Scale Zone 4 Total Deviation Zone 5 Pattern Deviation Zone 6 Global Indices Zone 7 Glaucoma Hemi-field Test Zone 8 Raw Data
  • 20.
    0.2 second duration Theeffect of size of pupil:  Pupil should be 3-4 mm  Constricted pupil  Diffuse visual field depression  Edge scotoma  Very important in follow up test
  • 21.
  • 23.
     Central : Yellowlight at centre of bowl.  Small diamond : Below the central target Macular degeneration  Large diamond : When central fixation lost Central scotoma  Bottom LED: Superior field test Fixation of target
  • 24.
    Fixation loss  Indicatessteadiness of gaze during the test  >20% is unreliable  5% Stimulus is presented over blind spot
  • 25.
    False positive >15% isunreliable (SITA Standard) >33% is unreliable (Full threshold)  Trigger Happy Abnormally pale
  • 26.
    False Negative >15% isunreliable (SITA Standard) >33% is unreliable (Full threshold)  Fatigue, inattention, malingering Clover leaf patern
  • 27.
    Gaze Tracker Upward spikes:indicating eye movements Downward spikes: indicating blinking during stimulus presentation.
  • 28.
    Total Deviation plots 1.Numeric value in upper plot Diff. in dB between the patients test results and the age corrected normal values a each tested point in the visual Field. Value is abnormal : if >5 dB less than normal . 2. Gray scale symbols in lower plot translates values of upper plot, Darker the symbols, more the depth of defect 3. Generalized depression: A. Media opacities B. Refractive error C. Miosis
  • 29.
    Pattern Deviation  Itis derived from total deviation values and adjusted to demonstrates the localized defect.
  • 30.
  • 31.
    Global Indices It’s thesummary values that represent distilled statistical information. Used to monitor progression of glaucomatous damage Consist : 1. VFI: Patient’s overall VF function. 2. MD: Overall sensitivity of the field. 3. PSD: Focal loss within the field.
  • 32.
    Glaucoma Hemifield Test Compare5 zone of upper field with mirror image of lower field to see asymmetric field loss in glaucoma. 5 comments 1. Outside normal limit 2. Borderline 3. General reduction of sensitivity 4. Abnormal high sensitivity 5. With in normal limit
  • 33.
    Localized Field defect The TDPP and PDPP looks similar.  Causes- Early glaucomatous ON damage AION ON pathway defect Occipital lobe infarcts
  • 34.
    Generalized field defectin TDPP. Localized defect in PDPP. Found in advance stage of glaucoma. Cataract associated with glaucoma Irregular Generalized Field defect
  • 35.
    Generalized defect inTDPP. Normal PDPP. Cause Media opacities. Advanced and end stage glaucoma. Optic neuritis. Uniform Generalized Field defect
  • 36.
  • 37.
  • 38.
  • 39.
  • 40.
  • 41.
  • 42.
  • 43.
  • 44.
  • 45.
  • 46.
  • 47.
  • 48.
  • 49.
    Progression of fielddefects in POAG  Initially observed in Bjerrum’s area ( 10 ˚ -25 ˚ from fixation) Generalised contraction of field Baring of blind spot : exclusion of the blind spot from the central field due to inward curve of the outer boundary of 30° central field (Fig A) Small wing-shaped paracentral scotoma (Fig B) Seidel’s scotoma : paracental scotoma joins the blind spot (Fig C) Arcuate or Bjerrum’s scotoma: by the extension of Seidel’s scotoma in an area either above or below the fixation point to reach the horizontal line (Fig D) Ring or double arcuate scotoma & Roenne's central nasal step : when the two arcuate scotomas join (Fig E) Advanced glaucomatous field defects : Tubulur vision

Editor's Notes

  • #13 A typical automated stategy present a (4-2 dB) stimulus higher than expected intensity is shown; if seen the intensity is decreased in 4 dB steps until no longer seen then it is increased again by 2 dB step until seen once more
  • #17 Central 30 : 66% of ganglion cell & 83% visual cortex
  • #24 Small Diamond: Large diamond: