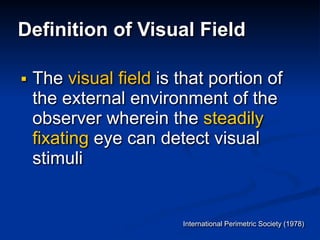
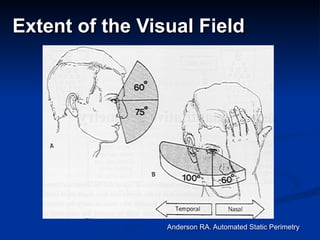
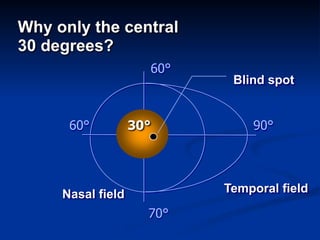
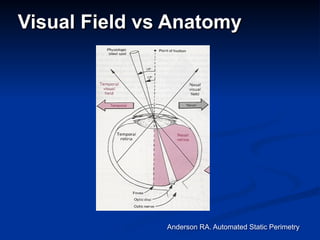
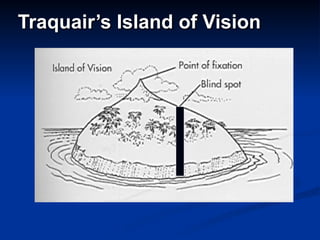
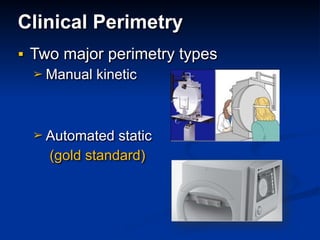
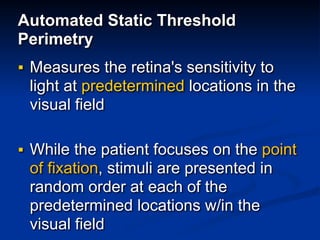
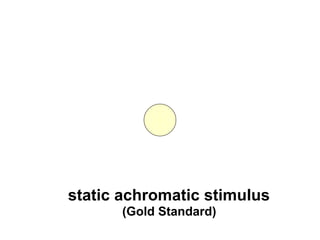
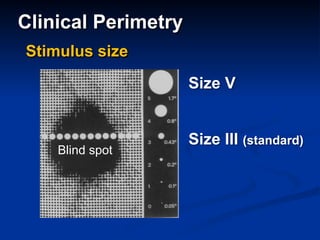
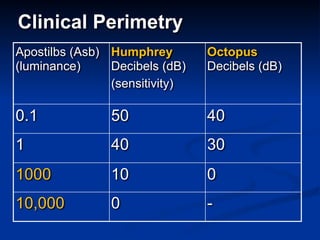
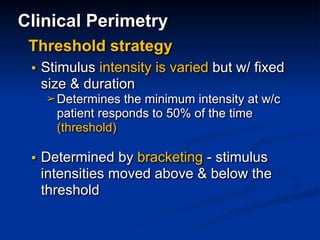
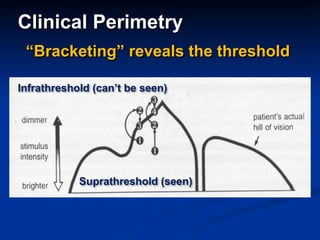
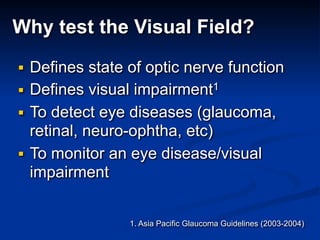
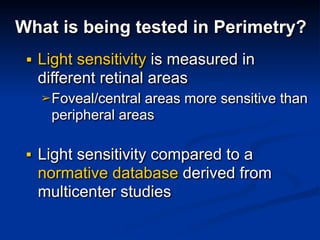
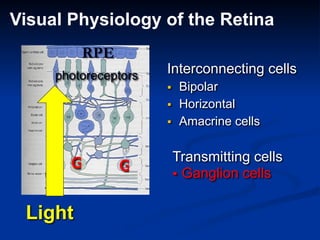
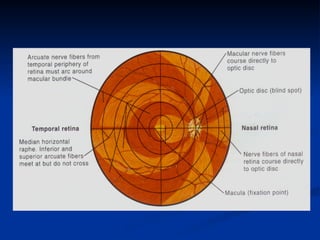
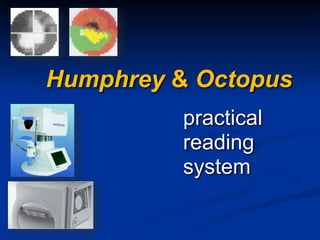
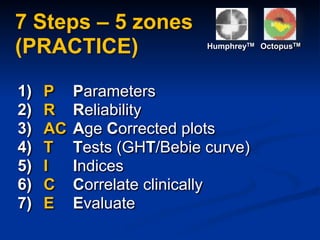
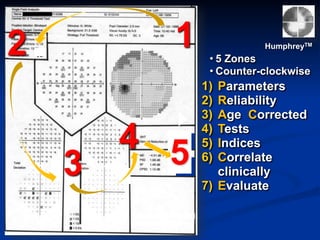
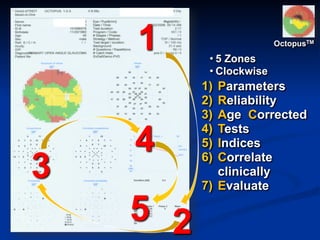
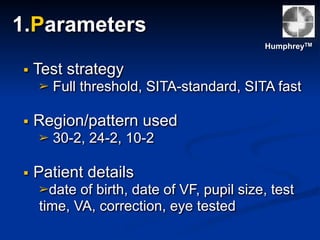
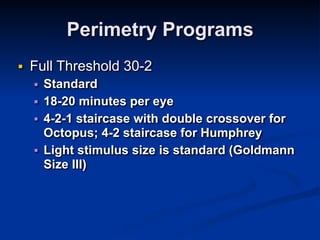
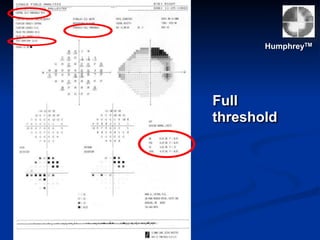
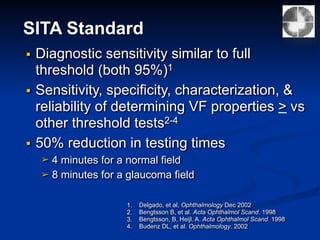
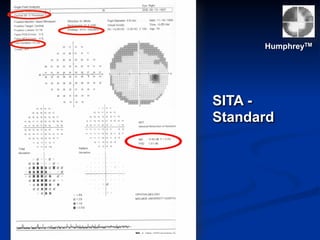
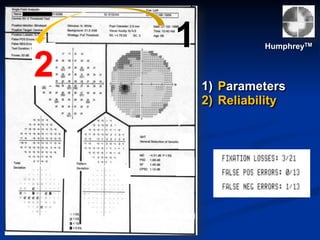
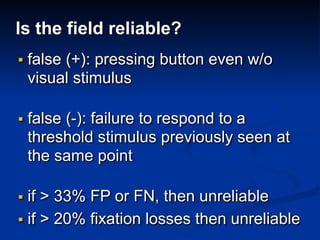
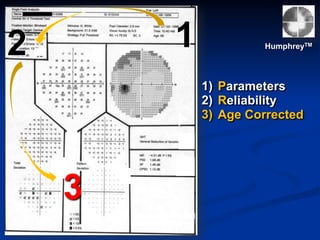
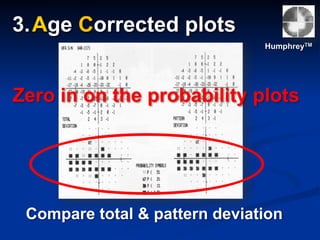
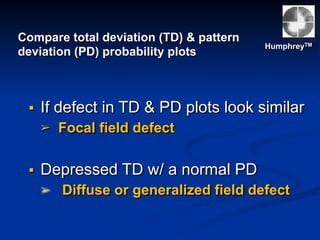
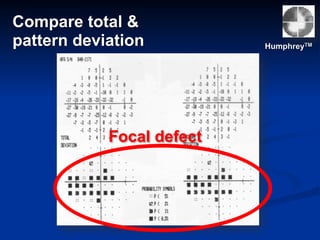
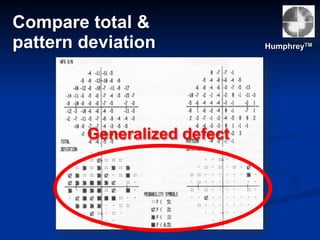
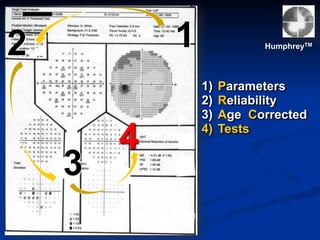
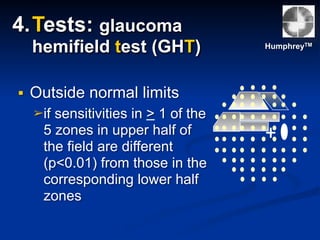
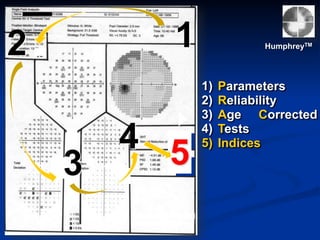
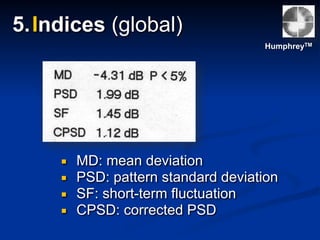
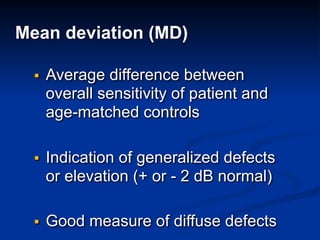
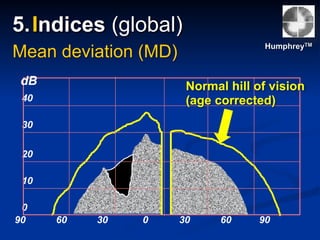
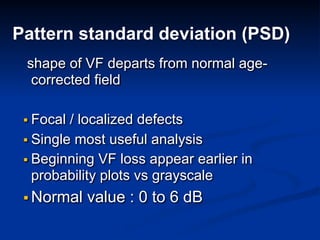
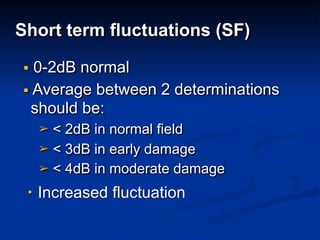
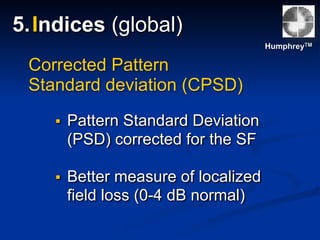
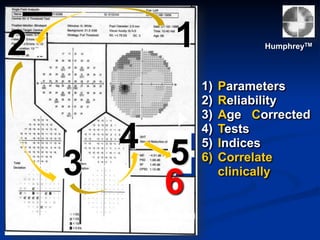
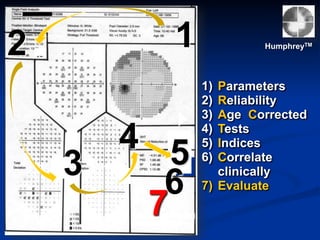
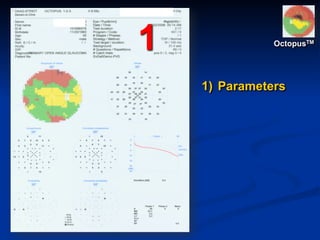
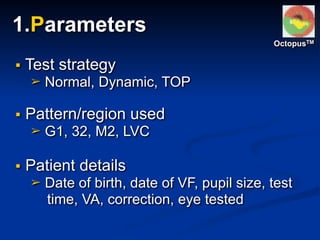
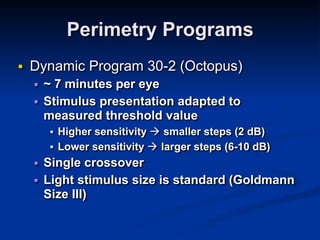
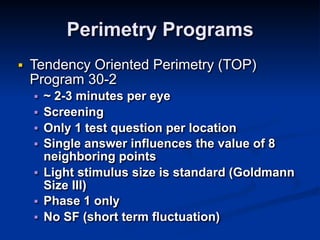
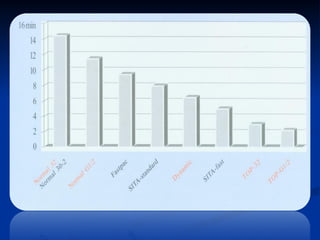
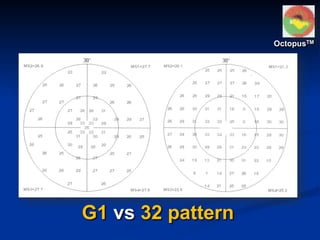
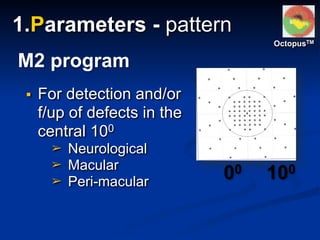
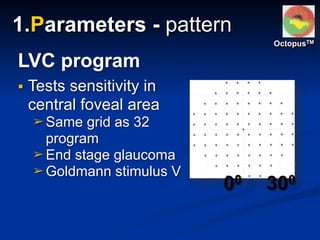
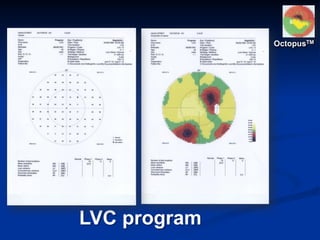
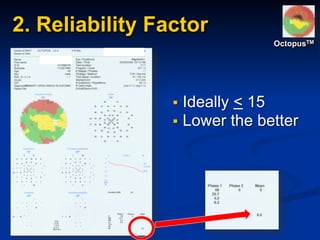
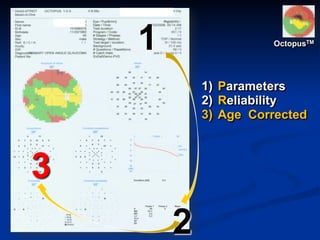
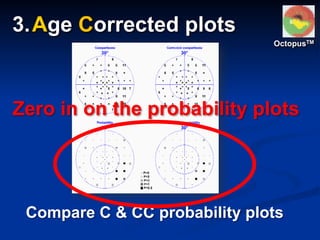
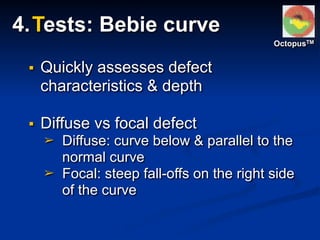
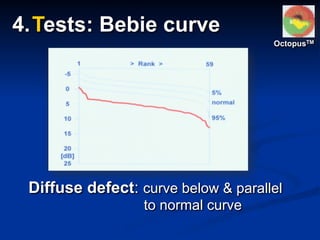
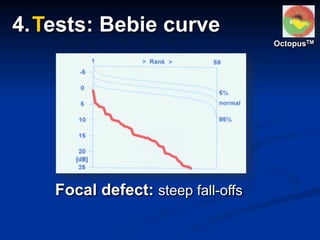
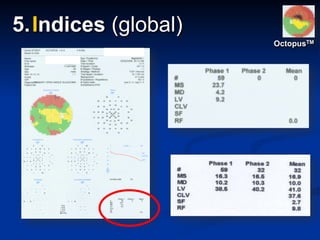
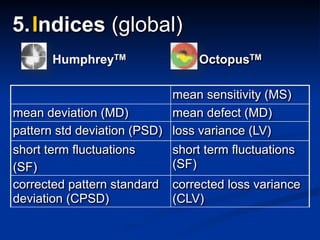
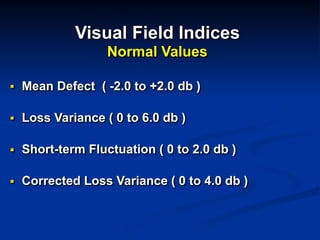
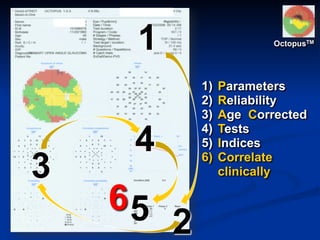
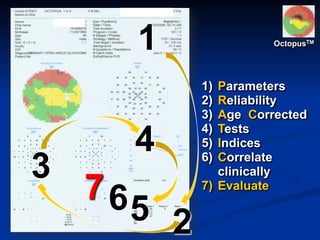
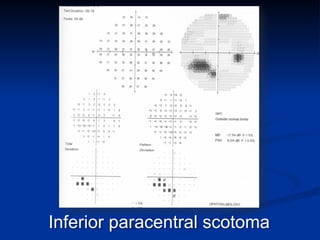
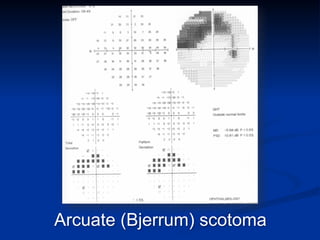
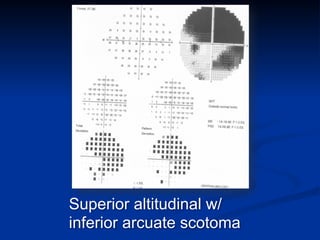
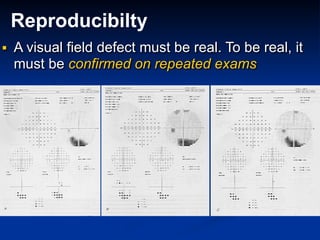
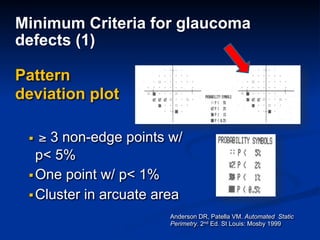
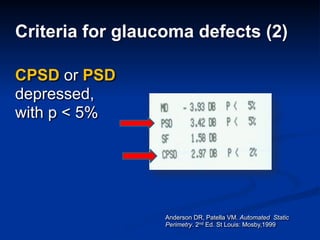
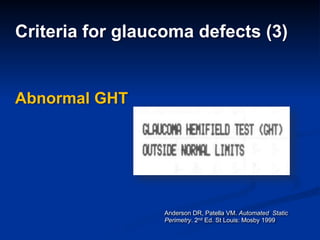
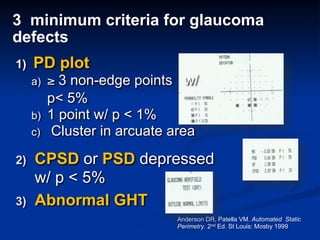
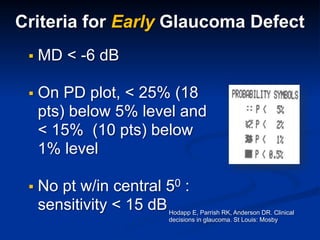
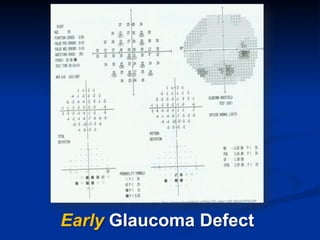
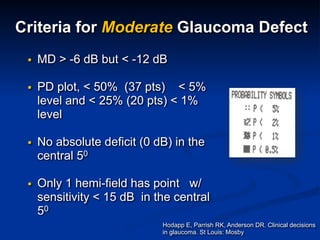
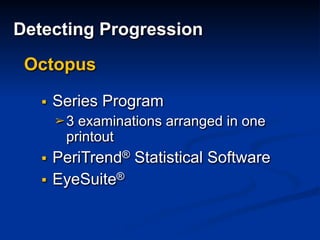
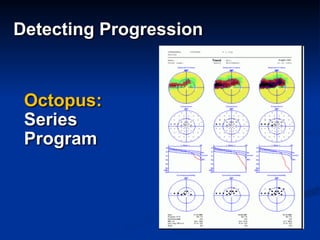
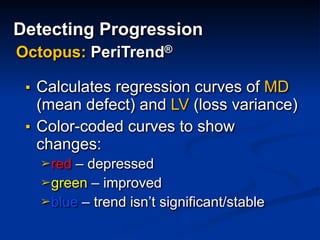
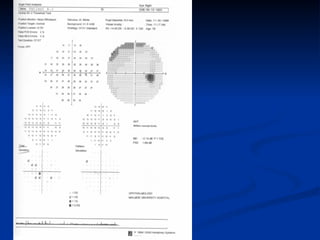
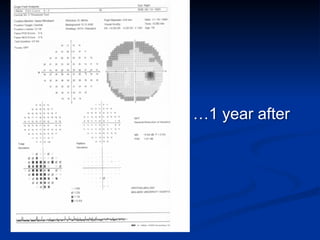
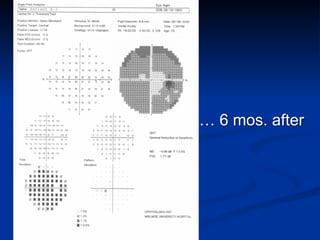
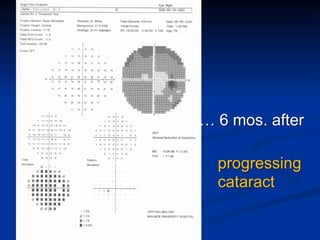
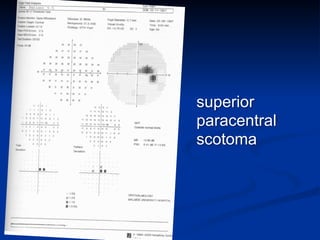
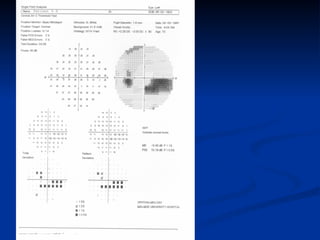
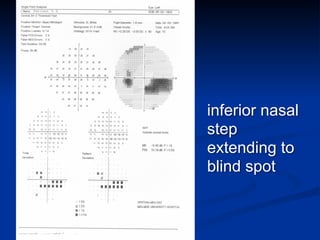
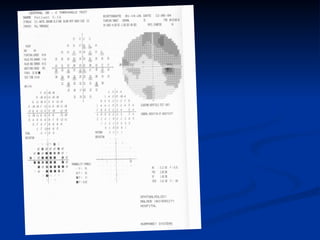
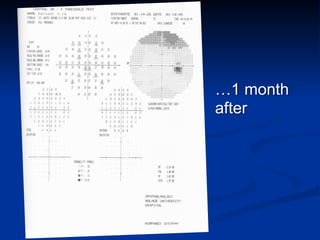
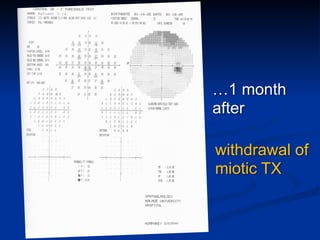
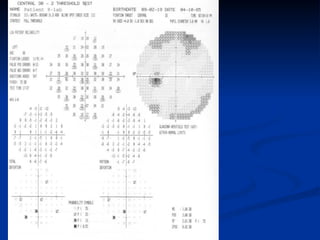
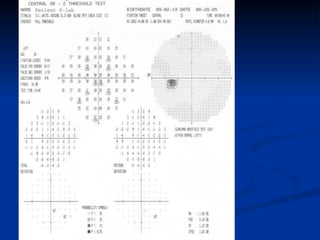
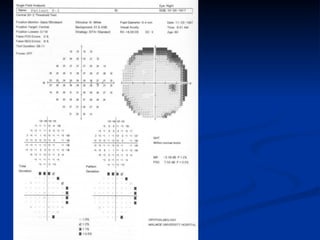
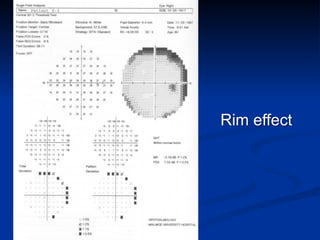
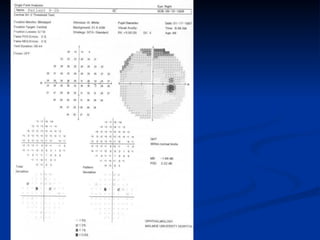
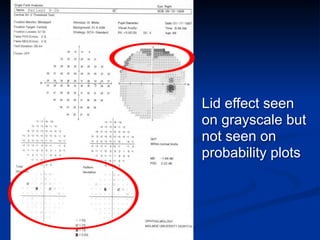
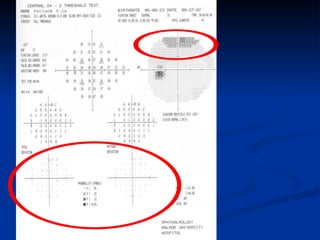
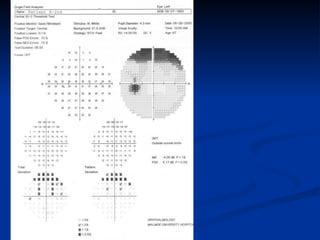
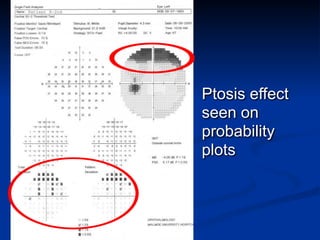
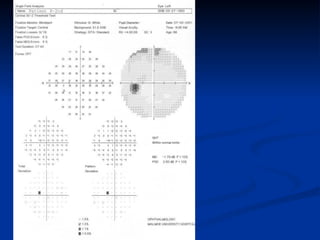
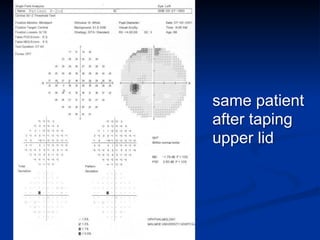
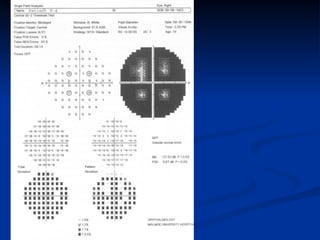
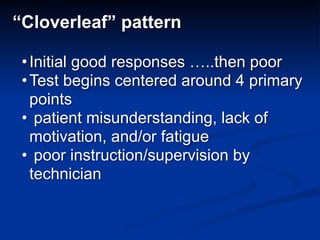
Visual Fields in
Glaucomaโ€จ
Cesar A. Perez Jr MD DPBO
Philippine Glaucoma Societyโ€จ
Definition of Visual Field
โ–  The visual field is that portion of
the external environment of the
observer wherein the steadily
fixating eye can detect visual
stimuli
International Perimetric Society (1978)
Extent of the Visual Field
Anderson RA. Automated Static Perimetry
Temporal fieldNasal field
60ยฐ
90ยฐ
70ยฐ
60ยฐ 30ยฐ
Blind spot
Why only the central โ€จ
30 degrees?
Visual Field vs Anatomy
Anderson RA. Automated Static Perimetry
Traquairโ€™s Island of Vision
Definition of Perimetry
โ–  Measurement of visual functions of the
eye at topographically defined loci in
the visual field1
โ–  Measures differential light sensitivity, or
the ability of a subject to distinguish a
stimulus light from background
illumination2
1. International Perimetric Society (1978)
2. American Academy of Ophthalmology
Clinical Perimetry
โ–  Two major perimetry types
โžข Manual kinetic
โžข Automated static
(gold standard)
Automated Static Threshold
Perimetry
โ–  Measures the retina's sensitivity to
light at predetermined locations in the
visual field
โ–  While the patient focuses on the point
of fixation, stimuli are presented in
random order at each of the
predetermined locations w/in the
visual field
static achromatic stimulus
(Gold Standard)
Clinical Perimetry
Stimulus size
Size V
Size III (standard)
Blind spot
Apostilbs (Asb)
(luminance)
Humphrey
Decibels (dB)
(sensitivity)
Octopus
Decibels (dB)
0.1 50 40
1 40 30
1000 10 0
10,000 0 -
Clinical Perimetry
Clinical Perimetry
โ–ช Stimulus intensity is varied but w/ fixed
size & duration
โžขDetermines the minimum intensity at w/c
patient responds to 50% of the time
(threshold)
โ–ช Determined by bracketing - stimulus
intensities moved above & below the
threshold
Threshold strategy
Clinical Perimetry
โ€œBracketingโ€ reveals the threshold
Infrathreshold (canโ€™t be seen)
Suprathreshold (seen)
Why test the Visual Field?
โ–  Defines state of optic nerve function
โ–  Defines visual impairment1
โ–  To detect eye diseases (glaucoma,
retinal, neuro-ophtha, etc)
โ–  To monitor an eye disease/visual
impairment
1. Asia Pacific Glaucoma Guidelines (2003-2004)
What is being tested in Perimetry?
โ–  Light sensitivity is measured in
different retinal areas
โžขFoveal/central areas more sensitive than
peripheral areas
โ–  Light sensitivity compared to a
normative database derived from
multicenter studies
Interconnecting cells
โ–ช Bipolar
โ–ช Horizontal
โ–ช Amacrine cells
Visual Physiology of the Retina
Light
photoreceptors
RPE
Transmitting cells
โ–ช Ganglion cells
G G
Humphrey & Octopus
practical
reading
system
Parameters
Reliability
Age Corrected plots
Tests (GHT/Bebie curve)
Indices
Correlate clinically
Evaluate
7 Steps โ€“ 5 zones
(PRACTICE) HumphreyTM OctopusTM
1) P
2) R
3) AC
4) T
5) I
6) C
7) E
3
4 5
12 HumphreyTM
โ€ข 5 Zones
โ€ข Counter-clockwise
1) Parameters
2) Reliability
3) Age Corrected
4) Tests
5) Indices
6) Correlate
clinically
7) Evaluate
1
2
3
4
5
OctopusTM
โ€ข 5 Zones
โ€ข Clockwise
1) Parameters
2) Reliability
3) Age Corrected
4) Tests
5) Indices
6) Correlate
clinically
7) Evaluate
โ–ช Test strategy
โžข Full threshold, SITA-standard, SITA fast
โ–ช Region/pattern used
โžข 30-2, 24-2, 10-2
โ–ช Patient details
โžขdate of birth, date of VF, pupil size, test
time, VA, correction, eye tested
1.Parameters
HumphreyTM
Perimetry Programs
โ–  Full Threshold 30-2
โ–  Standard
โ–  18-20 minutes per eye
โ–  4-2-1 staircase with double crossover for
Octopus; 4-2 staircase for Humphrey
โ–  Light stimulus size is standard (Goldmann
Size III)
Full
threshold
HumphreyTM
SITA Standard
โ–ช Diagnostic sensitivity similar to full
threshold (both 95%)1
โ–ช Sensitivity, specificity, characterization, &
reliability of determining VF properties > vs
other threshold tests2-4
โ–ช 50% reduction in testing times
โžข 4 minutes for a normal field
โžข 8 minutes for a glaucoma field
1. Delgado, et al, Ophthalmology Dec 2002
2. Bengtsson B, et al. Acta Ophthalmol Scand. 1998
3. Bengtsson, B, Heijl. A. Acta Ophthalmol Scand. 1998
4. Budenz DL, et al. Ophthalmology. 2002โ€จ
HumphreyTM
SITA -
Standard
โ–  2-6 minutes
โžข 3 minutes normal field
โžข 5.5 minutes glaucoma field
โ–  93% sensitivity vs 95% for SITA
standard1
For patients : Younger
โžข Restless
โžข โ€œLearningโ€
1. Delgado, et al, Ophthalmology Dec 2002
SITA Fast
โ€ข 24-2 tests 54 points
โ€ข 30-2 tests 76 points
24-2 or 30-2?
HumphreyTM
10-2?
โ€ข For advanced
glaucoma
โ€ข Tests 68 points
in the central
10 degrees
HumphreyTM
advanced
glaucoma
30-2
HumphreyTM
1
2
HumphreyTM
1) Parameters
2) Reliability
Is the field reliable?
โ–ช false (+): pressing button even w/o
visual stimulus
โ–ช false (-): failure to respond to a
threshold stimulus previously seen at
the same point
โ–ช if > 33% FP or FN, then unreliable
โ–ช if > 20% fixation losses then unreliable
3
12 HumphreyTM
1) Parameters
2) Reliability
3) Age Corrected
Compare total & pattern deviation
3.Age Corrected plots
HumphreyTM
Zero in on the probability plots
Compare total deviation (TD) & pattern
deviation (PD) probability plots
HumphreyTM
โ–ช If defect in TD & PD plots look similar
โžข Focal field defect
โ–ช Depressed TD w/ a normal PD
โžข Diffuse or generalized field defect
Focal defect
Compare total &
pattern deviation HumphreyTM
HumphreyTM
Generalized defect
Compare total &
pattern deviation
3
4
12 HumphreyTM
1) Parameters
2) Reliability
3) Age Corrected
4) Tests
โ–  Outside normal limits
โžขif sensitivities in > 1 of the
5 zones in upper half of
the field are different
(p<0.01) from those in the
corresponding lower half
zones
4.Tests: glaucoma
hemifield test (GHT) HumphreyTM
3
4 5
12 HumphreyTM
1) Parameters
2) Reliability
3) Age Corrected
4) Tests
5) Indices
5.Indices (global)
โ–ช MD: mean deviation
โ–ช PSD: pattern standard deviation
โ–ช SF: short-term fluctuation
โ–ช CPSD: corrected PSD
HumphreyTM
Mean deviation (MD)
โ–ช Average difference between
overall sensitivity of patient and
age-matched controls
โ–ช Indication of generalized defects
or elevation (+ or - 2 dB normal)
โ–ช Good measure of diffuse defects
5.Indices (global)
HumphreyTM
Mean deviation (MD)
40
0
30
20
10
90 60 30 0 30 60 90
Normal hill of vision
(age corrected)
dB
Pattern standard deviation (PSD)
shape of VF departs from normal age-
corrected field
โ–ช Focal / localized defects
โ–ช Single most useful analysis
โ–ช Beginning VF loss appear earlier in
probability plots vs grayscale
โ–ช Normal value : 0 to 6 dB
โ€จ
Short term fluctuations (SF)
โ–ช 0-2dB normal
โ–ช Average between 2 determinations
should be:
โžข < 2dB in normal field
โžข < 3dB in early damage
โžข < 4dB in moderate damageโ€จ
โ€ข Increased fluctuation
โ–ช Pattern Standard Deviation
(PSD) corrected for the SF
โ–ช Better measure of localized
field loss (0-4 dB normal)
Corrected Pattern
Standard deviation (CPSD)
HumphreyTM
5.Indices (global)
3
4 5
12 HumphreyTM
1) Parameters
2) Reliability
3) Age Corrected
4) Tests
5) Indices
6) Correlate
clinically
6
3
4 5
12 HumphreyTM
1) Parameters
2) Reliability
3) Age Corrected
4) Tests
5) Indices
6) Correlate
clinically
7) Evaluate6
7
1
1) Parameters
OctopusTM
โ–ช Test strategy
โžข Normal, Dynamic, TOP
โ–ช Pattern/region used
โžข G1, 32, M2, LVC
โ–ช Patient details
โžข Date of birth, date of VF, pupil size, test
time, VA, correction, eye tested
OctopusTM
1.Parameters
โ–ช Points positioned in
areas of concern in
glaucoma
โžขAccentuates nasal
step
โžขHigher resolution in
paracentral area
G1 program
OS
OctopusTM
1.Parameters - pattern
โ€œFull
Thresholdโ€
Normal
Strategy
OctopusTM
OctopusTM
โžขexcellent
correlation
w/ normal
strategy
โ–ช Dynamic
โ–ช TOP
Shorter
strategies:
Perimetry Programs
โ–  Dynamic Program 30-2 (Octopus)
โ–  ~ 7 minutes per eye
โ–  Stimulus presentation adapted to
measured threshold value
โ–  Higher sensitivity ! smaller steps (2 dB)
โ–  Lower sensitivity ! larger steps (6-10 dB)
โ–  Single crossover
โ–  Light stimulus size is standard (Goldmann
Size III)
Perimetry Programs
โ–  Tendency Oriented Perimetry (TOP)
Program 30-2
โ–  ~ 2-3 minutes per eye
โ–  Screening
โ–  Only 1 test question per location
โ–  Single answer influences the value of 8
neighboring points
โ–  Light stimulus size is standard (Goldmann
Size III)
โ–  Phase 1 only
โ–  No SF (short term fluctuation)
G1 vs 32 pattern
OctopusTM
โ–ช For detection and/or
f/up of defects in the
central 100
โžข Neurological
โžข Macular
โžข Peri-macular
M2 program
00 100
OctopusTM
1.Parameters - pattern
M2 program
(central 100)
OctopusTM
โ–ช Tests sensitivity in
central foveal area
โžข Same grid as 32
program
โžข End stage glaucoma
โžข Goldmann stimulus V
LVC program
00 300
1.Parameters - pattern
OctopusTM
LVC program
OctopusTM
2. Reliability Factor
โ–ช Ideally < 15
โ–ช Lower the better
OctopusTM
1
2
3
OctopusTM
1) Parameters
2) Reliability
3) Age Corrected
Zero in on the probability plots
OctopusTM
Compare C & CC probability plots
3.Age Corrected plots
OctopusTM
4.Tests: Bebie curve
โ–ช Quickly assesses defect
characteristics & depth
โ–ช Diffuse vs focal defect
โžข Diffuse: curve below & parallel to the
normal curve
โžข Focal: steep fall-offs on the right side
of the curve
OctopusTM
4.Tests: Bebie curve
Diffuse defect: curve below & parallel
to normal curve
OctopusTM
4.Tests: Bebie curve
Focal defect: steep fall-offs
4.Tests: Bebie curve
OctopusTM
OctopusTM
5.Indices (global)
mean sensitivity (MS)
mean deviation (MD) mean defect (MD)
pattern std deviation (PSD) loss variance (LV)
short term fluctuations
(SF)
short term fluctuations
(SF)
corrected pattern standard
deviation (CPSD)
corrected loss variance
(CLV)
OctopusTMHumphreyTM
5.Indices (global)
Visual Field Indicesโ€จ
Normal Values
โ–  Mean Defect ( -2.0 to +2.0 db )
โ–  Loss Variance ( 0 to 6.0 db )
โ–  Short-term Fluctuation ( 0 to 2.0 db )
โ–  Corrected Loss Variance ( 0 to 4.0 db )
1
2
3
4
56
OctopusTM
1) Parameters
2) Reliability
3) Age Corrected
4) Tests
5) Indices
6) Correlate
clinically
1
2
3
4
567
OctopusTM
1) Parameters
2) Reliability
3) Age Corrected
4) Tests
5) Indices
6) Correlate
clinically
7) Evaluate
Is the field defect
glaucomatous?
โ€ข Is the defect focal?
โ€ข Is the defect diffuse?
STEP 1
Glaucoma defects are
Focal in nature
Diffuse Focal
What kind of a defect is this?โ€จ
diffuse or focal?
combined diffuse & focal defect
If the defect is Focal
STEP 2:
Is the focal defect glaucomatous?
Glaucomatous Visual Field Defects
(Seagig Glaucoma Guidelines โ€˜08)
โ–ช Asymmetrical across horizontal meridian*
โ–ช Are located in mid-periphery* (5โ€“250
from fixation)
โ–ช Reproducible
โ–ช Not attributable to other pathology
โ–ช Clustered in neighboring test pts (localised)
โ–ช Correlate with optic disc and RNFL
* Applicable to early/moderate cases
Localized patterns of glaucoma
VF defects
โ–ช Nasal step (earliest)
โ–ช Paracentral scotoma
โ–ช Arcuate (Bjerrum) scotoma
โžข Later becoming altitudinal
โ–ชTemporal island
โ–ช Central island
Superior nasal step
Inferior paracentral scotoma
Arcuate (Bjerrum) scotoma
Superior altitudinal w/
inferior arcuate scotoma
Reproducibilty
โ–  A visual field defect must be real. To be real, it
must be confirmed on repeated exams
1. Anderson DR, Patella VM. Automated Static
Perimetry. 2nd Ed. St Louis: Mosby 1999
2. Hodapp E, Parrish RK, Anderson DR. Clinical
decisions in glaucoma. St Louis: Mosby
โ–ช What is the minimum criteria for a defect to be possibly glaucoma?
1โ€จ
โ€จ
โ–ช When do you classify a glaucoma
defects as:2
โžข Early?
โžข Moderate?
โžข Severe?
Identification & Classification of
a glaucoma defect
Minimum Criteria for glaucoma
defects (1)
โ–ช โ‰ฅ 3 non-edge points w/
p< 5%
โ–ชOne point w/ p< 1%
โ–ชCluster in arcuate area
Anderson DR, Patella VM. Automated Static
Perimetry. 2nd Ed. St Louis: Mosby 1999
Pattern
deviation plot
Criteria for glaucoma defects (2)
CPSD or PSD
depressed, โ€จ
with p < 5%
Anderson DR, Patella VM. Automated Static
Perimetry. 2nd Ed. St Louis: Mosby,1999
Criteria for glaucoma defects (3)
Abnormal GHT
Anderson DR, Patella VM. Automated Static
Perimetry. 2nd Ed. St Louis: Mosby 1999
3 minimum criteria for glaucoma
defects
2) CPSD or PSD depressed
w/ p < 5%
3) Abnormal GHT
Anderson DR, Patella VM. Automated Static
Perimetry. 2nd Ed. St Louis: Mosby 1999
1) PD plot
a) โ‰ฅ 3 non-edge points w/
p< 5%
b) 1 point w/ p < 1%
c) Cluster in arcuate area
Hodapp E, Parrish RK, Anderson DR. Clinical
decisions in glaucoma. St Louis: Mosby
Criteria for Early Glaucoma Defect
โ–ช MD < -6 dB
โ–ช On PD plot, < 25% (18
pts) below 5% level and
< 15% (10 pts) below
1% level
โ–ช No pt w/in central 50 :
sensitivity < 15 dB
Early Glaucoma Defect
โ–ช MD > -6 dB but < -12 dB
โ–ช PD plot, < 50% (37 pts) < 5%
level and < 25% (20 pts) < 1%
level
โ–ช No absolute deficit (0 dB) in the
central 50
โ–ช Only 1 hemi-field has point w/
sensitivity < 15 dB in the central
50
Hodapp E, Parrish RK, Anderson DR. Clinical decisions
in glaucoma. St Louis: Mosby
Criteria for Moderate Glaucoma Defect
Moderate Glaucoma Defect
โ–ช MD > -12 dB
โ–ช On PD plot
โžข > 50% of pts < 5% level
โžข > 25% of pts < 1% level
โ–ช Absolute deficit (0 dB) in the central 50
โ–ช Both hemi-fields w/ pt(s) w/ sensitivity <
15 dB w/in th central 50
Hodapp E, Parrish RK, Anderson DR. Clinical
decisions in glaucoma. St Louis: Mosby
Criteria for Severe Glaucoma Defect
Severe Glaucoma Defect
Detecting Progression
โžข Widening or deepening of an
existing scotoma
โžข Development of a new
glaucomatous scotoma
โžข Occasionally generalized field
depression (although usually caused by
media opacity or miosis)
Asia Pacific Glaucoma Guidelines (2003-2004)
โ–  Requires a series of at least 3 or 4 fields
โ–  Basing judgements on only 1 progressed
field is very risky unless the changes
encountered are
โžข Very large and/or
โžข Confirmed by other clinical findings, such as
changes in optic disc configuration
Detecting Progression
Octopus
โ–ช Series Program
โžข3 examinations arranged in one
printout
โ–ช PeriTrendยฎ Statistical Software
โ–ช EyeSuiteยฎ
Detecting Progression
Octopus:
Series
Program
Detecting Progression
โ–ช Calculates regression curves of MD
(mean defect) and LV (loss variance)
โ–ช Color-coded curves to show
changes:
โžขred โ€“ depressed
โžขgreen โ€“ improved
โžขblue โ€“ trend isnโ€™t significant/stable
Octopus: PeriTrendยฎ
Detecting Progression
Octopus:
PeriTrendยฎ
Detecting Progression
Humphrey
โ–  Overview print-out
โ–  Glaucoma Progression Analysisยฎ
(GPAยฎ) software
Detecting Progression
Humphrey:
Overview
print-out
Detecting
Progression
Humphrey:
GPAยฎ software
Detecting
Progression
Structure-Function Correlation
โ–  Combined w/ other examinations
โ–  No isolated interpretations
โ–  Disc features must match visual field
defects (clinical picture takes
precedence)
New Perimetry Technologies
โ–  Short Wavelength Automated
Perimetry (SWAP)
โžขBlue light stimulus on yellow
background (โ€œblue on yellowโ€)
โžขDetects VF loss 3-5 yrs before white on
white perimetry1
โžขUtilizes the โ€œKโ€ ganglion cells
1. Racette L et al. Ophthalmol Clin North Am. 2003: 16: 227-236
Goldmann size V
440 nm, 1.80
> 500 nm yellow background
โ€ข Except for these differences, SWAP is still a basic
threshold perimetry test, in w/c std Goldmann stimuli
are presented in the conventional way
New Perimetry Technologies
โ–  Frequency Doubling Technology
(FDT) perimeter
โžขMotion/flicker perimetry
โžขFDT can detect VF loss 4 yrs before
SAP1
โžขUtilizes the โ€œMโ€ ganglion cells/
Magnocellular pathway
1. Johnson CA et al. J Vision. 2002; 2:100a
โ–ช Functional testing essential: SAP
โ–ช Know retinal anatomy & its relation to
visual function
โ–ช Know programs/parameters
โžข Stick to a single one for ff-up
โ–ช Glaucoma defects are focal
โ–ช Progression is a hallmark of
Glaucoma
โ–ช CLINICAL CORRELATION
Summary
Although sometimes it is not
as easy as it seems
Thank You!
Perimetry Exercises
โ€ฆ1 year after
โ€ฆ1 year after
Early defects
may show up in
probability plots
and not in the
grayscale
โ€ฆ1 year after
โ€ฆ 6 mos. after
โ€ฆ 6 mos. after
progressing
cataract
โ€ข elevated false โ€œ+โ€ score
โ€ข GHF โ€“ โ€œabnormally high sensitivityโ€
โ€ข โ€œwhite scotomaโ€ on grayscale
โ€ข larger defects on the pattern
deviation plots than in the total
deviation probability plots
โ€ข highly positive mean deviation (MD)
โ€œTrigger happyโ€ field
both a focal
and a diffuse
defect
โ€ฆ.a year after
post cataract
surgery
double
arcuate
scotomas
superior
paracentral
scotoma
inferior nasal
step
extending to
blind spot
โ€ฆ1 month
after
โ€ฆ1 month
after
withdrawal of
miotic TX
Are the VF defects artifacts?
โ–ช โ€œLearning effectโ€ ?
โ–ช Rim effect ?
โ–ช Ptosis, prominent brows ?
โ–ช Lack of instructions or supervision ?
โ–ช Anxiety/fatigue/drowsiness ?
โ–ช Malingering ?
Learning effect
โ–ช Depressed sensitivity in mid-periphery
20-300
โ–ช Less common in shorter algorithms
โ–ช 10-20% of normal patients donโ€™t
produce normal VFโ€™s on their first test
Rim effect
Lid effect seen
on grayscale but
not seen on
probability plots
Ptosis effect
seen on
probability
plots
same patient
after taping
upper lid
โ€œCloverleafโ€ pattern
โ€ขInitial good responses โ€ฆ..then poor
โ€ขTest begins centered around 4 primary
points
โ€ข patient misunderstanding, lack of
motivation, and/or fatigue
โ€ข poor instruction/supervision by
technician
โ€ข The first visual field IS NOT THE BASELINE.
โ€ข โ€œLEARNING CURVEโ€

Visual Field in Glaucoma