
Recommended
More Related Content
What's hot
What's hot (20)
Viewers also liked
Viewers also liked (17)
Similar to Aaj ka trend 12.08.16
Similar to Aaj ka trend 12.08.16 (20)
Recently uploaded
Recently uploaded (20)
Aaj ka trend 12.08.16
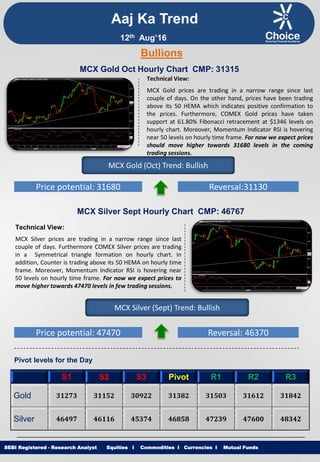
- 1. Equities I Commodities I Currencies I Mutual Funds Aaj Ka Trend Technical View: MCX Gold prices are trading in a narrow range since last couple of days. On the other hand, prices have been trading above its 50 HEMA which indicates positive confirmation to the prices. Furthermore, COMEX Gold prices have taken support at 61.80% Fibonacci retracement at $1346 levels on hourly chart. Moreover, Momentum Indicator RSI is hovering near 50 levels on hourly time frame. For now we expect prices should move higher towards 31680 levels in the coming trading sessions. SEBI Registered - Research Analyst Equities I Commodities I Currencies I Mutual Funds Bullions MCX Gold Oct Hourly Chart CMP: 31315 MCX Gold (Oct) Trend: Bullish Price potential: 31680 Reversal:31130 MCX Silver Sept Hourly Chart CMP: 46767 Technical View: MCX Silver prices are trading in a narrow range since last couple of days. Furthermore COMEX Silver prices are trading in a Symmetrical triangle formation on hourly chart. In addition, Counter is trading above its 50 HEMA on hourly time frame. Moreover, Momentum Indicator RSI is hovering near 50 levels on hourly time frame. For now we expect prices to move higher towards 47470 levels in few trading sessions. MCX Silver (Sept) Trend: Bullish Price potential: 47470 Reversal: 46370 Pivot levels for the Day S1 S2 S3 Pivot R1 R2 R3 Gold 31273 31152 30922 31382 31503 31612 31842 Silver 46497 46116 45374 46858 47239 47600 48342 12th Aug’16
- 2. Equities I Commodities I Currencies I Mutual Funds Technical View: MCX Copper prices witnessed breakout of its pennant pattern at 322.70 levels on hourly chart. Furthermore, counter is trading above its 50 HEMA on hourly time frame. Moreover, COMEX Copper has observed breakout of its Triangle pattern at $2.18 levels on hourly chart. On the other hand, momentum indicator RSI is trading above 60 levels on hourly chart. For now we expect prices to move higher towards 330 levels in coming trading sessions. SEBI Registered - Research Analyst Equities I Commodities I Currencies I Mutual Funds MCX Copper Aug hourly Chart CMP: 323.40 MCX Copper (Aug) Trend: Bullish Price potential: 330 Reversal: 318 MCX Crude Oil Aug. Hourly Chart CMP: 2912 Technical View: MCX Crude Oil achieved our short term target of 2890 as expected. MCX Crude Oil prices are trading in a Rising channel formation on hourly basis. On the other hand prices have been trading above its 50 HEMA on hourly chart. Looking at NYMEX WTI Crude Oil prices are trading in a Higher high higher low formation on hourly time frame It shows that there is positive trend to unfold. Moreover, Momentum indicator RSI is trading above 60 levels on hourly chart. For now we expect prices to move higher towards 2990 levels in coming trading sessions. MCX Crude Oil (Aug) Trend: Bullish Price potential: 2990 Reversal: 2860 Pivot levels for the Day S1 S2 S3 Pivot R1 R2 R3 Copper 321.6 320.1 317.4 322.8 324.3 325.5 328.2 Crude 2795 2703 2560 2846 2938 2989 3132 Base Metal Energy Aaj Ka Trend 12th Aug’16
- 3. Equities I Commodities I Currencies I Mutual FundsSEBI Registered - Research Analyst Equities I Commodities I Currencies I Mutual Funds Other Base Metals & Energy S1 S2 S3 Pivot R1 R2 R3 Trend Copper 321.6 320.1 317.4 322.8 324.3 325.5 328.2 Aluminum 109.8 109.4 108.8 110.1 110.5 110.7 111.4 Lead 121.5 120.8 119.6 122.1 122.8 123.3 124.6 Nickel 714.4 712.0 705.4 718.6 721.0 725.2 731.8 Zinc 151.0 150.2 148.2 152.1 152.9 154.1 156.0 Natural Gas 170.5 167.4 162.5 172.3 175.4 177.2 182.1 Fundamental News: Gold eased slightly in Asia on Thursday as investors booked gains and kept an eye on dollar weakness. Gold prices edged lower in European trade on Thursday, as investors evaluated the likelihood that the Federal Reserve will raise interest rates this year, with no major new economic indicators due until Friday's highly anticipated retail sales report. Gold prices were little changed in North American trade on Thursday, as weekly U.S. jobless claims data offered few clues on whether the Federal Reserve will raise interest rates in the coming months. The International Energy Agency (IEA) warned on Thursday that global demand for oil was expected to fall from this year to next due to a weaker macroeconomic context, pushing crude down to intraday lows. Oil struggled for gains on Thursday as a build in U.S. crude inventories and record Saudi Arabian output weighed on markets. Oil prices turned higher in North American trade on Thursday, recovering after falling sharply on the back of growing concerns over a global supply glut. Oil prices rose over 3 percent on Thursday after comments from the Saudi oil minister about possible action to stabilize prices triggered a round of buying and the International Energy Agency forecast crude markets would tighten in the second half of 2016. U.S. natural gas futures sank to a two-month low in North America trade on Thursday, after data showed that natural gas supplies in storage in the U.S. rose more than forecast last week. The dollar held steady against the other major currencies on Thursday, despite the release of a positive U.S. jobless claims report, as investors turned their attention to Friday’s U.S. data on retail sales and consumer sentiment. Aaj Ka Trend 12th Aug’16
- 4. Equities I Commodities I Currencies I Mutual FundsSEBI Registered - Research Analyst Equities I Commodities I Currencies I Mutual Funds International Market Commodity Closing Price Gold 1345.80 Silver 20.01 Crude Oil 43.75 Brent Crude Oil 46.20 Natural Gas 2.18 COMEX/NYMEX/ICE ( Precious Metals & Energy) Currency & Commodity Index Currency (Spot) Current Price USD / INR 66.79 Dollar Index 95.88 EUR / USD 1.11 CRB Index* 181.99 Closing as on 11.08.16 *Closing as on 11.08.16 LME (Base Metals) ( $ per tones) Commodity Closing Price Copper 4818 Aluminum 1634 Zinc 2274 Lead 1819 Nickel 10600 SHFE (Base Metals) (Yuan per tones) Commodity Closing Price Copper 37450 Aluminum 12320 Zinc 17320 Lead 13820 Closing as on 11.08.16 Closing as on 11.08.16 LME INVENTORY DATA Aaj Ka Trend 05-Aug-16 08-Aug-16 09-Aug-16 10-Aug-16 11-Aug-16 Aluminium -6425 -5725 -2925 -7900 -8075 Copper -2650 -1625 -325 -525 -900 Lead 0 -50 -75 -75 -425 Nickel -2256 -264 -1926 -762 -900 Zinc -375 -275 -150 29800 -625 12th Aug’16
- 5. Equities I Commodities I Currencies I Mutual Funds This is solely for information of clients of Choice Broking and does not construe to be an investment advice. It is also not intended as an offer or solicitation for the purchase and sale of any financial instruments. Any action taken by you on the basis of the information contained herein is your responsibility alone and Choice Broking its subsidiaries or its employees or associates will not be liable in any manner for the consequences of such action taken by you. We have exercised due diligence in checking the correctness and authenticity of the information contained in this recommendation, but Choice Broking or any of its subsidiaries or associates or employees shall not be in any way responsible for any loss or damage that may arise to any person from any inadvertent error in the information contained in this recommendation or any action taken on basis of this information. Technical analysis studies market psychology, price patterns and volume levels. It is used to forecast future price and market movements. Technical analysis is complementary to fundamental analysis and news sources. The recommendations issued herewith might be contrary to recommendations issued by Choice Broking in the company research undertaken as the recommendations stated in this report is derived purely from technical analysis. Choice Broking has based this document on information obtained from sources it believes to be reliable but which it has not independently verified; Choice Broking makes no guarantee, representation or warranty and accepts no responsibility or liability as to its accuracy or completeness. The opinions contained within the report are based upon publicly available information at the time of publication and are subject to change without notice. The information and any disclosures provided herein are in summary form and have been prepared for informational purposes. The recommendations and suggested price levels are intended purely for trading purposes. The recommendations are valid for the day of the report however trading trends and volumes might vary substantially on an intraday basis and the recommendations may be subject to change. The information and any disclosures provided herein may be considered confidential. Any use, distribution, modification, copying, forwarding or disclosure by any person is strictly prohibited. The information and any disclosures provided herein do not constitute a solicitation or offer to purchase or sell any security or other financial product or instrument. The current performance may be unaudited. Past performance does not guarantee future returns. There can be no assurance that investments will achieve any targeted rates of return, and there is no guarantee against the loss of your entire investment. POTENTIAL CONFLICT OF INTEREST DISCLOSURE (as on date of report) Disclosure of interest statement – • Analyst interest of the stock /Instrument(s): - No. • Firm interest of the stock / Instrument (s): - No. Disclaimer Contact Us Amit Pathania Research Associate amit.pathania@choiceindia.com Rohan Patil Research Associate rohan.patil@choiceindia.com www.choiceindia.comcustomercare@choiceindia.com SEBI Registered - Research Analyst Equities I Commodities I Currencies I Mutual Funds Aaj Ka Trend 12th Aug’16 Neeraj Yadav Research Advisor neeraj.yadav@choiceindia.com Anish Vyas Senior Research Associate anish.vyas@choiceindia.com Amit Pathania Digitally signed by Amit Pathania DN: cn=Amit Pathania, o=Choice Equity Broking Pvt. ltd, ou=Research Department, email=amit.pathania@choiceindia.com, c=IN Date: 2016.08.12 08:31:52 +05'30'