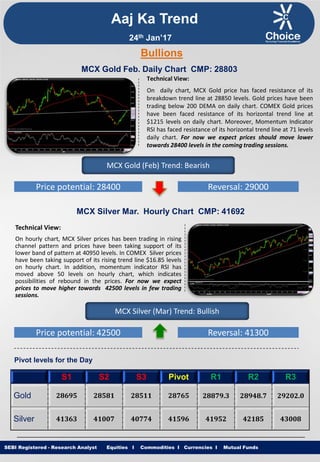
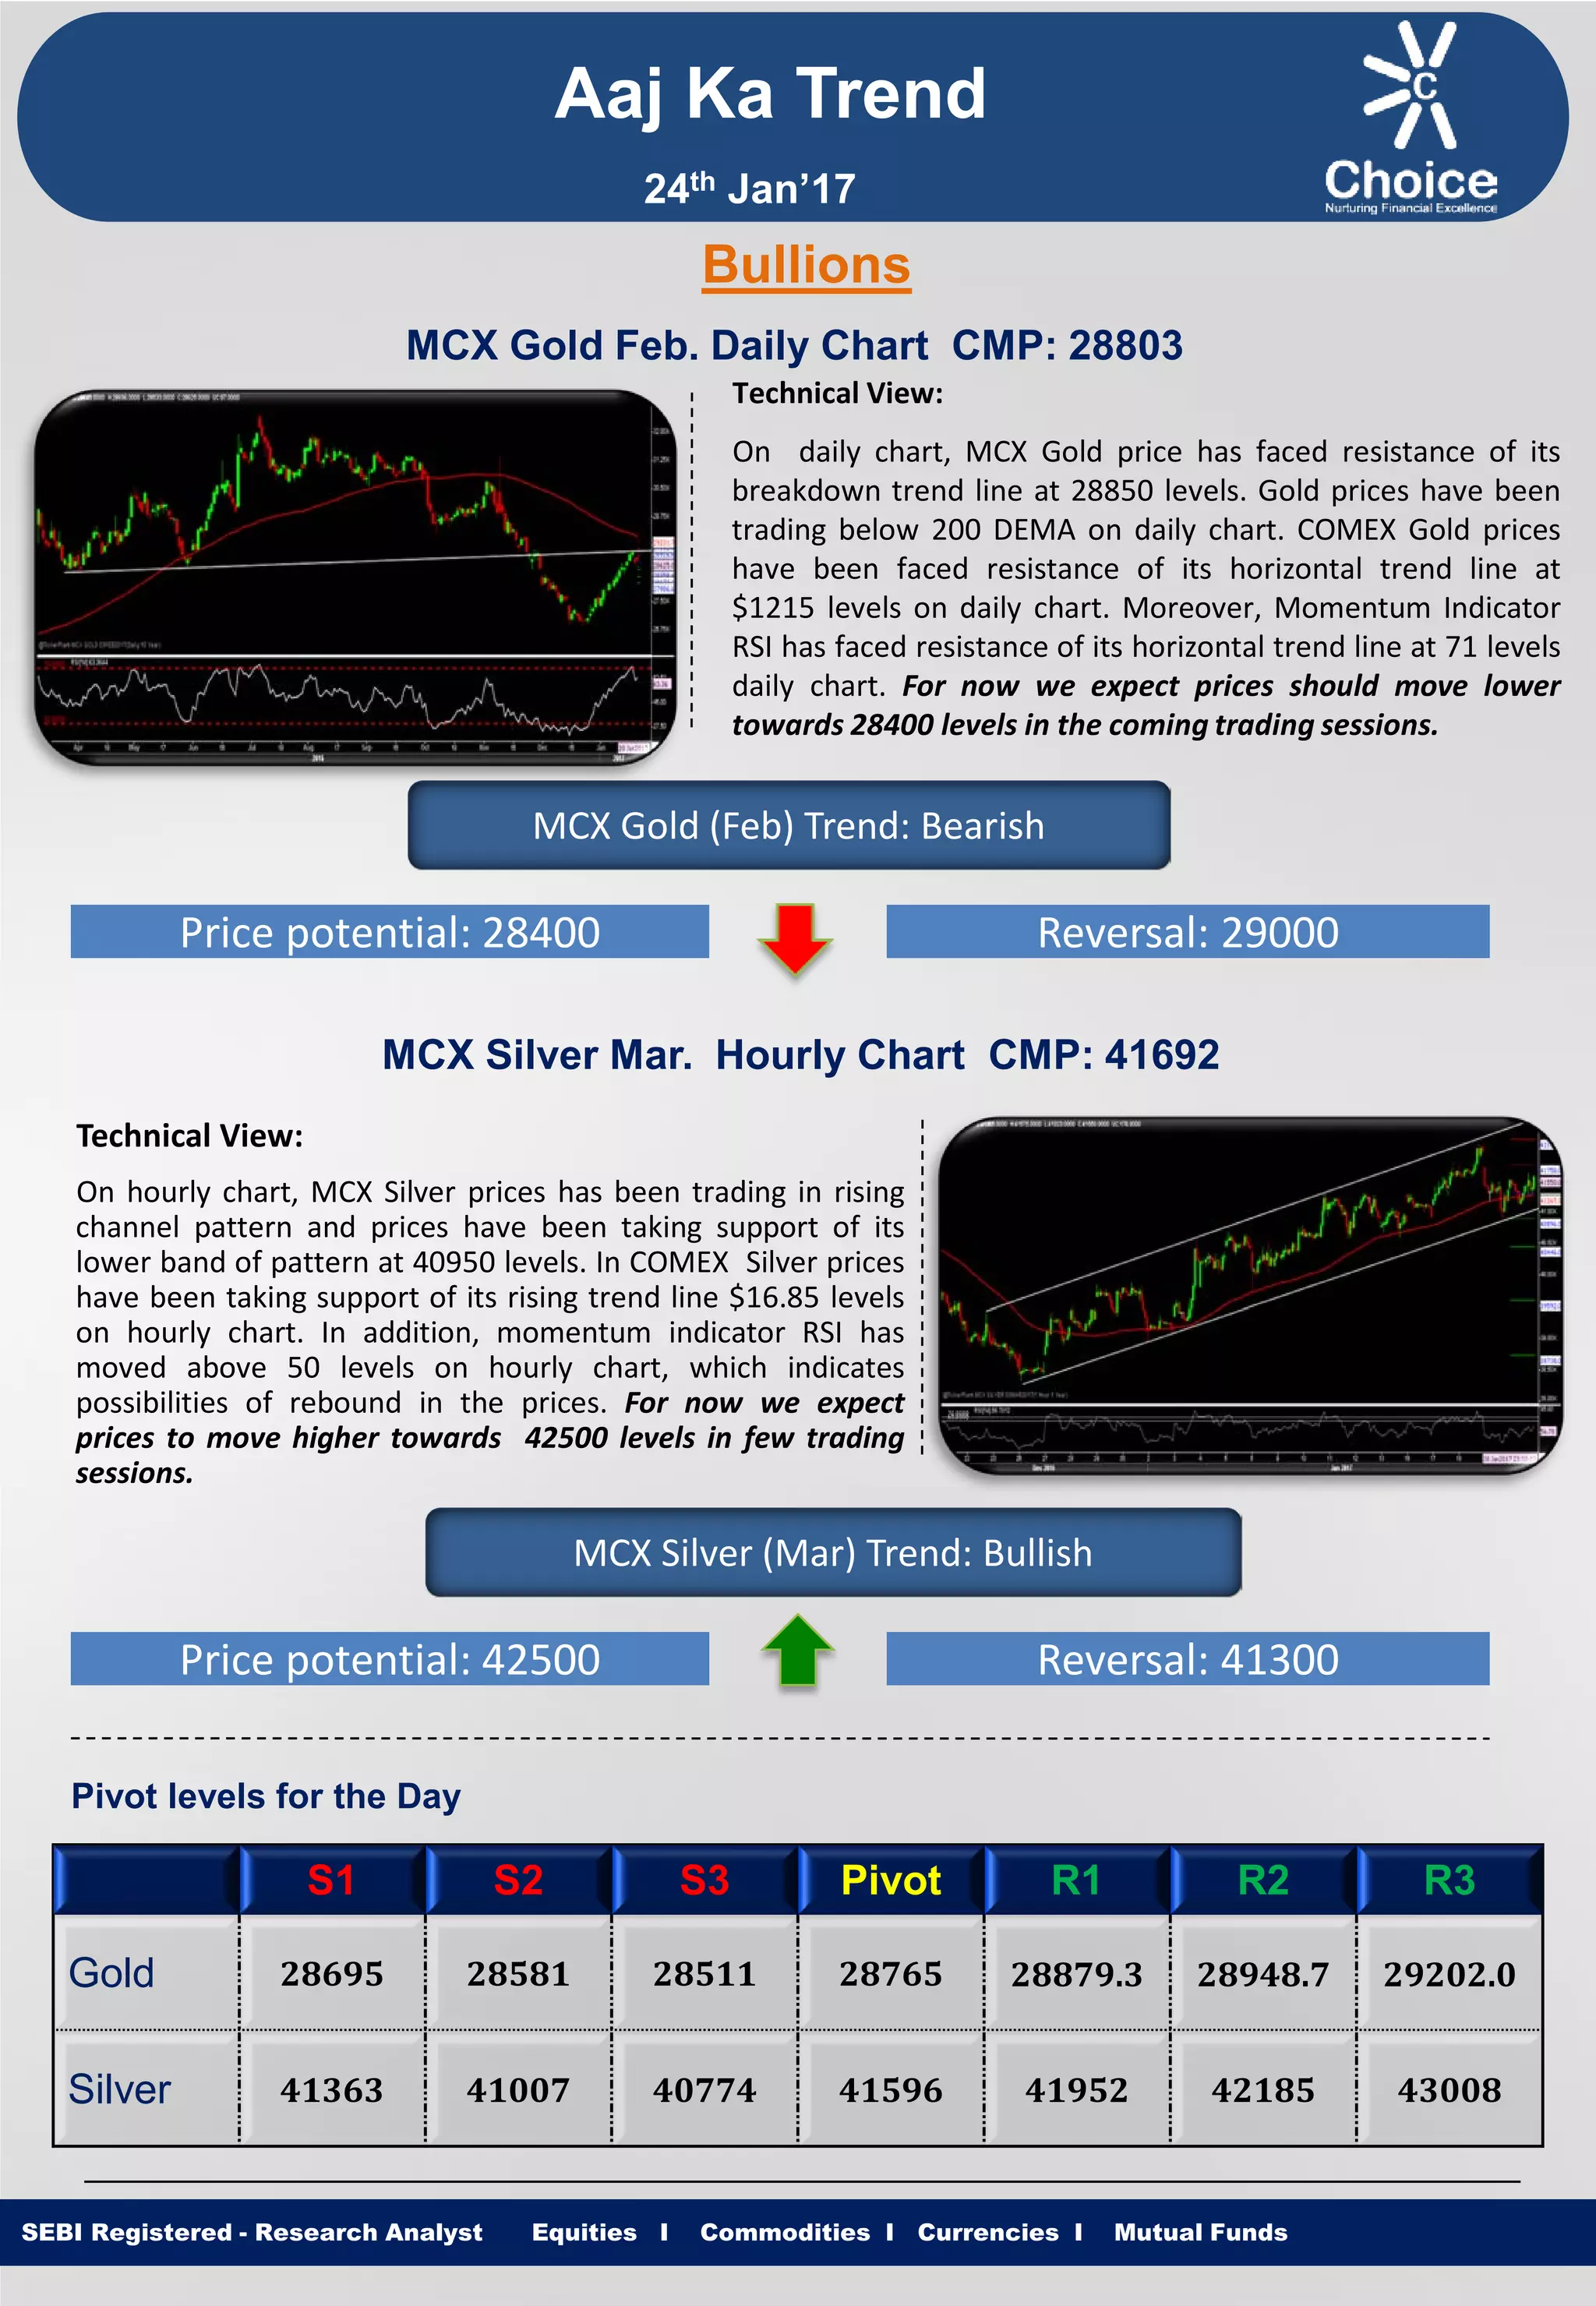
06_Joeri Van Speybroek_Dell_MeetupDora&Cybersecurity.pdf
Aaj ka trend 24.01.17
1. Equities I Commodities I Currencies I Mutual Funds
Aaj Ka Trend
Technical View:
On daily chart, MCX Gold price has faced resistance of its
breakdown trend line at 28850 levels. Gold prices have been
trading below 200 DEMA on daily chart. COMEX Gold prices
have been faced resistance of its horizontal trend line at
$1215 levels on daily chart. Moreover, Momentum Indicator
RSI has faced resistance of its horizontal trend line at 71 levels
daily chart. For now we expect prices should move lower
towards 28400 levels in the coming trading sessions.
SEBI Registered - Research Analyst Equities I Commodities I Currencies I Mutual Funds
Bullions
MCX Gold Feb. Daily Chart CMP: 28803
MCX Gold (Feb) Trend: Bearish
Price potential: 28400 Reversal: 29000
MCX Silver Mar. Hourly Chart CMP: 41692
Technical View:
On hourly chart, MCX Silver prices has been trading in rising
channel pattern and prices have been taking support of its
lower band of pattern at 40950 levels. In COMEX Silver prices
have been taking support of its rising trend line $16.85 levels
on hourly chart. In addition, momentum indicator RSI has
moved above 50 levels on hourly chart, which indicates
possibilities of rebound in the prices. For now we expect
prices to move higher towards 42500 levels in few trading
sessions.
MCX Silver (Mar) Trend: Bullish
Price potential: 42500 Reversal: 41300
Pivot levels for the Day
S1 S2 S3 Pivot R1 R2 R3
Gold 28695 28581 28511 28765 28879.3 28948.7 29202.0
Silver 41363 41007 40774 41596 41952 42185 43008
24th Jan’17
2. Equities I Commodities I Currencies I Mutual Funds
Technical View:
MCX Copper price has shown breakdown of its rising trend
line at 397 levels and prices have been almost retested its
breakdown trend line at 396 levels on hourly chart. On
hourly chart MCX Copper prices have been trading below its
21 HEMA. Furthermore, momentum indicator RSI has been
trading below 100 levels on hourly time frame, which
suggest further downside momentum can be seen in the
prices. For now we expect prices to move lower towards
388 levels in coming trading sessions.
SEBI Registered - Research Analyst Equities I Commodities I Currencies I Mutual Funds
MCX Copper Feb. Hourly Chart CMP: 398.25
MCX Copper (Feb) Trend: Bearish
Price potential: 388 Reversal: 402
MCX Crude Oil Feb. Hourly Chart CMP: 3616
Technical View:
MCX Crude Oil price has shown breakdown of its rising trend
line and prices have been retested its breakdown trend line
at 3641 levels on hurly chart. NYMEX Crude Oil prices has
given breakdown of its rising trend line at $52.10 levels on
hourly chart. MCX Crude Oil has faced resistance of its
horizontal trend line at 3680 levels. Moreover, Momentum
indicator RSI has remained below 60 levels on hourly chart
which suggest negative movement in the prices. For now we
expect prices to move lower towards 3500 levels in coming
trading sessions.
MCX Crude Oil (Feb) Trend: Bearish
Price potential: 3500 Reversal: 3660
Pivot levels for the Day
S1 S2 S3 Pivot R1 R2 R3
Copper 394.7 392.2 389.7 397.2 399.7 402.2 409.8
Crude 3578 3546 3517 3607 3639 3668 3758
Base Metal
Energy
Aaj Ka Trend
24th Jan’17
3. Equities I Commodities I Currencies I Mutual FundsSEBI Registered - Research Analyst Equities I Commodities I Currencies I Mutual Funds
Other Base Metals & Energy
S1 S2 S3 Pivot R1 R2 R3 Trend
Copper 394.7 392.2 389.7 397.2 399.7 402.2 409.8
Aluminum 126.2 125.6 124.8 127.0 127.6 128.4 130.6
Lead 158.0 156.1 154.9 159.2 161.1 162.3 166.7
Nickel 661.0 655.5 648.5 668.0 673.5 680.5 700.0
Zinc 189.1 188.0 187.2 189.9 191.0 191.8 194.5
Natural Gas 215.8 212.5 210.1 218.2 221.5 223.9 231.9
Fundamental News:
Gold prices were sharply higher during North American morning trade on Monday, rising to the strongest level
in about two months as the U.S. dollar sank amid uncertainty around the economic policies of new U.S.
President Donald Trump.
The U.S. dollar index, which measures the greenback’s strength against a trade-weighted basket of six major
currencies, was down around 0.4% at 100.36 in early trade, after falling to 100.17 earlier, a level not seen since
December 8.
The dollar sold off amid disappointment that U.S. President Donald Trump’s inauguration speech on Friday
proved light on detail over his plans for economic stimulus.
Meanwhile, market participants will get back to the business of watching economic data for fresh indications on
the health of the economy in the week ahead, with Friday's advanced reading for U.S. growth in the spotlight.
Besides the GDP report, this week's calendar also features U.S. data on existing home sales on Tuesday, initial
jobless claims and new home sales on Thursday, followed by durable goods orders and revised consumer
sentiment on Friday.
The Federal Reserve indicated last month that at least three rate increases were in the offing for 2017,
according to a forecast of interest rates from members of the central bank, known as the dot-plot.
Oil fell Monday as a jump in the U.S. rig count outweighed an upbeat output cut compliance meeting.
Baker Hughes U.S. rig count data Friday showed a jump of 29 to 551, the highest level in 14 months.
The accord calls for a reduction of some 1.8 million barrels a day in the first half of this year. Saudi Energy
Minister Khalid al-Falih estimated the level of compliance at already 80%.
Aaj Ka Trend
24th Jan’17
4. Equities I Commodities I Currencies I Mutual FundsSEBI Registered - Research Analyst Equities I Commodities I Currencies I Mutual Funds
International Market
Commodity Closing Price
Gold 1217.17
Silver 17.18
Crude Oil 53.01
Brent Crude Oil 55.50
Natural Gas 3.272
COMEX/NYMEX/ICE ( Precious Metals & Energy) Currency & Commodity Index
Currency (Spot) Current Price
USD / INR 68.2150
Dollar Index 100.01
EUR / USD 1.0757
CRB Index* 194.44
Closing as on 23.01.17 *Closing as on 23.01.17
LME (Base Metals) ( $ per tones)
Commodity Closing Price
Copper 5795
Aluminum 1849
Zinc 2790
Lead 2357
Nickel 9710
SHFE (Base Metals) (Yuan per tones)
Commodity Closing Price
Copper 47020
Aluminum 13735
Zinc 22690
Lead 18545
Closing as on 23.01.17 Closing as on 23.01.17
LME INVENTORY DATA
Aaj Ka Trend
17-Jan-17 18-Jan-17 19-Jan-17 20-Jan-17 23-Jan-17
Aluminium 45825 3775 -175 -1750 -9350
Copper -1625 -1325 -1950 1300 -750
Lead 2382 -50 -425 2400 -200
Nickel 575 -850 -228 978 -36
Zinc -2225 175 -2775 -2500 -1850
24th Jan’17
5. Equities I Commodities I Currencies I Mutual Funds
This is solely for information of clients of Choice Broking and does not construe to be an investment advice. It is also not intended as an offer or solicitation
for the purchase and sale of any financial instruments. Any action taken by you on the basis of the information contained herein is your responsibility alone
and Choice Broking its subsidiaries or its employees or associates will not be liable in any manner for the consequences of such action taken by you. We
have exercised due diligence in checking the correctness and authenticity of the information contained in this recommendation, but Choice Broking or any of
its subsidiaries or associates or employees shall not be in any way responsible for any loss or damage that may arise to any person from any inadvertent
error in the information contained in this recommendation or any action taken on basis of this information. Technical analysis studies market psychology,
price patterns and volume levels. It is used to forecast future price and market movements. Technical analysis is complementary to fundamental analysis
and news sources. The recommendations issued herewith might be contrary to recommendations issued by Choice Broking in the company research
undertaken as the recommendations stated in this report is derived purely from technical analysis. Choice Broking has based this document on information
obtained from sources it believes to be reliable but which it has not independently verified; Choice Broking makes no guarantee, representation or warranty
and accepts no responsibility or liability as to its accuracy or completeness. The opinions contained within the report are based upon publicly available
information at the time of publication and are subject to change without notice. The information and any disclosures provided herein are in summary form
and have been prepared for informational purposes. The recommendations and suggested price levels are intended purely for trading purposes. The
recommendations are valid for the day of the report however trading trends and volumes might vary substantially on an intraday basis and the
recommendations may be subject to change. The information and any disclosures provided herein may be considered confidential. Any use, distribution,
modification, copying, forwarding or disclosure by any person is strictly prohibited. The information and any disclosures provided herein do not constitute a
solicitation or offer to purchase or sell any security or other financial product or instrument. The current performance may be unaudited. Past performance
does not guarantee future returns. There can be no assurance that investments will achieve any targeted rates of return, and there is no guarantee against
the loss of your entire investment.
POTENTIAL CONFLICT OF INTEREST DISCLOSURE (as on date of report) Disclosure of interest statement – • Analyst interest of the stock
/Instrument(s): - No. • Firm interest of the stock / Instrument (s): - No.
Disclaimer
Contact Us
Amit Pathania
Research Associate
amit.pathania@choiceindia.com
www.choicebroking.incustomercare@choiceindia.com
SEBI Registered - Research Analyst Equities I Commodities I Currencies I Mutual Funds
Aaj Ka Trend
24th Jan’17
Neeraj Yadav
Research Advisor
neeraj.yadav@choiceindia.com
Anish Vyas
Senior Research Associate
anish.vyas@choiceindia.com
Anish Vyas
Digitally signed by Anish Vyas
DN: cn=Anish Vyas, o=Choice Merchandise
Broking Pvt. Ltd, ou=Sr. Research Associate,
email=anish.vyas@choiceindia.com, c=IN
Date: 2017.01.24 09:53:19 +05'30'