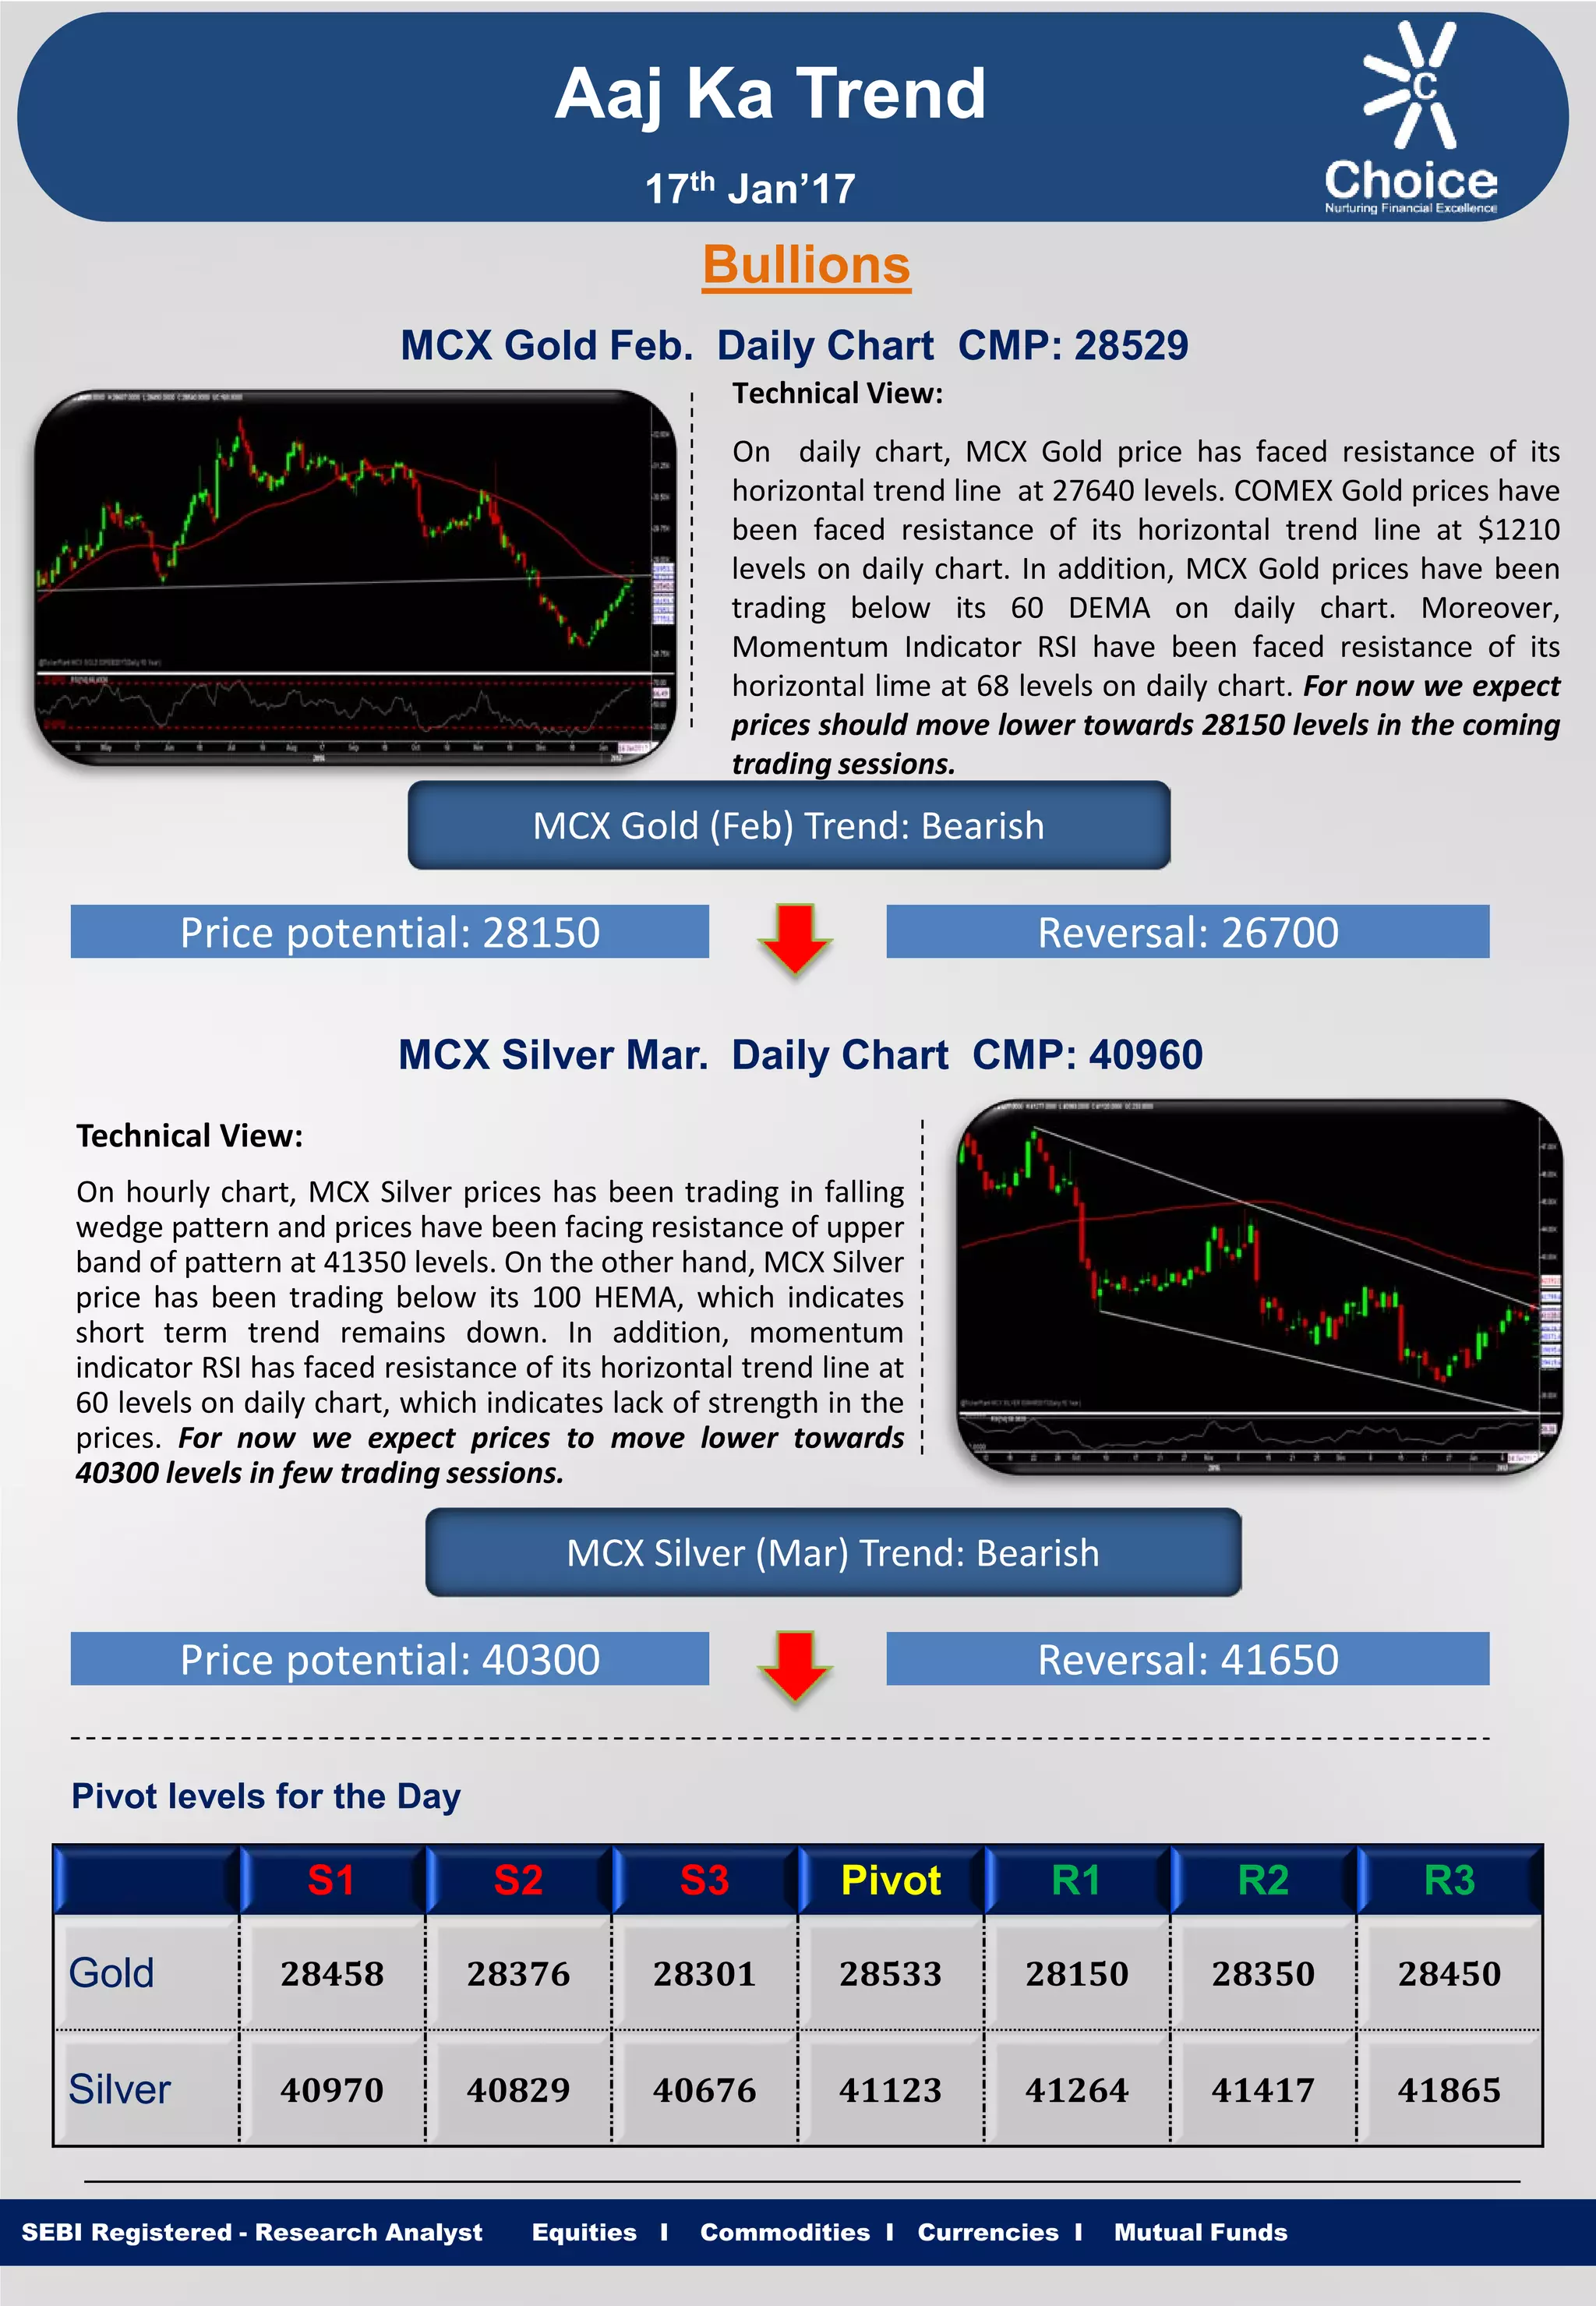
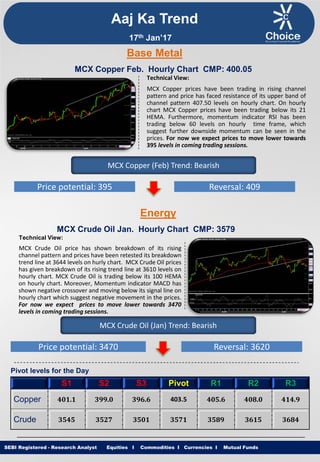
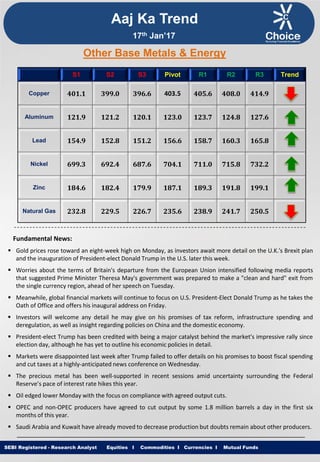
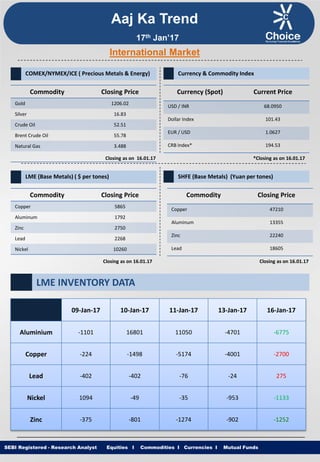
Equities I Commodities I Currencies I Mutual Funds
Aaj Ka Trend
Technical View:
On daily chart, MCX Gold price has faced resistance of its
horizontal trend line at 27640 levels. COMEX Gold prices have
been faced resistance of its horizontal trend line at $1210
levels on daily chart. In addition, MCX Gold prices have been
trading below its 60 DEMA on daily chart. Moreover,
Momentum Indicator RSI have been faced resistance of its
horizontal lime at 68 levels on daily chart. For now we expect
prices should move lower towards 28150 levels in the coming
trading sessions.
SEBI Registered - Research Analyst Equities I Commodities I Currencies I Mutual Funds
Bullions
MCX Gold Feb. Daily Chart CMP: 28529
MCX Gold (Feb) Trend: Bearish
Price potential: 28150 Reversal: 26700
MCX Silver Mar. Daily Chart CMP: 40960
Technical View:
On hourly chart, MCX Silver prices has been trading in falling
wedge pattern and prices have been facing resistance of upper
band of pattern at 41350 levels. On the other hand, MCX Silver
price has been trading below its 100 HEMA, which indicates
short term trend remains down. In addition, momentum
indicator RSI has faced resistance of its horizontal trend line at
60 levels on daily chart, which indicates lack of strength in the
prices. For now we expect prices to move lower towards
40300 levels in few trading sessions.
MCX Silver (Mar) Trend: Bearish
Price potential: 40300 Reversal: 41650
Pivot levels for the Day
S1 S2 S3 Pivot R1 R2 R3
Gold 28458 28376 28301 28533 28150 28350 28450
Silver 40970 40829 40676 41123 41264 41417 41865
17th Jan’17
Equities I Commodities I Currencies I Mutual Funds
Technical View:
MCX Copper prices have been trading in rising channel
pattern and price has faced resistance of its upper band of
channel pattern 407.50 levels on hourly chart. On hourly
chart MCX Copper prices have been trading below its 21
HEMA. Furthermore, momentum indicator RSI has been
trading below 60 levels on hourly time frame, which
suggest further downside momentum can be seen in the
prices. For now we expect prices to move lower towards
395 levels in coming trading sessions.
SEBI Registered - Research Analyst Equities I Commodities I Currencies I Mutual Funds
MCX Copper Feb. Hourly Chart CMP: 400.05
MCX Copper (Feb) Trend: Bearish
Price potential: 395 Reversal: 409
MCX Crude Oil Jan. Hourly Chart CMP: 3579
Technical View:
MCX Crude Oil price has shown breakdown of its rising
channel pattern and prices have been retested its breakdown
trend line at 3644 levels on hurly chart. MCX Crude Oil prices
has given breakdown of its rising trend line at 3610 levels on
hourly chart. MCX Crude Oil is trading below its 100 HEMA
on hourly chart. Moreover, Momentum indicator MACD has
shown negative crossover and moving below its signal line on
hourly chart which suggest negative movement in the prices.
For now we expect prices to move lower towards 3470
levels in coming trading sessions.
MCX Crude Oil (Jan) Trend: Bearish
Price potential: 3470 Reversal: 3620
Pivot levels for the Day
S1 S2 S3 Pivot R1 R2 R3
Copper 401.1 399.0 396.6 403.5 405.6 408.0 414.9
Crude 3545 3527 3501 3571 3589 3615 3684
Base Metal
Energy
Aaj Ka Trend
17th Jan’17
Equities I Commodities I Currencies I Mutual FundsSEBI Registered - Research Analyst Equities I Commodities I Currencies I Mutual Funds
Other Base Metals & Energy
S1 S2 S3 Pivot R1 R2 R3 Trend
Copper 401.1 399.0 396.6 403.5 405.6 408.0 414.9
Aluminum 121.9 121.2 120.1 123.0 123.7 124.8 127.6
Lead 154.9 152.8 151.2 156.6 158.7 160.3 165.8
Nickel 699.3 692.4 687.6 704.1 711.0 715.8 732.2
Zinc 184.6 182.4 179.9 187.1 189.3 191.8 199.1
Natural Gas 232.8 229.5 226.7 235.6 238.9 241.7 250.5
Fundamental News:
 Gold prices rose toward an eight-week high on Monday, as investors await more detail on the U.K.'s Brexit plan
and the inauguration of President-elect Donald Trump in the U.S. later this week.
 Worries about the terms of Britain's departure from the European Union intensified following media reports
that suggested Prime Minister Theresa May's government was prepared to make a "clean and hard" exit from
the single currency region, ahead of her speech on Tuesday.
 Meanwhile, global financial markets will continue to focus on U.S. President-Elect Donald Trump as he takes the
Oath of Office and offers his inaugural address on Friday.
 Investors will welcome any detail he may give on his promises of tax reform, infrastructure spending and
deregulation, as well as insight regarding policies on China and the domestic economy.
 President-elect Trump has been credited with being a major catalyst behind the market's impressive rally since
election day, although he has yet to outline his economic policies in detail.
 Markets were disappointed last week after Trump failed to offer details on his promises to boost fiscal spending
and cut taxes at a highly-anticipated news conference on Wednesday.
 The precious metal has been well-supported in recent sessions amid uncertainty surrounding the Federal
Reserve’s pace of interest rate hikes this year.
 Oil edged lower Monday with the focus on compliance with agreed output cuts.
 OPEC and non-OPEC producers have agreed to cut output by some 1.8 million barrels a day in the first six
months of this year.
 Saudi Arabia and Kuwait have already moved to decrease production but doubts remain about other producers.
Aaj Ka Trend
17th Jan’17
Equities I Commodities I Currencies I Mutual FundsSEBI Registered - Research Analyst Equities I Commodities I Currencies I Mutual Funds
International Market
Commodity Closing Price
Gold 1206.02
Silver 16.83
Crude Oil 52.51
Brent Crude Oil 55.78
Natural Gas 3.488
COMEX/NYMEX/ICE ( Precious Metals & Energy) Currency & Commodity Index
Currency (Spot) Current Price
USD / INR 68.0950
Dollar Index 101.43
EUR / USD 1.0627
CRB Index* 194.53
Closing as on 16.01.17 *Closing as on 16.01.17
LME (Base Metals) ( $ per tones)
Commodity Closing Price
Copper 5865
Aluminum 1792
Zinc 2750
Lead 2268
Nickel 10260
SHFE (Base Metals) (Yuan per tones)
Commodity Closing Price
Copper 47210
Aluminum 13355
Zinc 22240
Lead 18605
Closing as on 16.01.17 Closing as on 16.01.17
LME INVENTORY DATA
Aaj Ka Trend
09-Jan-17 10-Jan-17 11-Jan-17 13-Jan-17 16-Jan-17
Aluminium -1101 16801 11050 -4701 -6775
Copper -224 -1498 -5174 -4001 -2700
Lead -402 -402 -76 -24 275
Nickel 1094 -49 -35 -953 -1133
Zinc -375 -801 -1274 -902 -1252
17th Jan’17
Equities I Commodities I Currencies I Mutual Funds
This is solely for information of clients of Choice Broking and does not construe to be an investment advice. It is also not intended as an offer or solicitation
for the purchase and sale of any financial instruments. Any action taken by you on the basis of the information contained herein is your responsibility alone
and Choice Broking its subsidiaries or its employees or associates will not be liable in any manner for the consequences of such action taken by you. We
have exercised due diligence in checking the correctness and authenticity of the information contained in this recommendation, but Choice Broking or any of
its subsidiaries or associates or employees shall not be in any way responsible for any loss or damage that may arise to any person from any inadvertent
error in the information contained in this recommendation or any action taken on basis of this information. Technical analysis studies market psychology,
price patterns and volume levels. It is used to forecast future price and market movements. Technical analysis is complementary to fundamental analysis
and news sources. The recommendations issued herewith might be contrary to recommendations issued by Choice Broking in the company research
undertaken as the recommendations stated in this report is derived purely from technical analysis. Choice Broking has based this document on information
obtained from sources it believes to be reliable but which it has not independently verified; Choice Broking makes no guarantee, representation or warranty
and accepts no responsibility or liability as to its accuracy or completeness. The opinions contained within the report are based upon publicly available
information at the time of publication and are subject to change without notice. The information and any disclosures provided herein are in summary form
and have been prepared for informational purposes. The recommendations and suggested price levels are intended purely for trading purposes. The
recommendations are valid for the day of the report however trading trends and volumes might vary substantially on an intraday basis and the
recommendations may be subject to change. The information and any disclosures provided herein may be considered confidential. Any use, distribution,
modification, copying, forwarding or disclosure by any person is strictly prohibited. The information and any disclosures provided herein do not constitute a
solicitation or offer to purchase or sell any security or other financial product or instrument. The current performance may be unaudited. Past performance
does not guarantee future returns. There can be no assurance that investments will achieve any targeted rates of return, and there is no guarantee against
the loss of your entire investment.
POTENTIAL CONFLICT OF INTEREST DISCLOSURE (as on date of report) Disclosure of interest statement – • Analyst interest of the stock
/Instrument(s): - No. • Firm interest of the stock / Instrument (s): - No.
Disclaimer
Contact Us
Amit Pathania
Research Associate
amit.pathania@choiceindia.com
www.choicebroking.incustomercare@choiceindia.com
SEBI Registered - Research Analyst Equities I Commodities I Currencies I Mutual Funds
Aaj Ka Trend
17th Jan’17
Neeraj Yadav
Research Advisor
neeraj.yadav@choiceindia.com
Anish Vyas
Senior Research Associate
anish.vyas@choiceindia.com
Anish Vyas
Digitally signed by Anish Vyas
DN: cn=Anish Vyas, o=Choice Merchandise
Broking Pvt. Ltd, ou=Sr. Research Associate,
email=anish.vyas@choiceindia.com, c=IN
Date: 2017.01.17 09:06:55 +05'30'

Aaj ka trend 17.01.17

  • 1.
    Equities I CommoditiesI Currencies I Mutual Funds Aaj Ka Trend Technical View: On daily chart, MCX Gold price has faced resistance of its horizontal trend line at 27640 levels. COMEX Gold prices have been faced resistance of its horizontal trend line at $1210 levels on daily chart. In addition, MCX Gold prices have been trading below its 60 DEMA on daily chart. Moreover, Momentum Indicator RSI have been faced resistance of its horizontal lime at 68 levels on daily chart. For now we expect prices should move lower towards 28150 levels in the coming trading sessions. SEBI Registered - Research Analyst Equities I Commodities I Currencies I Mutual Funds Bullions MCX Gold Feb. Daily Chart CMP: 28529 MCX Gold (Feb) Trend: Bearish Price potential: 28150 Reversal: 26700 MCX Silver Mar. Daily Chart CMP: 40960 Technical View: On hourly chart, MCX Silver prices has been trading in falling wedge pattern and prices have been facing resistance of upper band of pattern at 41350 levels. On the other hand, MCX Silver price has been trading below its 100 HEMA, which indicates short term trend remains down. In addition, momentum indicator RSI has faced resistance of its horizontal trend line at 60 levels on daily chart, which indicates lack of strength in the prices. For now we expect prices to move lower towards 40300 levels in few trading sessions. MCX Silver (Mar) Trend: Bearish Price potential: 40300 Reversal: 41650 Pivot levels for the Day S1 S2 S3 Pivot R1 R2 R3 Gold 28458 28376 28301 28533 28150 28350 28450 Silver 40970 40829 40676 41123 41264 41417 41865 17th Jan’17
  • 2.
    Equities I CommoditiesI Currencies I Mutual Funds Technical View: MCX Copper prices have been trading in rising channel pattern and price has faced resistance of its upper band of channel pattern 407.50 levels on hourly chart. On hourly chart MCX Copper prices have been trading below its 21 HEMA. Furthermore, momentum indicator RSI has been trading below 60 levels on hourly time frame, which suggest further downside momentum can be seen in the prices. For now we expect prices to move lower towards 395 levels in coming trading sessions. SEBI Registered - Research Analyst Equities I Commodities I Currencies I Mutual Funds MCX Copper Feb. Hourly Chart CMP: 400.05 MCX Copper (Feb) Trend: Bearish Price potential: 395 Reversal: 409 MCX Crude Oil Jan. Hourly Chart CMP: 3579 Technical View: MCX Crude Oil price has shown breakdown of its rising channel pattern and prices have been retested its breakdown trend line at 3644 levels on hurly chart. MCX Crude Oil prices has given breakdown of its rising trend line at 3610 levels on hourly chart. MCX Crude Oil is trading below its 100 HEMA on hourly chart. Moreover, Momentum indicator MACD has shown negative crossover and moving below its signal line on hourly chart which suggest negative movement in the prices. For now we expect prices to move lower towards 3470 levels in coming trading sessions. MCX Crude Oil (Jan) Trend: Bearish Price potential: 3470 Reversal: 3620 Pivot levels for the Day S1 S2 S3 Pivot R1 R2 R3 Copper 401.1 399.0 396.6 403.5 405.6 408.0 414.9 Crude 3545 3527 3501 3571 3589 3615 3684 Base Metal Energy Aaj Ka Trend 17th Jan’17
  • 3.
    Equities I CommoditiesI Currencies I Mutual FundsSEBI Registered - Research Analyst Equities I Commodities I Currencies I Mutual Funds Other Base Metals & Energy S1 S2 S3 Pivot R1 R2 R3 Trend Copper 401.1 399.0 396.6 403.5 405.6 408.0 414.9 Aluminum 121.9 121.2 120.1 123.0 123.7 124.8 127.6 Lead 154.9 152.8 151.2 156.6 158.7 160.3 165.8 Nickel 699.3 692.4 687.6 704.1 711.0 715.8 732.2 Zinc 184.6 182.4 179.9 187.1 189.3 191.8 199.1 Natural Gas 232.8 229.5 226.7 235.6 238.9 241.7 250.5 Fundamental News:  Gold prices rose toward an eight-week high on Monday, as investors await more detail on the U.K.'s Brexit plan and the inauguration of President-elect Donald Trump in the U.S. later this week.  Worries about the terms of Britain's departure from the European Union intensified following media reports that suggested Prime Minister Theresa May's government was prepared to make a "clean and hard" exit from the single currency region, ahead of her speech on Tuesday.  Meanwhile, global financial markets will continue to focus on U.S. President-Elect Donald Trump as he takes the Oath of Office and offers his inaugural address on Friday.  Investors will welcome any detail he may give on his promises of tax reform, infrastructure spending and deregulation, as well as insight regarding policies on China and the domestic economy.  President-elect Trump has been credited with being a major catalyst behind the market's impressive rally since election day, although he has yet to outline his economic policies in detail.  Markets were disappointed last week after Trump failed to offer details on his promises to boost fiscal spending and cut taxes at a highly-anticipated news conference on Wednesday.  The precious metal has been well-supported in recent sessions amid uncertainty surrounding the Federal Reserve’s pace of interest rate hikes this year.  Oil edged lower Monday with the focus on compliance with agreed output cuts.  OPEC and non-OPEC producers have agreed to cut output by some 1.8 million barrels a day in the first six months of this year.  Saudi Arabia and Kuwait have already moved to decrease production but doubts remain about other producers. Aaj Ka Trend 17th Jan’17
  • 4.
    Equities I CommoditiesI Currencies I Mutual FundsSEBI Registered - Research Analyst Equities I Commodities I Currencies I Mutual Funds International Market Commodity Closing Price Gold 1206.02 Silver 16.83 Crude Oil 52.51 Brent Crude Oil 55.78 Natural Gas 3.488 COMEX/NYMEX/ICE ( Precious Metals & Energy) Currency & Commodity Index Currency (Spot) Current Price USD / INR 68.0950 Dollar Index 101.43 EUR / USD 1.0627 CRB Index* 194.53 Closing as on 16.01.17 *Closing as on 16.01.17 LME (Base Metals) ( $ per tones) Commodity Closing Price Copper 5865 Aluminum 1792 Zinc 2750 Lead 2268 Nickel 10260 SHFE (Base Metals) (Yuan per tones) Commodity Closing Price Copper 47210 Aluminum 13355 Zinc 22240 Lead 18605 Closing as on 16.01.17 Closing as on 16.01.17 LME INVENTORY DATA Aaj Ka Trend 09-Jan-17 10-Jan-17 11-Jan-17 13-Jan-17 16-Jan-17 Aluminium -1101 16801 11050 -4701 -6775 Copper -224 -1498 -5174 -4001 -2700 Lead -402 -402 -76 -24 275 Nickel 1094 -49 -35 -953 -1133 Zinc -375 -801 -1274 -902 -1252 17th Jan’17
  • 5.
    Equities I CommoditiesI Currencies I Mutual Funds This is solely for information of clients of Choice Broking and does not construe to be an investment advice. It is also not intended as an offer or solicitation for the purchase and sale of any financial instruments. Any action taken by you on the basis of the information contained herein is your responsibility alone and Choice Broking its subsidiaries or its employees or associates will not be liable in any manner for the consequences of such action taken by you. We have exercised due diligence in checking the correctness and authenticity of the information contained in this recommendation, but Choice Broking or any of its subsidiaries or associates or employees shall not be in any way responsible for any loss or damage that may arise to any person from any inadvertent error in the information contained in this recommendation or any action taken on basis of this information. Technical analysis studies market psychology, price patterns and volume levels. It is used to forecast future price and market movements. Technical analysis is complementary to fundamental analysis and news sources. The recommendations issued herewith might be contrary to recommendations issued by Choice Broking in the company research undertaken as the recommendations stated in this report is derived purely from technical analysis. Choice Broking has based this document on information obtained from sources it believes to be reliable but which it has not independently verified; Choice Broking makes no guarantee, representation or warranty and accepts no responsibility or liability as to its accuracy or completeness. The opinions contained within the report are based upon publicly available information at the time of publication and are subject to change without notice. The information and any disclosures provided herein are in summary form and have been prepared for informational purposes. The recommendations and suggested price levels are intended purely for trading purposes. The recommendations are valid for the day of the report however trading trends and volumes might vary substantially on an intraday basis and the recommendations may be subject to change. The information and any disclosures provided herein may be considered confidential. Any use, distribution, modification, copying, forwarding or disclosure by any person is strictly prohibited. The information and any disclosures provided herein do not constitute a solicitation or offer to purchase or sell any security or other financial product or instrument. The current performance may be unaudited. Past performance does not guarantee future returns. There can be no assurance that investments will achieve any targeted rates of return, and there is no guarantee against the loss of your entire investment. POTENTIAL CONFLICT OF INTEREST DISCLOSURE (as on date of report) Disclosure of interest statement – • Analyst interest of the stock /Instrument(s): - No. • Firm interest of the stock / Instrument (s): - No. Disclaimer Contact Us Amit Pathania Research Associate amit.pathania@choiceindia.com www.choicebroking.incustomercare@choiceindia.com SEBI Registered - Research Analyst Equities I Commodities I Currencies I Mutual Funds Aaj Ka Trend 17th Jan’17 Neeraj Yadav Research Advisor neeraj.yadav@choiceindia.com Anish Vyas Senior Research Associate anish.vyas@choiceindia.com Anish Vyas Digitally signed by Anish Vyas DN: cn=Anish Vyas, o=Choice Merchandise Broking Pvt. Ltd, ou=Sr. Research Associate, email=anish.vyas@choiceindia.com, c=IN Date: 2017.01.17 09:06:55 +05'30'